Las Vegas Industrial Market Stabilizes as Vacancy Falls to 15
•
1 gostou•320 visualizações

2Q11 Industrial Las Vegas Market Report

Recomendados
Recomendados
Mais conteúdo relacionado
Mais procurados
Mais procurados (18)
Destaque
Destaque (20)
Semelhante a Las Vegas Industrial Market Stabilizes as Vacancy Falls to 15
Semelhante a Las Vegas Industrial Market Stabilizes as Vacancy Falls to 15 (20)
Mais de Jessica Parrish
Mais de Jessica Parrish (8)
Las Vegas Industrial Market Stabilizes as Vacancy Falls to 15
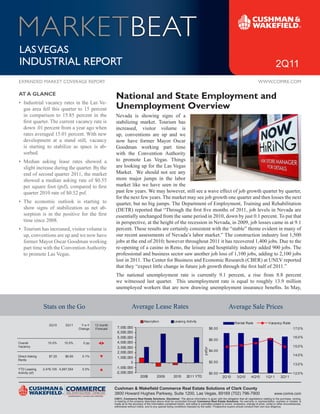
- 1. MARKETBEAT Las Vegas IndustrIaL report 2Q11 expanded Market CoVerage report www.CoMre.CoM AT A GLANCE National and State Employment and • Industrial vacancy rates in the Las Ve- gas area fell this quarter to 15 percent Unemployment Overview in comparison to 15.85 percent in the Nevada is showing signs of a first quarter. The current vacancy rate is stabilizing market. Tourism has down .01 percent from a year ago when increased, visitor volume is rates averaged 15.01 percent. With new up, conventions are up and we development at a stand still, vacancy now have former Mayor Oscar is starting to stabilize as space is ab- Goodman working part time sorbed. with the Convention Authority • Median asking lease rates showed a to promote Las Vegas. Things slight increase during the quarter. By the are looking up for the Las Vegas end of second quarter 2011, the market Market. We should not see any showed a median asking rate of $0.55 more major jumps in the labor per square foot (psf), compared to first market like we have seen in the quarter 2010 rate of $0.52 psf. past few years. We may however, still see a wave effect of job growth quarter by quarter, for the next few years. The market may see job growth one quarter and then losses the next • The economic outlook is starting to quarter, but no big jumps. The Department of Employment, Training and Rehabilitation show signs of stabilization as net ab- (DETR) reported that “Through the first five months of 2011, job levels in Nevada are sorption is in the positive for the first essentially unchanged from the same period in 2010, down by just 0.1 percent. To put that time since 2008. in perspective, at the height of the recession in Nevada, in 2009, job losses came in at 9.1 • Tourism has increased, visitor volume is percent. These results are certainly consistent with the “stable” theme evident in many of up, conventions are up and we now have our recent assessments of Nevada’s labor market.” The construction industry lost 1,500 former Mayor Oscar Goodman working jobs at the end of 2010; however throughout 2011 it has recovered 1,400 jobs. Due to the part time with the Convention Authority re-opening of a casino in Reno, the leisure and hospitality industry added 900 jobs. The to promote Las Vegas. professional and business sector saw another job loss of 1,100 jobs, adding to 2,100 jobs lost in 2011. The Center for Business and Economic Research (CBER) at UNLV reported that they “expect little change in future job growth through the first half of 2011.” The national unemployment rate is currently 9.1 percent, a rise from 8.8 percent we witnessed last quarter. This unemployment rate is equal to roughly 13.9 million unemployed workers that are now drawing unemployment insurance benefits. In May, Stats on the Go Average Lease Rates Average Sale Prices Absorption Leasing Activity Rental Rate Vacancy Rate 2Q10 2Q11 Y-o-Y 12 month Change Forecast 7,000,000 $8.00 17.0% 6,000,000 5,000,000 16.0% $6.00 Overall 15.0% 15.0% 0 pp 4,000,000 Vacancy 3,000,000 15.0% psf/yr 2,000,000 $4.00 Direct Asking $7.20 $6.60 0.1% 14.0% 1,000,000 Rents 0 $2.00 13.0% YTD Leasing 2,478,105 4,997,554 0.5% -1,000,000 Activity (sf) -2,000,000 $0.00 12.0% 2008 2009 2010 2011 YTD 2Q10 3Q10 4Q10 1Q11 2Q11 Cushman & Wakefield Commerce Real Estate Solutions of Clark County 3800 Howard Hughes Parkway, Suite 1200, Las Vegas, 89169 (702) 796-7900 www.comre.com ©2011, Commerce Real Estate Solutions. Disclaimer: The above information is given with the obligation that all negotiations relating to the purchase, renting, or leasing of the property described above shall be conducted through Commerce Real Estate Solutions. No warranty or representation, express or implied, is made as to the accuracy of the information contained herein, and same is submitted subject to errors, omissions, change of price, rental or other encumbrances, withdrawal without notice, and to any special listing conditions imposed by the seller. Prospective buyers should conduct their own due diligence.
- 2. MARKETBEAT Las Vegas IndustrIaL report 2Q11 sIgnIFICant 2Q11 Lease transaCtIons BuILdIng suBMarket tenant sQuare Feet propertY tYpe Golden Triangle Industrial Park North Las Vegas Synq Solutions Inc 101,204 Warehouse/Distribution Golden Triangle Industrial Park North Las Vegas Desert Portable Storage 90,420 Warehouse/Distribution 3325 W Sunset Rd Southwest Freeman Audio Solutions 86,125 Warehouse/Distribution * Renewal – not included in leasing activity statistics sIgnIFICant 2Q11 saLe transaCtIons BuILdIng suBMarket BuYer sQuare Feet purCHase prICe 6590 Bermuda Rd Airport Bermuda Road Properties, LLC 135,400 $11,000,000 5220 E Russell Rd Southeast Oasis Baptist Church 35,878 $6,500,000 2762-2772 Abels Ln North Las Vegas Slawomir M & Barbara Warzocha 20,000 $350,000 sIgnIFICant 2Q11 ConstruCtIon CoMpLetIons BuILdIng suBMarket MaJor tenant sQuare Feet CoMpLetIon date N/A sIgnIFICant proJeCts under ConstruCtIon/renoVatIon BuILdIng suBMarket MaJor tenant sQuare Feet CoMpLetIon date N/A 22 states recorded unemployment rate increases, however 27 rates are driven by weak tenant demand and marginal stability, states posted jobless rates significantly lower than the national combined with lease concessions, defaults and downsizing. Net rate. The highest regional jobless rates were again in the Western absorption, the measure of space leased from one reporting period part of the country, while the Northeast recorded the lowest rates. to the next, for the second quarter was at 763,331sf. This is the Nevada continues to show the highest unemployment rates in the first time since fourth quarter 2008 when net absorption has seen nation and has been in the double-digits for the past 28 months. a positive number. The North Las Vegas submarket showed the The last time we were in the double-digits for this length of time greatest improvement of absorption with 645,654sf for second was in 1980 and that only lasted for 15 months straight. The states quarter, while the Southwest submarket posted the least amount with the next highest rates were California at 11.7 percent and with -25,112 sf of negative absorption. Rhode Island at 10.9 percent unemployment rates. North Dakota Note: Due to reclassifications of, and adjustments to, data between reported the lowest jobless rate, 3.2 percent, followed by South reporting periods, the commercial market data for the latest quarter Dakota and Nebraska, 4.8 and 4.1 percent, respectively. Nevada may not necessarily be comparable to a previously reported quarter. also held the record this quarter as the state with the largest over- the-month unemployment rate decrease, which shows a good sign of stabilization. 18% Industrial: Quarterly Vacancy 16% 15% 14% 13% 12% 11% Las Vegas – 12.4% 10% Nevada – 12.1% 9% US – 9.1% 8% 7% 6% 5% Unemployment rates 2Q11 4% 3% 2% 1% 0% -1% 1Q07 2Q07 3Q07 4Q07 1Q08 2Q08 3Q08 4Q08 1Q09 2Q09 3Q09 4Q09 1Q10 2Q10 3Q10 4Q10 1Q11 2Q11 7 7 7 8 8 8 0 8 9 9 9 9 0 0 0 1 1 20 30 40 10 20 30 40 11 21 31 41 11 21 40 10 20 30 Q Q Q Q Q Q Q Q Q Q Q Q Q Q Q Q Q Industrial: Quarterly Absorption (SF) Las Vegas Industrial Market 2,000,000 1,500,000 Vacancy 1,000,000 500,000 The Las Vegas industrial market showed a downward movement - in vacancy dropping to 15 percent during second quarter 2011. The Q2 07 Q3 07 Q4 07 Q1 08 Q2 08 Q308 Q408 Q109 Q209 Q309 Q409 Q110 Q210 Q310 Q410 Q111 Q211 (500,000) Central submarket continues to show the lowest vacancy rate at 8.14 (1,000,000) percent along with the Southeast submarket at 13.91percent and (1,500,000) North Las Vegas submarket at 13.64 percent. The highest vacancy (2,000,000) submarkets are the Northwest at 26.37percent, Airport at 20.44 (2,500,000) percent and West submarket at 18.09 percent. The high vacancy (3,000,000) Cushman & Wakefield Commerce Real Estate Solutions of Clark County 3800 Howard Hughes Parkway, Suite 1200, Las Vegas, 89169 (702) 796-7900 www.comre.com ©2011, Commerce Real Estate Solutions. Disclaimer: The above information is given with the obligation that all negotiations relating to the purchase, renting, or leasing of the property described above shall be conducted through Commerce Real Estate Solutions. No warranty or representation, express or implied, is made as to the accuracy of the information contained herein, and same is submitted subject to errors, omissions, change of price, rental or other encumbrances, withdrawal without notice, and to any special listing conditions imposed by the seller. Prospective buyers should conduct their own due diligence.
- 3. MARKETBEAT Las Vegas IndustrIaL report 2Q11 Industrial: Inventory (SF) and Vacancy Rate (%) New Supply (Completions) and Market 110,000,000 18% 16% Demand 100,000,000 14% 15.00% 12% Developers have halted many projects resulting in no new 90,000,000 10% construction completions during second quarter. Going forward, 80,000,000 8% only 22,000 sf of under construction product is still in the 6% pipeline. With the continued hesitation of developers to build 4% 70,000,000 2% product due to scarce construction financing and weak rents, we 60,000,000 0% also do not expect much of the planned product to come online any time soon. Future new supply levels will continue to shrink as 7 7 7 8 8 8 8 9 9 9 9 0 0 0 0 1 1 20 30 30 40 40 10 10 20 20 30 40 11 21 31 41 11 21 Q Q Q Q Q Q Q Q Q Q Q Q Q Q Q Q Q Quarterly Inventory Overall Vacancy Rates market corrections are underway. It may take another five years for the housing market to become stable, credit to start flowing Industrial: Industrial Employment vs Vacancy Rate (%) and employment to become active again before any rise in 200,000 18% construction numbers. For a smart recovery, the industrial market 175,000 needs to solve the imbalance of supply and demand by allowing 150,000 15.37% 15.00% 16% existing vacant space to be absorbed and wait out this business 15.01% 15.01% 15.13% cycle before any major growth should happen. 125,000 14.03% 14% 100,000 Pricing (Sales and Average Asking Rents) 75,000 12% With the growth of banked owned / foreclosed properties that have come on in the market we are starting to also see a growth in 50,000 10% industrial building sales. During second quarter 2011, there was 9 0 0 0 0 1 40 11 21 31 41 21 a total of 328,045 sf of inventory sold. Owner/user sales have a Q Q Q Q Q Q large portion of total sales with 243,021 sf compared to investment Industrial Type Vacancy Rates sales of 85,024 sf. So far this year alone, the industrial market has Distribution, 12.06% sold more than 844,600 sf of projects, which is almost the same Midbay, 17.59% amount that the market sold in all of last year. This is a great time for investors or owner/users to invest in industrial properties in the Las Vegas market due to the quality inventory and current asking prices. With the growth of building sales, lease rates are expected to remain low for many more years to come. By second quarter Flex, 20.59% 2011, the market reported industrial median asking rental rates of $0.55 sf/NNN. By product type, median asking distribution Incubator, 18.82% lease rates remained stable at $0.46 sf/NNN by the end of the second quarter; light industrial units had a rise from the reported rents of $0.52 sf/NNN last quarter to the current $0.55 sf/NNN; flex space saw a slight decrease from $0.61 sf/NNN last quarter Light Indu, 14.66% to the current $0.60 sf/NNN; pricing for midbay went up from a median asking rate of $0.49 sf/NNN to the current rate of $0.52 sf/NNN; while incubator product fell from a median asking rate Industrial Submarket - Direct vs Sublease Vacancy 35.00% of $0.60 sf/NNN to $0.58 sf/NNN. Landlords are starting to level 30.00% 26.37% off with price adjustments and with high concessions, lease rates 25.00% 20.44% are stabilizing. 20.00% 18.09% 15.09% 14.52% 15.00% 13.91% 13.64% 15.00% 10.00% 8.14% 5.00% 0.00% 0.00% 0.07% 0.00% 0.00% 0.00% 0.05% 0.14% 0.04% 0.00% North Las Las Vegas Area Airport Central Southeast Speedway Northwest Southwest West Vegas Total Vacacny % 20.44% 8.14% 13.91% 13.64% 15.09% 26.37% 14.52% 18.09% 15.00% Sublease % 0.00% 0.00% 0.07% 0.00% 0.00% 0.00% 0.05% 0.14% 0.04% Cushman & Wakefield Commerce Real Estate Solutions of Clark County 3800 Howard Hughes Parkway, Suite 1200, Las Vegas, 89169 (702) 796-7900 www.comre.com ©2011, Commerce Real Estate Solutions. Disclaimer: The above information is given with the obligation that all negotiations relating to the purchase, renting, or leasing of the property described above shall be conducted through Commerce Real Estate Solutions. No warranty or representation, express or implied, is made as to the accuracy of the information contained herein, and same is submitted subject to errors, omissions, change of price, rental or other encumbrances, withdrawal without notice, and to any special listing conditions imposed by the seller. Prospective buyers should conduct their own due diligence.
- 4. MARKETBEAT Las Vegas IndustrIaL report 2Q11 Industrial Owner User Sales: User Sales (SF) and Average Price Per Bldg (SF) Industrial Investment Sales: Investment and Average Price Per Bldg 1,200,000 $350.00 1,200,000 $300.00 1,000,000 $300.00 1,000,000 $250.00 $250.00 800,000 800,000 $200.00 $200.00 600,000 600,000 $150.00 $150.00 400,000 400,000 $100.00 $100.00 200,000 $50.00 200,000 $50.00 - $0.00 - $0.00 7 7 7 8 8 8 8 9 9 9 9 0 0 0 0 1 1 20 30 40 10 20 30 40 11 21 31 41 11 21 20 40 30 10 7 7 7 8 8 8 8 9 9 9 9 0 0 0 0 1 1 Q Q Q Q Q Q Q Q Q Q Q Q Q 20 30 40 10 20 30 40 11 21 31 41 11 21 30 10 20 40 Q Q Q Q Q Q Q Q Q Q Q Q Q Q Q Q Q Q Q Q Q Investment sales sf Average Price Per Bldg sf Owner user sales sf Average Price Per Bldg sf Industrial Type Average Lease Rates Industrial: Inventory Vacancy Rate vs Average Lease Rate Midbay, $0.52 Distribution, $0.46 18.00% $0.90 17.00% 16.00% $0.80 15.00% 14.00% $0.70 13.00% $0.60 12.00% 11.00% $0.50 10.00% 9.00% $0.40 8.00% 7.00% $0.30 Flex, $0.60 6.00% Incubator, $0.58 5.00% $0.20 4.00% 3.00% $0.10 2.00% 1.00% $0.00 7 7 7 7 8 8 8 8 9 9 9 9 0 0 0 0 1 20 30 40 10 20 30 40 11 21 31 41 21 10 40 20 30 10 Q Q Q Q Q Q Q Q Q Q Q Q Q Q Q Q Q Vacacny Rate Lease Rate Light Indu, $0.55 Outlook put downward pressure to keep lease rates low. We anticipate the industrial vacancy to either remain flat or gradually drop over the Market indicators are on the uptick and signs of recovery are next few years as the local and national economies show further visible. We are optimistic that the bottom is near and compared to signs of improvement. last year, vacancy is not rising and lease rates are not falling as fast or as far as we were witnessing. Growth in sales will continue to Classifications Industrial Buildings can be classified as follows: • Distribution Building: Over 15,000sf divisibility, 3-5 percent • Incubator: 500-3,500 sf divisibility, minimal office, one roll- office build-out, docks-hi and grade level loading, minimum up door 24’ clear height • Midbay: 5,000-15,000 sf divisibility, 10-15 percent office • Flex Building: Up to 100 percent office build out, grade level build-out, dock high and grade level loading loading, minimum 3.5/1,000 parking • Light Industrial: Mminimum 3,500 – 4,999 sf divisibility, grade level loading Cushman & Wakefield Commerce Real Estate Solutions of Clark County 3800 Howard Hughes Parkway, Suite 1200, Las Vegas, 89169 (702) 796-7900 www.comre.com ©2011, Commerce Real Estate Solutions. Disclaimer: The above information is given with the obligation that all negotiations relating to the purchase, renting, or leasing of the property described above shall be conducted through Commerce Real Estate Solutions. No warranty or representation, express or implied, is made as to the accuracy of the information contained herein, and same is submitted subject to errors, omissions, change of price, rental or other encumbrances, withdrawal without notice, and to any special listing conditions imposed by the seller. Prospective buyers should conduct their own due diligence.