

Recomendados
Mais conteúdo relacionado
Mais procurados
Mais procurados (20)
Destaque
Semelhante a Graphmagic pdf
Semelhante a Graphmagic pdf (20)
Último
Último (20)
Graphmagic pdf
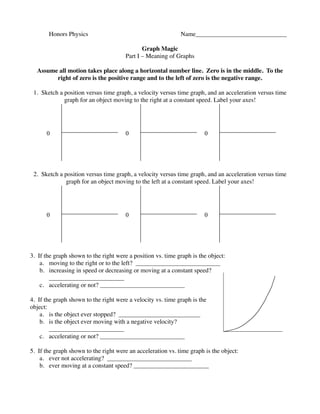
- 1. Honors Physics Name_____________________________ Graph Magic Part I – Meaning of Graphs Assume all motion takes place along a horizontal number line. Zero is in the middle. To the right of zero is the positive range and to the left of zero is the negative range. 1. Sketch a position versus time graph, a velocity versus time graph, and an acceleration versus time graph for an object moving to the right at a constant speed. Label your axes! 0 0 0 2. Sketch a position versus time graph, a velocity versus time graph, and an acceleration versus time graph for an object moving to the left at a constant speed. Label your axes! 0 0 0 3. If the graph shown to the right were a position vs. time graph is the object: a. moving to the right or to the left? ___________________________ b. increasing in speed or decreasing or moving at a constant speed? ________________________ c. accelerating or not? ___________________________ 4. If the graph shown to the right were a velocity vs. time graph is the object: a. is the object ever stopped? __________________________ b. is the object ever moving with a negative velocity? ________________________ c. accelerating or not? ___________________________ 5. If the graph shown to the right were an acceleration vs. time graph is the object: a. ever not accelerating? ___________________________ b. ever moving at a constant speed? ________________________
- 2. Part 2 – Distance to Velocity to Acceleration – Straight Lines Use the graph of position versus time shown below to complete the other two graphs for the same motion. Think carefully about this. Distance vs. Time + - Velocity vs. Time + - Acceleration vs. Time + -
- 3. Part 3 – Distance to Velocity to Acceleration – Curved Lines Distance vs. Time + - Velocity vs. Time + - Acceleration vs. Time + -
- 4. Distance vs. Time + - Velocity vs. Time + - Acceleration vs. Time + -
- 5. For the following graph, each box is worth one unit on the x and y axes respectively. The lower left hand corner is the origin. Part 4 – Obtaining Information from Graphs Use the grid below to sketch Bob Smith’s motion. Bob Smith walks for three seconds at a pace of 10 m/s. During the next three seconds he slows down at a constant rate. By six seconds, he is at rest. speed (m/s) time (s) Use your sketch above to calculate Bob’s acceleration from: a) 0 to 3 seconds b) 3 to 6 seconds Use your sketch above to calculate the area under the graphed line from: a) 0 to 3 seconds b) 3 to 6 seconds How far would the man have walked from 0 to 6 seconds? By analyzing the units, we already know that the: Slope of a distance vs. time graph tells us ________________________________________________ Slope of a velocity vs. time graph tells us _________________________________________________ By analyzing the units, we also now know that the: Area under a velocity vs. time graph tells us ______________________________________________
- 6. For the following graphs, each box is worth one unit on the x and y axes respectively. The lower left hand corner is the origin. Velocity (m/s) Calculate the area under the line from t = 10 to t = 20 secs. Leave your answer in the correct units! What does this value represent? Time (sec) Distance (m) Calculate the velocity at t = 8 secs. You will need to sketch a tangent line at this point. Is this object speeding up or slowing down (forward is the positive direction)? Time (sec) Acceleration (m/s/s) Calculate the change of velocity between t = 2 & 15 secs. Time (sec) Overall Rules about Slope and Area On a graph of Position vs. time Slope tells us ____________________ Area tells us ____________________ On a graph of Velocity vs. time Slope tells us ____________________ Area tells us ____________________ On a graph of Acceleration vs. time Slope tells us ____________________ Area tells us ____________________