This document describes the process and principles of acid-base titration. It discusses:
1. The equipment used including burettes, conical flasks, and indicators.
2. The method of slowly adding an alkali to an acid while swirling and monitoring the indicator until the endpoint is reached.
3. Calculations that can be done such as determining moles, concentration, and mass based on the titration results.
4. How a titration curve shows pH changing as a function of alkali added, with the endpoint at neutralization.
1. C5d Titrations (Foundation + Higher)
This type of reaction is called a “___________________ reaction”.
acid + alkali salt + water
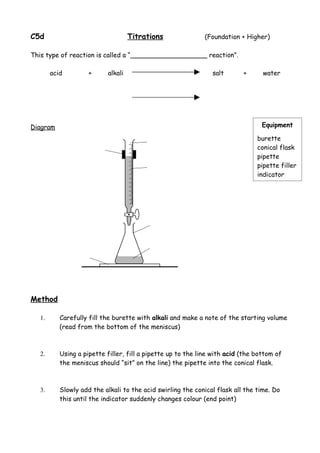
Diagram Equipment
burette
conical flask
pipette
pipette filler
indicator
Method
1. Carefully fill the burette with alkali and make a note of the starting volume
(read from the bottom of the meniscus)
2. Using a pipette filler, fill a pipette up to the line with acid (the bottom of
the meniscus should “sit” on the line) the pipette into the conical flask.
3. Slowly add the alkali to the acid swirling the conical flask all the time. Do
this until the indicator suddenly changes colour (end point)
2. Results
Titration volume before volume after titre (volume of alkali added) Average Titre
cm3 cm3 cm3 cm3
1 0.0 24.9
2 24.9 49.7
3 0.2 25.1
1. Work out the titres (volume of alkali used to neutralise the acid each time).
2. Work out the average titre used and explain why we use an average
3. Why do we need three titre readings that are within ± 0.02cm3?
HIGHER LEVEL
4. Using the average titre, calculate how many moles of alkali were added to the acid.
Concentration of the alkali is 1.0 mol/dm3.
5. One mole of acid reacts with one mole of alkali so how many moles of acid must
have been in the conical flask.
6. Now calculate the concentration of the original 25cm3 of acid
7. What mass of sodium hydroxide (NaOH) was dissolved in your average titre
moles = concentration × volume in dm3
concentration = moles ÷ volume in dm3
volume in dm3 = moles ÷ concentration
moles = mass ÷ molecular mass
3. Titration curves - if you measure the pH continually as you titrate you get a curve:
HIGHER - You must be able to sketch a pH titration curve for the titration of an acid or an alkali
1. On your graph label the end-point of the reaction i.e when the solution
neutralises.
2. Describe the shape of your graph in terms of the volume of the alkali added
and the pH
3. As more alkali is added the pH of the solution____________________
4. From your graph, what is the pH at:
a) 10cm3 acid added
b) 20cm3 acid added
c) 40cm3 acid added
4. 5. What volume of alkali was added to make the solution neutral?
Indicators
Mixed Indicators e.g. universal indicator
We use Universal indicator to estimate the pH of a solution. It is made from a
mixture of different indicators so it produces a continuous colour change as the pH
changes.
1. If we had used universal indicator, what colour would it turn for:
a) pH 1
b) pH 5
c) pH 7
d) pH 9
e) pH 14
Single Indicators (used in titrations)
In an acid-base titration you need a sudden colour change at the end-point i.e. when
the solution neutralises.
Indicator Colour in Acid Colour in Alkali
Litmus
Methyl Orange
Phenolphthalein
You need to learn
these colours for
the higher tier
5. 2. Explain why we need to use single indicators in titrations and not a mixed
indicator like universal indicator.