Fredericksburg, Virginia Real Estate Market Statistics June 2013
•
0 gostou•906 visualizações

State of the real estate market and year to date real estate statistics in Fredericksburg, Virginia. Matthew Rathbun www.EliteScoop.com

Recomendados
Mais conteúdo relacionado
Destaque
Destaque (15)
Mais de Matthew Rathbun
Mais de Matthew Rathbun (20)
Último
Último (20)
Fredericksburg, Virginia Real Estate Market Statistics June 2013
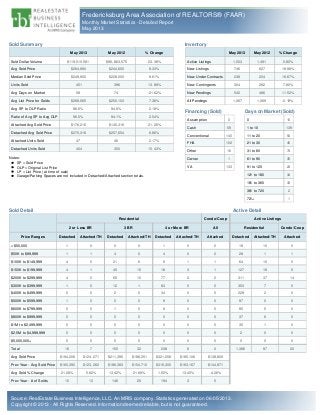
- 1. Fredericksburg Area Association of REALTORS® (FAAR) Monthly Market Statistics - Detailed Report May 2013 Sold Summary May 2013 May 2012 % Change Sold Dollar Volume $119,510,581 $96,863,575 23.38% Avg Sold Price $264,990 $244,605 8.33% Median Sold Price $249,900 $228,000 9.61% Units Sold 451 396 13.89% Avg Days on Market 58 74 -21.62% Avg List Price for Solds $268,565 $250,103 7.38% Avg SP to OLP Ratio 96.6% 94.6% 2.18% Ratio of Avg SP to Avg OLP 96.5% 94.1% 2.54% Attached Avg Sold Price $176,216 $145,316 21.26% Detached Avg Sold Price $275,318 $257,654 6.86% Attached Units Sold 47 46 2.17% Detached Units Sold 404 350 15.43% Inventory May 2013 May 2012 % Change Active Listings 1,503 1,491 0.80% New Listings 746 627 18.98% New Under Contracts 238 204 16.67% New Contingents 304 282 7.80% New Pendings 542 486 11.52% All Pendings 1,067 1,069 -0.19% Notes: SP = Sold Price OLP = Original List Price LP = List Price (at time of sale) Garage/Parking Spaces are not included in Detached/Attached section totals. Financing (Sold) Assumption 0 Cash 59 Conventional 140 FHA 102 Other 16 Owner 1 VA 133 Days on Market (Sold) 0 10 1 to 10 139 11 to 20 54 21 to 30 45 31 to 60 74 61 to 90 35 91 to 120 24 121 to 180 34 181 to 360 33 361 to 720 2 721+ 1 Active DetailSold Detail Residential Condo/Coop Active Listings 2 or Less BR 3 BR 4 or More BR All Residential Condo/Coop Price Ranges Detached Attached/TH Detached Attached/TH Detached Attached/TH Attached Detached Attached/TH Attached < $50,000 1 0 0 0 1 0 0 18 10 0 $50K to $99,999 1 1 4 0 4 0 0 28 1 1 $100K to $149,999 4 5 21 6 6 1 1 64 10 0 $150K to $199,999 4 1 45 15 18 3 1 127 18 5 $200K to $299,999 4 0 65 10 77 2 0 311 37 14 $300K to $399,999 1 0 12 1 83 0 0 353 7 0 $400K to $499,999 0 0 2 0 34 0 0 229 2 0 $500K to $599,999 1 0 0 0 9 0 0 97 0 0 $600K to $799,999 0 0 1 0 6 0 0 85 5 0 $800K to $999,999 0 0 0 0 0 0 0 37 6 0 $1M to $2,499,999 0 0 0 0 0 0 0 35 1 0 $2.5M to $4,999,999 0 0 0 0 0 0 0 2 0 0 $5,000,000+ 0 0 0 0 0 0 0 0 0 0 Total 16 7 150 32 238 6 2 1,386 97 20 Avg Sold Price $194,206 $124,271 $211,395 $188,251 $321,058 $185,106 $138,800 Prev Year - Avg Sold Price $160,390 $123,262 $186,383 $154,712 $316,305 $163,167 $144,971 Avg Sold % Change 21.08% 0.82% 13.42% 21.68% 1.50% 13.45% -4.26% Prev Year - # of Solds 10 13 146 25 194 3 5 Source: RealEstate Business Intelligence, LLC. An MRIS company. Statistics generated on 06/05/2013. Copyright © 2013 - All Rights Reserved. Information deemed reliable, but is not guaranteed.