SlideShare uma empresa Scribd logo
1 de 60
Kinds  of  Statistics Purpose Target Characteristics Descriptive Statistics Summarizing, Describing Sample Statistic Inferential  Statistics Analyzing,  Generalization Population Parameter
 
 
Tabulation of Data Ungrouped  Data  Grouped  Data  15 9 16 13 11 10 8 12 16 15 13 12 11 10 9 8
Frequency Distribution ,[object Object],[object Object]
[object Object],Score(X)  Frequency(f)  16 15 13 12 11 10 9 8 1 1 2 5 4 4 1 2
Frequency distribution Score  (X)  Absolute Frequency Relative  Frequency 16 15 13 12 11 10 9 8 1 1 2 5 4 4 1 2 0.05 0.05 0.10 0.25 0.20 0.20 0.05 0.10 Σ x = 94 N= 20 1.00
Frequency distribution Score  (X)  Absolute Frequency Relative  Frequency Percentage 16 15 13 12 11 10 9 8 1 1 2 5 4 4 1 2 0.05 0.05 0.10 0.25 0.20 0.20 0.05 0.10 0.05x100=5 0.05x100=5 0.10x100=10 0.25x100=25 0.20x100=20 0.20x100=20 0.05x100=5 0.10x100=10 Σ x = 94 N= 20 1.00 100
Cumulative  Frequency ,[object Object],[object Object],[object Object]
[object Object],X f cf 16 15 13 12 11 10 9 8  1 1 2 5 4 4 1 2  20 19 18 16 11 7 3 2
[object Object],[object Object],[object Object],[object Object],[object Object],[object Object],[object Object],[object Object],[object Object],[object Object],[object Object],[object Object],[object Object],[object Object],[object Object]
[object Object]
 
[object Object]
Measures of Central Tendency ,[object Object],[object Object],[object Object]
[object Object],[object Object],[object Object],[object Object],[object Object],[object Object],[object Object],[object Object],[object Object],[object Object],[object Object]
[object Object],1. Odd number 13, 15,  16 , 17, 19   2. Even number 12, 13,  15, 17 , 18, 19  =  16 ,[object Object],X f  16 15 13 12 11 10 9 8 1 1 2 5 4 4 1 2
Measures of Variability ,[object Object],[object Object],[object Object],[object Object],[object Object],[object Object]
[object Object],[object Object],[object Object],[object Object],[object Object],[object Object],[object Object],[object Object]
Example   Σ x 2  28     (V (  = ---------= --------=4.6   N-1  7-1   S = 2.14 X  (X -  )   Σ (X -  ) 2 19 18 17 16 15 14 13  + 3 +2 +1 0 -1 -2 -3  9 4 1 0 1 4 9  112 0 28
[object Object]
[object Object],[object Object],[object Object],[object Object],[object Object],[object Object]
Normal Probability Curve ,[object Object],[object Object],[object Object],[object Object]
[object Object]
Symmetrical vs. asymmetrical d distribution ,[object Object],[object Object],[object Object],[object Object]
[object Object],[object Object],[object Object]
 
Kurtosis Distribution ,[object Object],[object Object],[object Object]
[object Object],[object Object],[object Object],[object Object],[object Object],[object Object],[object Object]
[object Object],[object Object],[object Object],[object Object],[object Object],[object Object]
[object Object],[object Object],[object Object],[object Object],[object Object],[object Object],[object Object]
[object Object],[object Object],[object Object],[object Object],[object Object]
 
[object Object],[object Object],[object Object],[object Object],[object Object],[object Object],[object Object],[object Object],[object Object],[object Object],[object Object],[object Object],Student X SD Ali 25 5 20 Ahmad 30 5 35
[object Object],[object Object],[object Object],[object Object],[object Object],[object Object],[object Object],[object Object],[object Object],Student X SD Ali 76 20 54 Ahmad 82 15 72
 
 
[object Object],[object Object],[object Object],[object Object],[object Object],[object Object],[object Object],[object Object],Skewed Distribution
The Coefficient of Correlation,  r ,[object Object],[object Object],[object Object],[object Object],[object Object]
Perfect Correlation
Correlation Coefficient - Interpretation
[object Object],[object Object],[object Object],[object Object],[object Object],[object Object],[object Object]
Correlation Coefficient - Formula
[object Object],[object Object],Students Teacher 1 Teacher 2 D D 2 A B C D E  1 2 3 4 5  5 4 3 2 1  4 2 0 2 4  16 4 0 4 16  5 15 15 12 40
[object Object],[object Object],[object Object],[object Object]
[object Object],[object Object],[object Object],[object Object],[object Object]
[object Object],[object Object],[object Object],[object Object],[object Object],[object Object],[object Object]
[object Object],rpbi  = point-biserial correlation coefficient Mp  = whole-test mean for students answering item correctly (i.e., those coded as 1s) Mq  = whole-test mean for students answering item incorrectly (i.e., those coded as 0s) St  = standard deviation for whole test p  = proportion of students answering correctly (i.e., those coded as 1s) q  = proportion of students answering incorrectly (i.e., those coded as 0s)
As another example, where  the whole-test mean for Ss answering correctly is 30;  the whole-test mean for Ss answering incorrectly is 45; the standard deviation for the whole test is still 8.29;  the proportion of Ss answering correctly is still .50;  and the proportion answering incorrectly is still .50 .
Types of Correlation coefficients Type of Correlation Coefficient Types of Scales Pearson product-moment Both scales interval (or ratio) Spearman rank-order Both scales ordinal Phi Both scales are naturally dichotomous (nominal) Biserial One scale artificially dichotomous (nominal), one scale interval (or ratio) Point-biserial One scale naturally dichotomous (nominal), one scale interval (or ratio) Gamma One scale nominal, one scale ordinal
[object Object],[object Object],[object Object],[object Object],[object Object]
[object Object],[object Object],[object Object],[object Object],[object Object],[object Object],[object Object]
[object Object],[object Object],[object Object],[object Object],[object Object],[object Object],[object Object],[object Object]
[object Object],[object Object],[object Object],[object Object],[object Object],[object Object],[object Object]
[object Object],[object Object],[object Object]
Fry’s Readability Graph ,[object Object],[object Object],[object Object],[object Object],[object Object]
Additional Directions ,[object Object],[object Object],[object Object],[object Object],[object Object]


Mais conteúdo relacionado

Mais procurados

Item Analysis - Discrimination and Difficulty Index
Item Analysis - Discrimination and Difficulty IndexItem Analysis - Discrimination and Difficulty Index
Item Analysis - Discrimination and Difficulty IndexMr. Ronald Quileste, PhD
 
Samples of supporting student activities
Samples of supporting student activitiesSamples of supporting student activities
Samples of supporting student activitiesjdveyra
 
Differences between assessment and evaluation
Differences between assessment and evaluationDifferences between assessment and evaluation
Differences between assessment and evaluationS. Raj Kumar
 
Roles of Assessment in Classroom Instruction
Roles of Assessment in Classroom InstructionRoles of Assessment in Classroom Instruction
Roles of Assessment in Classroom InstructionJames Robert Villacorteza
 
Methods of interpreting test scores by Dr.Shazia Zamir
Methods of interpreting test scores by Dr.Shazia Zamir Methods of interpreting test scores by Dr.Shazia Zamir
Methods of interpreting test scores by Dr.Shazia Zamir Dr.Shazia Zamir
 
Aims, goals and objective purpose in curriculum development
Aims, goals and objective purpose in curriculum developmentAims, goals and objective purpose in curriculum development
Aims, goals and objective purpose in curriculum developmentInternational advisers
 
Assessment in Education
Assessment in EducationAssessment in Education
Assessment in EducationVandana Thakur
 
Selection types of objective test
Selection types of objective testSelection types of objective test
Selection types of objective testenylisac25
 
Meaning of Test, Testing and Evaluation
Meaning of Test, Testing and EvaluationMeaning of Test, Testing and Evaluation
Meaning of Test, Testing and EvaluationDr. Amjad Ali Arain
 
Testing, assessment, measurement and evaluation definition
Testing, assessment, measurement and evaluation definitionTesting, assessment, measurement and evaluation definition
Testing, assessment, measurement and evaluation definitionnorazmi danuri
 
Norm referenced and Criterion Referenced Test
Norm referenced and Criterion Referenced TestNorm referenced and Criterion Referenced Test
Norm referenced and Criterion Referenced TestDrSindhuAlmas
 
Differences between measurement, evaluation and assessment
Differences between measurement, evaluation and assessmentDifferences between measurement, evaluation and assessment
Differences between measurement, evaluation and assessmentSWATHY M.A
 
Grading system (education)
Grading system (education)Grading system (education)
Grading system (education)Redbutts Ash
 
Characteristics of a good test
Characteristics of a good testCharacteristics of a good test
Characteristics of a good testBoyet Aluan
 

Mais procurados (20)

Definition of Assessment,
Definition of Assessment,Definition of Assessment,
Definition of Assessment,
 
Item Analysis - Discrimination and Difficulty Index
Item Analysis - Discrimination and Difficulty IndexItem Analysis - Discrimination and Difficulty Index
Item Analysis - Discrimination and Difficulty Index
 
Samples of supporting student activities
Samples of supporting student activitiesSamples of supporting student activities
Samples of supporting student activities
 
Nature of Assessment
Nature of AssessmentNature of Assessment
Nature of Assessment
 
Principles of assessment
Principles of assessmentPrinciples of assessment
Principles of assessment
 
Differences between assessment and evaluation
Differences between assessment and evaluationDifferences between assessment and evaluation
Differences between assessment and evaluation
 
Roles of Assessment in Classroom Instruction
Roles of Assessment in Classroom InstructionRoles of Assessment in Classroom Instruction
Roles of Assessment in Classroom Instruction
 
Performance based Assessment
Performance based AssessmentPerformance based Assessment
Performance based Assessment
 
Affective Assessment
Affective AssessmentAffective Assessment
Affective Assessment
 
Methods of interpreting test scores by Dr.Shazia Zamir
Methods of interpreting test scores by Dr.Shazia Zamir Methods of interpreting test scores by Dr.Shazia Zamir
Methods of interpreting test scores by Dr.Shazia Zamir
 
Aims, goals and objective purpose in curriculum development
Aims, goals and objective purpose in curriculum developmentAims, goals and objective purpose in curriculum development
Aims, goals and objective purpose in curriculum development
 
Assessment in Education
Assessment in EducationAssessment in Education
Assessment in Education
 
Selection types of objective test
Selection types of objective testSelection types of objective test
Selection types of objective test
 
Meaning of Test, Testing and Evaluation
Meaning of Test, Testing and EvaluationMeaning of Test, Testing and Evaluation
Meaning of Test, Testing and Evaluation
 
Testing, assessment, measurement and evaluation definition
Testing, assessment, measurement and evaluation definitionTesting, assessment, measurement and evaluation definition
Testing, assessment, measurement and evaluation definition
 
Curriculum change
Curriculum changeCurriculum change
Curriculum change
 
Norm referenced and Criterion Referenced Test
Norm referenced and Criterion Referenced TestNorm referenced and Criterion Referenced Test
Norm referenced and Criterion Referenced Test
 
Differences between measurement, evaluation and assessment
Differences between measurement, evaluation and assessmentDifferences between measurement, evaluation and assessment
Differences between measurement, evaluation and assessment
 
Grading system (education)
Grading system (education)Grading system (education)
Grading system (education)
 
Characteristics of a good test
Characteristics of a good testCharacteristics of a good test
Characteristics of a good test
 

Destaque

Administering,scoring and reporting a test ppt
Administering,scoring and reporting a test pptAdministering,scoring and reporting a test ppt
Administering,scoring and reporting a test pptManali Solanki
 
Interpretation of Assessment Results
Interpretation of Assessment ResultsInterpretation of Assessment Results
Interpretation of Assessment ResultsRica Joy Pontilar
 
Describing and Interpreting Test Scores: Frequency Distribution to Measures o...
Describing and Interpreting Test Scores: Frequency Distribution to Measures o...Describing and Interpreting Test Scores: Frequency Distribution to Measures o...
Describing and Interpreting Test Scores: Frequency Distribution to Measures o...Mr. Ronald Quileste, PhD
 
Interpretation of scores and the grading system in public schools
Interpretation of scores and the grading system in public schoolsInterpretation of scores and the grading system in public schools
Interpretation of scores and the grading system in public schoolsAirah Torres
 
Grading students’ test score
Grading students’ test scoreGrading students’ test score
Grading students’ test scoreenylisac25
 
administrating test,scoring, grading vs marks
administrating test,scoring, grading vs marksadministrating test,scoring, grading vs marks
administrating test,scoring, grading vs markskrishu29
 
Administering the test
Administering the testAdministering the test
Administering the testenylisac25
 
Administering & scoring tabe 9 10
Administering & scoring tabe 9 10Administering & scoring tabe 9 10
Administering & scoring tabe 9 10SABES
 
Interpreting Performance Test Results
Interpreting Performance Test ResultsInterpreting Performance Test Results
Interpreting Performance Test ResultsEric Proegler
 
administrating test,scoring,grading vs marks
administrating test,scoring,grading vs marksadministrating test,scoring,grading vs marks
administrating test,scoring,grading vs markskrishu29
 
Guidelines for Test Administration
Guidelines for Test AdministrationGuidelines for Test Administration
Guidelines for Test AdministrationSue Quirante
 
Understanding CASAS/ABE Test Results
Understanding CASAS/ABE Test ResultsUnderstanding CASAS/ABE Test Results
Understanding CASAS/ABE Test Resultsjwillia8
 
Full placement-test
Full placement-test Full placement-test
Full placement-test Paula Pires
 
Performance testing and reporting with JMeter
Performance testing and reporting with JMeterPerformance testing and reporting with JMeter
Performance testing and reporting with JMeterjvSlideshare
 
How to Analyze Reports in Jmeter
How to Analyze Reports in JmeterHow to Analyze Reports in Jmeter
How to Analyze Reports in JmeterViviana Lesmes
 
Using assessment data
Using assessment dataUsing assessment data
Using assessment datafcaristo
 
Jmeter Performance Testing
Jmeter Performance TestingJmeter Performance Testing
Jmeter Performance TestingAtul Pant
 

Destaque (20)

Interpreting Test Scores
Interpreting Test ScoresInterpreting Test Scores
Interpreting Test Scores
 
Administering,scoring and reporting a test ppt
Administering,scoring and reporting a test pptAdministering,scoring and reporting a test ppt
Administering,scoring and reporting a test ppt
 
Interpretation of Assessment Results
Interpretation of Assessment ResultsInterpretation of Assessment Results
Interpretation of Assessment Results
 
Describing and Interpreting Test Scores: Frequency Distribution to Measures o...
Describing and Interpreting Test Scores: Frequency Distribution to Measures o...Describing and Interpreting Test Scores: Frequency Distribution to Measures o...
Describing and Interpreting Test Scores: Frequency Distribution to Measures o...
 
Interpretation of scores and the grading system in public schools
Interpretation of scores and the grading system in public schoolsInterpretation of scores and the grading system in public schools
Interpretation of scores and the grading system in public schools
 
Grading students’ test score
Grading students’ test scoreGrading students’ test score
Grading students’ test score
 
administrating test,scoring, grading vs marks
administrating test,scoring, grading vs marksadministrating test,scoring, grading vs marks
administrating test,scoring, grading vs marks
 
Administering the test
Administering the testAdministering the test
Administering the test
 
Administering & scoring tabe 9 10
Administering & scoring tabe 9 10Administering & scoring tabe 9 10
Administering & scoring tabe 9 10
 
Interpreting Performance Test Results
Interpreting Performance Test ResultsInterpreting Performance Test Results
Interpreting Performance Test Results
 
administrating test,scoring,grading vs marks
administrating test,scoring,grading vs marksadministrating test,scoring,grading vs marks
administrating test,scoring,grading vs marks
 
Guidelines for Test Administration
Guidelines for Test AdministrationGuidelines for Test Administration
Guidelines for Test Administration
 
Understanding CASAS/ABE Test Results
Understanding CASAS/ABE Test ResultsUnderstanding CASAS/ABE Test Results
Understanding CASAS/ABE Test Results
 
Full placement-test
Full placement-test Full placement-test
Full placement-test
 
Performance testing and reporting with JMeter
Performance testing and reporting with JMeterPerformance testing and reporting with JMeter
Performance testing and reporting with JMeter
 
Item analysis
Item analysis Item analysis
Item analysis
 
Test scores
Test scoresTest scores
Test scores
 
How to Analyze Reports in Jmeter
How to Analyze Reports in JmeterHow to Analyze Reports in Jmeter
How to Analyze Reports in Jmeter
 
Using assessment data
Using assessment dataUsing assessment data
Using assessment data
 
Jmeter Performance Testing
Jmeter Performance TestingJmeter Performance Testing
Jmeter Performance Testing
 

Semelhante a Statistics for interpreting test scores

The standard normal curve & its application in biomedical sciences
The standard normal curve & its application in biomedical sciencesThe standard normal curve & its application in biomedical sciences
The standard normal curve & its application in biomedical sciencesAbhi Manu
 
Introduction to statistical concepts
Introduction to statistical conceptsIntroduction to statistical concepts
Introduction to statistical conceptsAya Christeen
 
zScores_HANDOUT.pdf
zScores_HANDOUT.pdfzScores_HANDOUT.pdf
zScores_HANDOUT.pdfJoebest8
 
Numerical measures stat ppt @ bec doms
Numerical measures stat ppt @ bec domsNumerical measures stat ppt @ bec doms
Numerical measures stat ppt @ bec domsBabasab Patil
 
Measures of variability to grading and reporting
Measures of variability to grading and reportingMeasures of variability to grading and reporting
Measures of variability to grading and reportingApril Gealene Alera
 
Statistics in Research
Statistics in ResearchStatistics in Research
Statistics in Researchguest5477b8
 
Statistics in Research
Statistics in ResearchStatistics in Research
Statistics in ResearchKent Kawashima
 
Jujie and saima introduction of statistical concept
Jujie and saima introduction of statistical conceptJujie and saima introduction of statistical concept
Jujie and saima introduction of statistical conceptJUJIE ATILANO
 
Descriptive statistics
Descriptive statisticsDescriptive statistics
Descriptive statisticsBurak Mızrak
 
Variability, the normal distribution and converted scores
Variability, the normal distribution and converted scoresVariability, the normal distribution and converted scores
Variability, the normal distribution and converted scoresNema Grace Medillo
 
Research Terminology for EDEL 600
Research Terminology for EDEL 600Research Terminology for EDEL 600
Research Terminology for EDEL 600Melinda Schoenfeldt
 
Measures of Dispersion: Standard Deviation and Co- efficient of Variation
Measures of Dispersion: Standard Deviation and Co- efficient of Variation Measures of Dispersion: Standard Deviation and Co- efficient of Variation
Measures of Dispersion: Standard Deviation and Co- efficient of Variation RekhaChoudhary24
 
02 PSBE3_PPT.Ch01_2_Examining Distribution.ppt
02 PSBE3_PPT.Ch01_2_Examining Distribution.ppt02 PSBE3_PPT.Ch01_2_Examining Distribution.ppt
02 PSBE3_PPT.Ch01_2_Examining Distribution.pptBishoyRomani
 
Group 3 measures of central tendency and variation - (mean, median, mode, ra...
Group 3  measures of central tendency and variation - (mean, median, mode, ra...Group 3  measures of central tendency and variation - (mean, median, mode, ra...
Group 3 measures of central tendency and variation - (mean, median, mode, ra...reymartyvette_0611
 
analytical representation of data
 analytical representation of data analytical representation of data
analytical representation of dataUnsa Shakir
 

Semelhante a Statistics for interpreting test scores (20)

Practice test1 solution
Practice test1 solutionPractice test1 solution
Practice test1 solution
 
The standard normal curve & its application in biomedical sciences
The standard normal curve & its application in biomedical sciencesThe standard normal curve & its application in biomedical sciences
The standard normal curve & its application in biomedical sciences
 
Introduction to statistical concepts
Introduction to statistical conceptsIntroduction to statistical concepts
Introduction to statistical concepts
 
STATISTICS AND PROBABILITY.pptx
STATISTICS AND PROBABILITY.pptxSTATISTICS AND PROBABILITY.pptx
STATISTICS AND PROBABILITY.pptx
 
zScores_HANDOUT.pdf
zScores_HANDOUT.pdfzScores_HANDOUT.pdf
zScores_HANDOUT.pdf
 
Numerical measures stat ppt @ bec doms
Numerical measures stat ppt @ bec domsNumerical measures stat ppt @ bec doms
Numerical measures stat ppt @ bec doms
 
Measures of variability to grading and reporting
Measures of variability to grading and reportingMeasures of variability to grading and reporting
Measures of variability to grading and reporting
 
Statistics in Research
Statistics in ResearchStatistics in Research
Statistics in Research
 
Statistics in Research
Statistics in ResearchStatistics in Research
Statistics in Research
 
Jujie and saima introduction of statistical concept
Jujie and saima introduction of statistical conceptJujie and saima introduction of statistical concept
Jujie and saima introduction of statistical concept
 
Descriptive statistics
Descriptive statisticsDescriptive statistics
Descriptive statistics
 
Variability, the normal distribution and converted scores
Variability, the normal distribution and converted scoresVariability, the normal distribution and converted scores
Variability, the normal distribution and converted scores
 
Research Terminology for EDEL 600
Research Terminology for EDEL 600Research Terminology for EDEL 600
Research Terminology for EDEL 600
 
Lecture 10.4 bt
Lecture 10.4 btLecture 10.4 bt
Lecture 10.4 bt
 
Measures of Dispersion: Standard Deviation and Co- efficient of Variation
Measures of Dispersion: Standard Deviation and Co- efficient of Variation Measures of Dispersion: Standard Deviation and Co- efficient of Variation
Measures of Dispersion: Standard Deviation and Co- efficient of Variation
 
Assessment compiled
Assessment compiledAssessment compiled
Assessment compiled
 
02 PSBE3_PPT.Ch01_2_Examining Distribution.ppt
02 PSBE3_PPT.Ch01_2_Examining Distribution.ppt02 PSBE3_PPT.Ch01_2_Examining Distribution.ppt
02 PSBE3_PPT.Ch01_2_Examining Distribution.ppt
 
Chapters 2 4
Chapters 2  4Chapters 2  4
Chapters 2 4
 
Group 3 measures of central tendency and variation - (mean, median, mode, ra...
Group 3  measures of central tendency and variation - (mean, median, mode, ra...Group 3  measures of central tendency and variation - (mean, median, mode, ra...
Group 3 measures of central tendency and variation - (mean, median, mode, ra...
 
analytical representation of data
 analytical representation of data analytical representation of data
analytical representation of data
 

Statistics for interpreting test scores

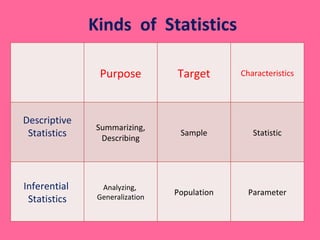
  • 1. Kinds of Statistics Purpose Target Characteristics Descriptive Statistics Summarizing, Describing Sample Statistic Inferential Statistics Analyzing, Generalization Population Parameter
  • 2.  
  • 3.  
  • 4. Tabulation of Data Ungrouped Data Grouped Data 15 9 16 13 11 10 8 12 16 15 13 12 11 10 9 8
  • 5.
  • 6.
  • 7. Frequency distribution Score (X) Absolute Frequency Relative Frequency 16 15 13 12 11 10 9 8 1 1 2 5 4 4 1 2 0.05 0.05 0.10 0.25 0.20 0.20 0.05 0.10 Σ x = 94 N= 20 1.00
  • 8. Frequency distribution Score (X) Absolute Frequency Relative Frequency Percentage 16 15 13 12 11 10 9 8 1 1 2 5 4 4 1 2 0.05 0.05 0.10 0.25 0.20 0.20 0.05 0.10 0.05x100=5 0.05x100=5 0.10x100=10 0.25x100=25 0.20x100=20 0.20x100=20 0.05x100=5 0.10x100=10 Σ x = 94 N= 20 1.00 100
  • 9.
  • 10.
  • 11.
  • 12.
  • 13.  
  • 14.
  • 15.
  • 16.
  • 17.
  • 18.
  • 19.
  • 20. Example Σ x 2 28 (V ( = ---------= --------=4.6 N-1 7-1  S = 2.14 X (X - ) Σ (X - ) 2 19 18 17 16 15 14 13 + 3 +2 +1 0 -1 -2 -3 9 4 1 0 1 4 9 112 0 28
  • 21.
  • 22.
  • 23.
  • 24.
  • 25.
  • 26.
  • 27.  
  • 28.
  • 29.
  • 30.
  • 31.
  • 32.
  • 33.  
  • 34.
  • 35.
  • 36.  
  • 37.  
  • 38.
  • 39.
  • 41. Correlation Coefficient - Interpretation
  • 42.
  • 44.
  • 45.
  • 46.
  • 47.
  • 48.
  • 49. As another example, where the whole-test mean for Ss answering correctly is 30; the whole-test mean for Ss answering incorrectly is 45; the standard deviation for the whole test is still 8.29; the proportion of Ss answering correctly is still .50; and the proportion answering incorrectly is still .50 .
  • 50. Types of Correlation coefficients Type of Correlation Coefficient Types of Scales Pearson product-moment Both scales interval (or ratio) Spearman rank-order Both scales ordinal Phi Both scales are naturally dichotomous (nominal) Biserial One scale artificially dichotomous (nominal), one scale interval (or ratio) Point-biserial One scale naturally dichotomous (nominal), one scale interval (or ratio) Gamma One scale nominal, one scale ordinal
  • 51.
  • 52.
  • 53.
  • 54.
  • 55.
  • 56.
  • 57.
  • 58.  
  • 59.  
  • 60.