A Beginners Guide to Building a RAG App Using Open Source Milvus
Decision maths 1 graphs and networks
1. Decision Maths 1
Graphs and Networks
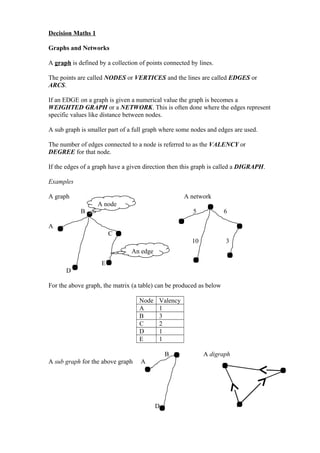
A graph is defined by a collection of points connected by lines.
The points are called NODES or VERTICES and the lines are called EDGES or
ARCS.
If an EDGE on a graph is given a numerical value the graph is becomes a
WEIGHTED GRAPH or a NETWORK. This is often done where the edges represent
specific values like distance between nodes.
A sub graph is smaller part of a full graph where some nodes and edges are used.
The number of edges connected to a node is referred to as the VALENCY or
DEGREE for that node.
If the edges of a graph have a given direction then this graph is called a DIGRAPH.
Examples
A graph A network
B 5 6
A
C
10 3
E
D
For the above graph, the matrix (a table) can be produced as below
Node Valency
A 1
B 3
C 2
D 1
E 1
B A digraph
A sub graph for the above graph A
D
A node
An edge
2. More definitions :
A graph is connected if all its vertices are
connected.
Graph 1
A Tree – A connected graph with no
cycles, the graph on the right is also a
tree.
A Path – A route through a graph where
the end of one edge is the beginning of
another, and no vertex is used more than
once. For example, for the graph 2, a
possible path could be A B C D E.A
Walk – A path where you can move along
edges between vertices, but you can use
each vertex more than once. For example,
for the graph 2 a walk could be
ABDCAEBCD.
A Circuit – A closed path, i.e. the end
vertex of the last edge is the start
vertex of the first edge, also known as a
cycle. For example, here a circuit could
be ABCA.
Graph 2
B
A
C
D E
A Bipartite Graph – A graph with two
sets of vertices were the connections are
between the two sets and not within the
two sets.
Graph 3
Isomorphic
A graph is isomorphic if it the nodes and
edges are all connected up in an identical
way, but the shape is drawn differently.
Shape 1 Shape 2
these are isomorphic
A Complete graph - A graph in which
each of the n vertices is connected to
every other vertex.
B
A
C
D E
Complete Graph Notation.
kn = a complete graph with n
nodes,
eg the graph opposite is k5
Complete Bipartite Graph Notation.
km,n = a complete bipartite graph
with m nodes on one side
connected to n nodes on the other.
eg, k2,3 =
3. Graph Matrices
Adjacency Matrix (for ordinary graphs or digraphs – you may have loops in your
graphs)
B
A
E
C D
Distance Matrix (for weighted graphs or digraphs)
B
A 11
3 5
E
5 8
C D
Algorithms used with Networks
Minimum spanning tree (MST)
A MST is a tree such that the total length of its edges is as small as possible,
sometimes called a minimum connector.
There are two different algorithms used to find the MST for a network :
• Prim’s Algorithm
• Kruskal’s Algorithm
Prim’s Algorithm
Robert Clay Prim (born 1921 in Sweetwater, Texas) is an American mathematician and
computer scientist. During the climax of World War II (1941–1944), Prim worked as an
engineer for General Electric. From 1944 until 1949, he was hired by the United States Naval
A B C D E
A 0 1 0 0 0
B 1 0 1 0 1
C 0 1 0 0 0
D 0 0 0 0 1
E 0 1 0 1 2
A B C D E
A - 3 - - -
B 3 - 5 - 5
C - 5 - - -
D - - - - 8
E - 5 - 8 -
Notice that a loop
counts as two as you can
go around either way
You will only have
weighted digraphs
with directed loops to
construct for your
exam
4. Ordnance Lab as an engineer and later a mathematician. At Bell Laboratories, he served as director of
mathematics research from 1958 to 1961. There, Prim developed Prim's algorithm. Prim's algorithm,
was originally discovered in 1930 by mathematician Vojtech Jarnik and later independently by Prim in
1957. It was later rediscovered by Edsger Dijkstra in 1959.
Vojtěch Jarník (Czech pronunciation: December 22, 1897 – September 22,
1970) was a Czech mathematician. His main area of work was in number theory
and mathematical analysis; he proved a number of results on lattice point
problems. He also developed the graph theory algorithm known as Prim's
algorithm.
Prim’s algorithms is a “greedy algorithm” follows a set of rules
looking for the best immediate solution rather than trying to find
the optimized solution.
1. Choose any vertex to start the tree
2. Select an edge of least weight that joins a vertex that is already in the tree to
another vertex not yet in the tree (if there are two or more equal weights,
choose any of these)
3. Repeat 2 until all vertices are connected (must end with a tree (no circuits or
loops).
Here :
Start at A E
Then A B
Then E C
Then C F
Then E D
Total weight =
3+4+7+5+11 = 30
B
C
A
F
E
D
4
7
8
3
12
10
12
11
5
8
5. Kruskal’s Algorithm
Joseph Bernard Kruskal, Jr. (born January 29, 1928) is an American
mathematician, statistician, computer scientist and psychometrician. His best
known work is Kruskal's algorithm for computing the minimal spanning tree
(MST) of a weighted graph. Minimal spanning trees have applications to the
construction and pricing of communication networks. Kruskal also applied his
work in linguistics, in an experimental lexicostatistical study of Indo-European
languages, together with the linguists Isidore Dyen and Paul Black.
1. Sort all edges into ascending order of weight
2. Select the edge of least weight to start the tree
3. Consider the next edge of least weight
a. If it forms a cycle, reject it
b. If it does not for a cycle, add it to the tree
4. Repeat step 3 until all vertices are connected.
Here :
Ordered connections –
AE, AB, CF, EC, EF, BF,
AC, DE, BC, AD
Select AE
Then AB
Then CF
(reject EF as it forms a
cycle CEFC)
Then EC
(reject BF as it forms a
cycle AECFBA)
Then ED
Total weight = 30
B
C
A
F
E
D
4
7
8
3
12
10
12
11
5
8
6. Using Prim’s on a distance matrix
1
A B C D E F
A - 4 1
0
1
2
3 -
B 4 - 1
2
- - 8
C 1
0
1
2
- - 7 5
D 1
2
- - - 1
1
-
E 3 - 7 1
1
- 8
F - 8 5 - 8 -
1 2
A B C D E F
A - 4 1
0
1
2
3 -
B 4 - 1
2
- - 8
C 1
0
1
2
- - 7 5
D 1
2
- - - 1
1
-
E 3 - 7 1
1
- 8
F - 8 5 - 8 -
1 3 2
A B C D E F
A - 4 1 1 3 -
0 2
B 4 - 1
2
- - 8
C 1
0
1
2
- - 7 5
D 1
2
- - - 1
1
-
E 3 - 7 1
1
- 8
F - 8 5 - 8 -
1 3 4 2
A B C D E F
A - 4 1
0
1
2
3 -
B 4 - 1
2
- - 8
C 1
0
1
2
- - 7 5
D 1
2
- - - 1
1
-
E 3 - 7 1
1
- 8
F - 8 5 - 8 -
1 3 4 2 5
A B C D E F
A - 4 1
0
1
2
3 -
B
C
A
F
E
D
4
7
8
3
12
10
12
11
5
8
7. B 4 - 1
2
- - 8
C 1
0
1
2
- - 7 5
D 1
2
- - - 1
1
-
E 3 - 7 1
1
- 8
F - 8 5 - 8 -
1 3 4 6 2 5
A B C D E F
A - 4 1
0
1
2
3 -
B 4 - 1
2
- - 8
C 1
0
1
2
- - 7 5
D 1
2
- - - 1
1
-
E 3 - 7 1
1
- 8
F - 8 5 - 8 -
Here the MST is A E, A B, E C, C F, E D = 3+4+7+5+11 = 30