REBGV Stats Package March 2016 Mike Stewart Vancouver Realtor
•
0 likes•3,978 views

http://www.mikestewart.ca/real-estate-board-of-greater-vancouver-rebgv-monthly-sales-statistics

Recommended
Recommended
More Related Content
Viewers also liked
Viewers also liked (6)
More from Mike Stewart
More from Mike Stewart (15)
Recently uploaded
Recently uploaded (20)
REBGV Stats Package March 2016 Mike Stewart Vancouver Realtor
- 1. News ReleaseFOR IMMEDIATE RELEASE: March sales set an all-time record VANCOUVER, B.C. – April 4, 2016 –Metro Vancouver* home sales eclipsed 5,000 in March for the first time on record. Residential property sales in the region totalled 5,173 in March 2016, an increase of 27.4 per cent from the 4,060 sales recorded in March 2015 and an increase of 24 per cent compared to February 2016 when 4,172 homes sold. Last month’s sales were 56 per cent above the 10-year sales average for the month. "March was the highest selling month the REBGV has ever recorded,” Dan Morrison, REBGV president said. “Today's demand is broad based. Home buyers are active in neighbourhoods across our region." New listings for detached, attached and apartment properties in Metro Vancouver totalled 6,278 in March 2016. This represents an increase of 5.2 per cent compared to the 5,968 units listed in March 2015 and an 8 per cent increase compared to February 2016 when 5,812 properties were listed. The total number of properties currently listed for sale on the MLS® system in Metro Vancouver is 7,358, a 40.5 per cent decline compared to March 2015 (12,376) and a 0.8 per cent increase compared to February 2016 (7,299). “Strong job and economic growth in our province, positive net migration and low interest rates are helping to drive this activity," Morrison said. The MLS® Home Price Index composite benchmark price for all residential properties in Metro Vancouver is currently $815,000. This represents a 23.2 per cent increase compared to March 2015. Sales of detached properties in March 2016 reached 2,135, an increase of 24.8 per cent from the 1,711 detached sales recorded in March 2015. The benchmark price for detached properties increased 27.4 per cent from March 2015 to $1,342,500. Sales of apartment properties reached 2,252 in March 2016, an increase of 38.4 per cent compared to the 1,627 sales in March 2015.The benchmark price of an apartment property increased 18.8 per cent from March 2015 to $462,800. Attached property sales in March 2016 totalled 786, an increase of 8.9 per cent compared to the 722 sales in March 2015. The benchmark price of an attached unit increased 20.1 per cent from March 2015 to $589,100.
- 2. *Editor’s Note: Areas covered by Real Estate Board of Greater Vancouver include: Whistler, Sunshine Coast, Squamish, West Vancouver, North Vancouver, Vancouver, Burnaby, New Westminster, Richmond, Port Moody, Port Coquitlam, Coquitlam, New Westminster, Pitt Meadows, Maple Ridge, and South Delta. -30- The real estate industry is a key economic driver in British Columbia. In 2015, 42,326 homes changed ownership in the Board’s area, generating $2.7 billion in economic spin-off activity and an estimated 19,000 jobs. The total dollar value of residential sales transacted through the MLS® system in Greater Vancouver totalled $39 billion in 2015. The Real Estate Board of Greater Vancouver is an association representing more than 12,500 REALTORS® and their companies. The Board provides a variety of member services, including the Multiple Listing Service®. For more information on real estate, statistics, and buying or selling a home, contact a local REALTOR® or visit www.rebgv.org. For more information please contact: Craig Munn Manager, Communication Real Estate Board of Greater Vancouver 604.730.3146 cmunn@rebgv.org
- 3. Property Type Area Benchmark Price Price Index 1 Month Change % 3 Month Change % 6 Month Change % 1 Year Change % 3 Year Change % 5 Year Change % 10 Year Change % Residential / Composite Lower Mainland $719,500 202.9 2.7% 7.5% 13.1% 22.8% 34.2% 36.7% 72.2% Greater Vancouver $815,000 213.3 2.4% 7.0% 12.7% 23.2% 37.2% 39.0% 80.3% Bowen Island $653,500 141.7 1.4% 1.9% 1.6% 10.5% 14.2% 15.5% 19.5% Burnaby East $759,000 209.5 4.0% 7.1% 10.8% 22.2% 36.3% 41.6% 76.8% Burnaby North $675,000 202.9 2.9% 7.8% 11.0% 21.2% 33.0% 36.6% 72.4% Burnaby South $735,600 207.9 1.6% 5.3% 9.0% 18.5% 32.3% 33.4% 75.9% Coquitlam $690,200 204.8 2.8% 8.2% 13.7% 25.3% 40.1% 42.0% 76.1% Ladner $741,900 206.2 4.1% 5.9% 14.1% 26.7% 37.6% 44.7% 79.1% Maple Ridge $482,200 162.9 3.6% 8.9% 12.6% 19.5% 25.0% 24.1% 44.2% New Westminster $470,800 200.5 3.5% 7.8% 11.8% 21.4% 28.0% 32.7% 65.4% North Vancouver $870,400 196.4 2.0% 5.4% 13.4% 19.8% 36.0% 41.8% 70.0% Pitt Meadows $470,800 172.2 3.2% 7.4% 10.2% 15.0% 24.4% 23.1% 49.3% Port Coquitlam $530,800 188.1 3.2% 9.6% 14.8% 26.1% 35.9% 32.4% 60.4% Port Moody $702,400 194.2 2.9% 8.0% 14.9% 24.0% 41.1% 43.3% 63.7% Richmond $768,500 222.7 2.5% 7.3% 13.0% 24.3% 36.2% 32.5% 88.4% Squamish $535,700 174.6 4.6% 6.8% 10.8% 16.8% 38.5% 45.3% 58.2% Sunshine Coast $413,000 144.7 3.4% 4.9% 7.3% 16.3% 21.4% 15.3% 20.0% Tsawwassen $860,300 215.5 3.7% 7.8% 15.5% 31.6% 44.3% 54.9% 85.0% Vancouver East $857,900 251.3 1.7% 6.4% 13.6% 26.3% 43.5% 53.3% 107.3% Vancouver West $1,116,000 235.2 1.9% 6.8% 13.4% 23.9% 41.7% 43.9% 95.0% West Vancouver $2,339,700 251.1 3.8% 7.3% 14.6% 29.4% 52.3% 70.2% 113.9% Whistler $616,800 143.3 5.1% 8.0% 9.0% 15.7% 36.3% 35.1% 31.6% Single Family Detached Lower Mainland $1,070,100 227.3 3.1% 8.3% 14.3% 26.8% 43.5% 49.7% 95.3% Greater Vancouver $1,342,500 247.6 2.8% 7.4% 13.7% 27.4% 47.6% 53.2% 111.8% Bowen Island $653,500 141.7 1.4% 1.9% 1.6% 10.5% 14.2% 15.5% 19.5% Burnaby East $1,092,500 244.3 3.0% 9.1% 15.3% 31.4% 47.9% 63.3% 105.1% Burnaby North $1,360,000 263.0 2.2% 8.4% 12.2% 28.1% 51.4% 67.2% 127.1% Burnaby South $1,394,800 267.0 2.9% 7.3% 12.7% 25.8% 50.8% 60.3% 123.4% Coquitlam $1,046,100 232.1 3.9% 8.9% 16.0% 29.7% 49.0% 59.0% 101.8% Ladner $916,300 220.9 3.2% 5.6% 17.0% 32.4% 44.2% 56.1% 93.6% Maple Ridge $602,300 171.6 4.1% 10.2% 14.6% 23.7% 31.7% 33.1% 53.6% New Westminster $950,900 235.9 3.6% 9.0% 14.7% 31.1% 44.7% 49.3% 99.2% North Vancouver $1,422,900 226.5 3.0% 7.6% 17.4% 28.0% 51.8% 63.3% 96.4% Pitt Meadows $661,900 186.5 3.8% 9.2% 12.6% 22.7% 35.0% 34.5% 64.0% Port Coquitlam $804,900 214.7 3.6% 8.9% 15.8% 32.2% 48.3% 50.9% 85.4% Port Moody $1,210,800 223.6 4.0% 8.1% 14.7% 29.0% 49.5% 54.4% 92.8% Richmond $1,413,500 283.5 3.2% 9.0% 16.8% 31.4% 50.0% 39.9% 139.6% Squamish $658,600 175.1 2.5% 4.1% 7.8% 14.3% 31.4% 44.4% 56.1% Sunshine Coast $411,300 144.1 3.3% 5.0% 7.5% 16.5% 21.4% 14.6% 19.5% Tsawwassen $1,110,800 239.2 3.7% 8.7% 19.5% 39.6% 55.1% 70.2% 105.0% Vancouver East $1,288,400 284.8 1.8% 5.4% 11.0% 26.9% 56.6% 70.7% 139.5% Vancouver West $3,072,000 315.4 2.3% 6.4% 12.0% 25.5% 51.4% 60.3% 166.2% West Vancouver $2,799,900 266.2 3.3% 7.0% 13.6% 28.7% 54.4% 74.1% 124.8% Whistler $1,126,900 156.0 2.6% 3.7% 6.1% 10.0% 25.7% 33.7% 40.3% HOW TO READ THE TABLE: • Benchmark Price: Estimated sale price of a benchmark property. Benchmarks represent a typical property within each market. • Price Index: Index numbers estimate the percentage change in price on typical and constant quality properties over time. All figures are based on past sales. • x Month/Year Change %: Percentage change of index over a period of x month(s)/year(s) * In January 2005, the indexes are set to 100. Townhome properties are similar to Attached properties, a category that was used in the previous MLSLink HPI, but do not included duplexes. The above info is deemed reliable, but is not guaranteed. All dollar amounts in CDN. March 2016* * MLS®, Multiple Listing Service®, and all related graphics are trademarks of The Canadian Real Estate Association 1 of 14
- 4. Property Type Area Benchmark Price Price Index 1 Month Change % 3 Month Change % 6 Month Change % 1 Year Change % 3 Year Change % 5 Year Change % 10 Year Change % March 2016* Townhouse Lower Mainland $480,800 174.0 2.8% 6.9% 11.8% 17.8% 23.2% 21.3% 50.4% Greater Vancouver $589,100 190.4 3.4% 7.1% 12.3% 20.1% 29.1% 27.3% 64.1% Burnaby East $424,100 152.1 5.2% -0.9% -4.9% -2.8% 4.8% 1.8% 31.8% Burnaby North $460,200 171.6 1.3% 2.7% 4.3% 12.2% 15.0% 11.6% 45.1% Burnaby South $476,000 170.8 1.9% 4.6% 6.2% 16.0% 15.6% 13.6% 50.5% Coquitlam $491,600 180.6 4.3% 10.6% 13.5% 21.4% 29.0% 30.5% 54.0% Ladner $573,700 190.1 6.3% 8.8% 14.5% 22.9% 31.8% 27.4% 61.2% Maple Ridge $318,900 154.9 2.0% 5.2% 7.6% 13.5% 17.0% 13.0% 34.5% New Westminster $461,300 173.3 5.0% 3.7% 5.3% 9.3% 20.1% 18.2% 47.7% North Vancouver $734,500 175.8 0.9% 4.5% 11.4% 18.1% 25.8% 29.2% 53.7% Pitt Meadows $391,700 169.5 1.9% 3.7% 8.6% 16.5% 21.3% 15.1% 45.7% Port Coquitlam $485,200 184.0 4.9% 16.7% 19.6% 27.4% 31.5% 29.5% 56.1% Port Moody $521,700 176.3 -0.8% 3.6% 12.6% 20.3% 29.5% 24.9% 49.3% Richmond $631,600 204.2 2.9% 7.2% 11.5% 20.0% 29.5% 27.2% 76.8% Squamish $550,900 200.1 8.4% 13.5% 15.1% 23.1% 68.3% 59.1% 89.7% Tsawwassen $570,100 188.4 7.8% 8.4% 16.0% 22.7% 33.6% 21.7% 59.8% Vancouver East $714,000 235.4 4.4% 9.6% 23.3% 34.1% 40.8% 43.4% 91.9% Vancouver West $939,000 212.4 3.5% 4.6% 15.4% 21.7% 33.6% 38.5% 83.3% Whistler $690,000 184.5 9.0% 13.3% 13.3% 21.4% 59.9% 46.5% 77.9% Apartment Lower Mainland $415,200 181.3 1.9% 6.3% 11.4% 18.2% 24.1% 23.8% 50.2% Greater Vancouver $462,800 186.1 1.8% 6.3% 11.6% 18.8% 27.1% 26.2% 54.4% Burnaby East $533,600 202.6 2.5% 9.2% 17.5% 27.7% 42.3% 44.2% 64.8% Burnaby North $405,100 171.3 3.8% 8.2% 10.9% 16.1% 22.1% 21.4% 43.9% Burnaby South $462,300 185.6 0.9% 4.4% 7.6% 14.6% 23.9% 20.8% 56.2% Coquitlam $313,800 172.7 0.3% 6.3% 10.6% 19.8% 29.6% 19.4% 46.1% Ladner $351,100 166.4 4.7% 3.9% 1.0% 8.4% 16.5% 20.3% 44.1% Maple Ridge $177,700 128.3 3.8% 6.9% 7.5% 3.3% 0.5% -4.6% 9.6% New Westminster $333,500 189.9 3.1% 7.3% 10.9% 18.3% 21.8% 27.1% 55.0% North Vancouver $403,200 164.1 1.0% 2.2% 8.0% 9.0% 18.0% 17.8% 41.3% Pitt Meadows $262,300 155.0 3.4% 7.6% 7.2% 3.5% 12.5% 17.2% 32.4% Port Coquitlam $265,200 157.2 0.6% 4.6% 9.3% 16.0% 22.4% 10.7% 32.4% Port Moody $427,900 178.3 3.6% 10.2% 16.2% 19.5% 36.9% 42.2% 46.4% Richmond $404,700 170.9 2.3% 5.4% 8.7% 15.4% 19.2% 19.3% 42.4% Squamish $310,500 149.5 4.7% 4.4% 10.9% 16.5% 28.7% 37.4% 34.2% Tsawwassen $358,900 151.3 4.6% 4.4% 0.8% 7.2% 12.7% 14.7% 31.0% Vancouver East $390,200 215.2 1.3% 7.1% 15.3% 23.3% 27.9% 34.1% 72.7% Vancouver West $635,300 205.6 1.7% 7.6% 14.3% 23.5% 36.9% 34.6% 68.5% West Vancouver $822,000 179.6 7.9% 7.4% 18.3% 29.0% 34.3% 42.2% 58.5% Whistler $309,000 101.3 3.2% 8.0% 11.2% 20.5% 32.9% 88.3% -9.5% HOW TO READ THE TABLE: • Benchmark Price: Estimated sale price of a benchmark property. Benchmarks represent a typical property within each market. • Price Index: Index numbers estimate the percentage change in price on typical and constant quality properties over time. All figures are based on past sales. • x Month/Year Change %: Percentage change of index over a period of x month(s)/year(s) In January 2005, the indexes are set to 100. * Townhome properties are similar to attached properties, a category that was used in the previous MLSLink HPI, but do not included duplexes. Lower Mainland includes areas serviced by both Real Estate Board of Greater Vancouver & Fraser Valley Real Estate Board. The above info is deemed reliable, but is not guaranteed. All dollar amounts in CDN. * MLS®, Multiple Listing Service®, and all related graphics are trademarks of The Canadian Real Estate Association 2 of 14
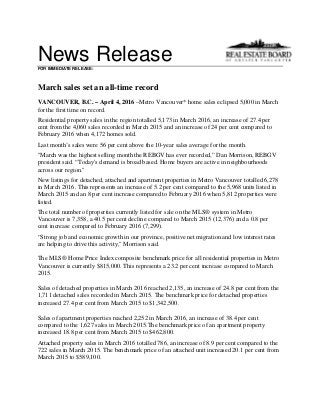
- 5. C:DATAMonthEndHpiexporthi_resgv-hpi2.tifGreaterVancouver 5YearTrend 60 80 100 120 140 160 180 200 220 240 260 Mar 2011 May 2011 Jul 2011 Sep 2011 Nov 2011 Jan 2012 Mar 2012 May 2012 Jul 2012 Sep 2012 Nov 2012 Jan 2013 Mar 2013 May 2013 Jul 2013 Sep 2013 Nov 2013 Jan 2014 Mar 2014 May 2014 Jul 2014 Sep 2014 Nov 2014 Jan 2015 Mar 2015 May 2015 Jul 2015 Sep 2015 Nov 2015 Jan 2016 Mar 2016 Price Index ResidentialDetachedTownhouseApartment Jan2005HPI=100
- 8. Listing & Sales Activity Summary Listings Sales 1 2 3 Col. 2 & 3 5 6 7 Col. 6 & 7 9 10 Col. 9 & 10 Mar Feb Mar Percentage Mar Feb Mar Percentage Jan 2015 - Jan 2016 - Percentage 2015 2016 2016 Variance 2015 2016 2016 Variance Mar 2015 Mar 2016 Variance BURNABY % % % DETACHED 236 257 230 -10.5 188 150 181 20.7 395 428 8.4 ATTACHED 139 102 124 21.6 92 78 96 23.1 233 224 -3.9 APARTMENTS 343 281 326 16.0 210 235 322 37.0 470 736 56.6 COQUITLAM DETACHED 201 241 291 20.7 137 177 192 8.5 311 472 51.8 ATTACHED 75 68 85 25.0 56 56 79 41.1 119 168 41.2 APARTMENTS 189 148 175 18.2 110 136 163 19.9 251 392 56.2 DELTA DETACHED 90 144 132 -8.3 66 60 91 51.7 151 203 34.4 ATTACHED 14 10 18 80.0 11 6 11 83.3 22 20 -9.1 APARTMENTS 28 27 24 -11.1 31 20 36 80.0 52 65 25.0 MAPLE RIDGE/PITT MEADOWS DETACHED 243 247 360 45.7 149 203 254 25.1 355 568 60.0 ATTACHED 95 93 78 -16.1 58 77 90 16.9 118 205 73.7 APARTMENTS 69 53 64 20.8 29 48 50 4.2 76 125 64.5 NORTH VANCOUVER DETACHED 237 237 197 -16.9 189 159 180 13.2 381 407 6.8 ATTACHED 66 76 54 -28.9 65 54 61 13.0 140 152 8.6 APARTMENTS 211 162 179 10.5 141 129 156 20.9 292 347 18.8 NEW WESTMINSTER DETACHED 32 69 93 34.8 35 47 63 34.0 79 132 67.1 ATTACHED 27 19 17 -10.5 16 11 18 63.6 37 40 8.1 APARTMENTS 178 139 155 11.5 87 101 111 9.9 223 268 20.2 PORT MOODY/BELCARRA DETACHED 51 68 63 -7.4 35 29 58 100.0 66 109 65.2 ATTACHED 29 25 31 24.0 21 17 22 29.4 42 51 21.4 APARTMENTS 37 49 59 20.4 20 34 46 35.3 55 99 80.0 PORT COQUITLAM DETACHED 66 93 124 33.3 49 80 87 8.8 109 194 78.0 ATTACHED 43 51 55 7.8 41 32 46 43.8 85 99 16.5 APARTMENTS 96 84 94 11.9 48 76 85 11.8 100 204 104.0 RICHMOND DETACHED 285 382 412 7.9 229 204 254 24.5 511 620 21.3 ATTACHED 146 97 175 80.4 117 100 133 33.0 277 309 11.6 APARTMENTS 321 274 338 23.4 195 223 274 22.9 435 651 49.7 SUNSHINE COAST DETACHED 151 103 151 46.6 54 82 136 65.9 120 260 116.7 ATTACHED 14 5 9 80.0 6 10 9 -10.0 11 27 145.5 APARTMENTS 11 17 10 -41.2 5 8 13 62.5 18 25 38.9 SQUAMISH DETACHED 57 34 46 35.3 38 27 34 25.9 74 78 5.4 ATTACHED 23 26 30 15.4 23 20 27 35.0 51 51 0.0 APARTMENTS 23 32 39 21.9 15 17 26 52.9 36 50 38.9 VANCOUVER EAST DETACHED 298 257 306 19.1 210 167 207 24.0 450 473 5.1 ATTACHED 78 44 67 52.3 63 36 58 61.1 128 114 -10.9 APARTMENTS 248 206 202 -1.9 190 139 208 49.6 420 435 3.6 VANCOUVER WEST DETACHED 306 412 298 -27.7 209 226 219 -3.1 475 579 21.9 ATTACHED 149 101 96 -5.0 108 75 99 32.0 207 210 1.4 APARTMENTS 727 684 689 0.7 506 550 682 24.0 1135 1535 35.2 WHISTLER/PEMBERTON DETACHED 28 26 25 -3.8 17 22 29 31.8 36 59 63.9 ATTACHED 34 32 50 56.3 28 23 30 30.4 69 73 5.8 APARTMENTS 42 52 48 -7.7 24 57 55 -3.5 72 147 104.2 WEST VANCOUVER/HOWE SOUND DETACHED 182 241 203 -15.8 101 141 146 3.5 266 369 38.7 ATTACHED 19 5 8 60.0 17 9 7 -22.2 27 23 -14.8 APARTMENTS 22 31 33 6.5 16 17 25 47.1 45 59 31.1 GRAND TOTALS DETACHED 2463 2811 2931 4.3 1706 1774 2131 20.1 3779 4951 31.0 ATTACHED 951 754 897 19.0 722 604 786 30.1 1566 1766 12.8 APARTMENTS 2545 2239 2435 8.8 1627 1790 2252 25.8 3680 5138 39.6