January 2017 Rebgv Statistics Package Mike Stewart Vancouver Realtor
•
0 gostou•5,879 visualizações

http://www.mikestewart.ca/real-estate-board-of-greater-vancouver-rebgv-monthly-sales-statistics/

Recomendados
Recomendados
Mais conteúdo relacionado
Mais procurados
Mais procurados (20)
Semelhante a January 2017 Rebgv Statistics Package Mike Stewart Vancouver Realtor
Semelhante a January 2017 Rebgv Statistics Package Mike Stewart Vancouver Realtor (20)
Mais de Mike Stewart
Último
Último (20)
January 2017 Rebgv Statistics Package Mike Stewart Vancouver Realtor
- 1. News Release FOR IMMEDIATE RELEASE: Metro Vancouver housing market off to a quieter start than last year VANCOUVER, BC – February 2, 2017 – Home sales and listings trends are below long-term averages in the Metro Vancouver* housing market. This is due largely to reduced activity in the detached home market. Residential property sales in the region totalled 1,523 in January 2017, a 39.5 per cent decrease from the 2,519 sales recorded in January 2016 and an 11.1 per cent decrease compared to December 2016 when 1,714 homes sold. Last month’s sales were 10.3 per cent below our 10-year January sales average. “From a real estate perspective, it’s a lukewarm start to the year compared to 2016,” Dan Morrison, Real Estate Board of Greater Vancouver (REBGV) president said. “While we saw near record-breaking sales at this time last year, home buyers and sellers are more reluctant to engage so far in 2017.” New listings for detached, attached and apartment properties in Metro Vancouver totalled 4,140 in January 2017. This represents a 6.8 per cent decrease compared to the 4,442 homes listed in January 2016 and a 215.5 per cent increase compared to December 2016 when 1,312 properties were listed. The total number of homes currently listed for sale on the Multiple Listing Service® (MLS®) in Metro Vancouver is 7,238, a 9.1 per cent increase compared to January 2016 (6,635) and a 14.1 per cent increase compared to December 2016 (6,345). The sales-to-active listings ratio for January 2017 is 21 per cent. This is the lowest the ratio has been in the region since January 2015. Generally, analysts say that downward pressure on home prices occurs when the ratio dips below the 12 per cent mark for a sustained period, while home prices often experience upward pressure when it surpasses 20 per cent over several months. “Conditions within the market vary depending on property type. The townhome and condominium markets are more active than the detached market at the moment,” Morrison said. “As a result, detached home prices declined about 7 per cent since peaking in July while townhome and condominium prices held steady over this period.” The MLS® Home Price Index composite benchmark price for all residential properties in Metro Vancouver is currently $896,000. This represents a 3.7 per cent decline over the past six months and a 0.2 per cent decrease compared to December 2016.
- 2. Sales of detached properties in January 2017 reached 444, a decrease of 57.6 per cent from the 1,047 detached sales recorded in January 2016. The benchmark price for detached properties is $1,474,800. This represents a 6.6 per cent decline over the last six months and a 0.6 per cent decrease compared to December 2016. Sales of apartment properties reached 825 in January 2017, a decrease of 24.7 per cent compared to the 1,096 sales in January 2016.The benchmark price of an apartment property is $512,300. This represents a 0.3 per cent increase over the last six months and a 0.4 per cent increase compared to December 2016. Attached property sales in January 2017 totalled 254, a decrease of 32.4 per cent compared to the 376 sales in January 2016. The benchmark price of an attached unit is $666,500. This represents a 0.4 per cent decline over the last six months and a 0.7 per cent increase compared to December 2016. -30- *Editor’s Note: Areas covered by the Real Estate Board of Greater Vancouver include: Whistler, Sunshine Coast, Squamish, West Vancouver, North Vancouver, Vancouver, Burnaby, New Westminster, Richmond, Port Moody, Port Coquitlam, Coquitlam, Pitt Meadows, Maple Ridge, and South Delta. The real estate industry is a key economic driver in British Columbia. In 2016, 39,943 homes changed ownership in the Board’s area, generating $2.5 billion in economic spin-off activity and an estimated 17,600 jobs. The total dollar value of residential sales transacted through the MLS® system in Greater Vancouver totalled $40 billion in 2016. The Real Estate Board of Greater Vancouver is an association representing more than 13,400 REALTORS® and their companies. The Board provides a variety of member services, including the Multiple Listing Service®. For more information on real estate, statistics, and buying or selling a home, contact a local REALTOR® or visit www.rebgv.org. For more information please contact: Craig Munn Manager, Communication Real Estate Board of Greater Vancouver 604.730.3146 cmunn@rebgv.org
- 3. Property Type Area Benchmark Price Price Index 1 Month Change % 3 Month Change % 6 Month Change % 1 Year Change % 3 Year Change % 5 Year Change % 10 Year Change % Residential / Composite Lower Mainland $804,000 226.7 0.0% -2.1% -2.8% 18.0% 47.6% 48.7% 73.7% Greater Vancouver $896,000 234.5 -0.2% -2.5% -3.7% 15.6% 47.4% 48.2% 80.7% Bowen Island $830,200 180.0 0.7% 4.7% 4.7% 27.8% 47.4% 47.4% 43.7% Burnaby East $831,800 229.6 -0.1% -1.2% -3.1% 16.3% 46.1% 49.5% 75.7% Burnaby North $772,300 232.1 0.6% 0.3% -0.9% 20.1% 50.2% 50.4% 79.0% Burnaby South $868,200 245.4 1.2% 1.5% -0.1% 23.4% 50.7% 53.7% 90.7% Coquitlam $732,200 217.3 -1.0% -4.4% -6.0% 12.0% 43.4% 50.4% 68.1% Ladner $784,400 218.0 -1.0% -5.6% -6.4% 12.9% 50.0% 47.7% 74.3% Maple Ridge $570,600 192.8 0.4% -0.8% 0.8% 25.6% 48.8% 46.2% 51.3% New Westminster $533,500 227.2 0.7% 1.3% 0.8% 19.8% 44.4% 47.7% 67.9% North Vancouver $964,000 217.5 -0.2% -3.1% -5.3% 15.2% 47.9% 50.6% 75.3% Pitt Meadows $558,800 204.4 0.3% -0.1% 3.1% 24.6% 41.7% 50.5% 56.5% Port Coquitlam $571,400 202.5 -0.3% -3.3% -4.6% 14.9% 42.3% 42.4% 54.6% Port Moody $766,000 211.8 0.0% -0.4% -0.6% 15.7% 50.0% 57.8% 64.8% Richmond $853,800 247.4 0.0% -2.5% -3.4% 17.0% 49.9% 44.5% 90.9% Squamish $658,600 214.7 2.0% 6.7% 8.4% 28.3% 69.5% 78.3% 82.4% Sunshine Coast $505,800 177.2 2.1% 4.1% 7.8% 26.3% 50.0% 40.5% 38.7% Tsawwassen $911,700 228.4 -1.3% -6.7% -7.9% 12.2% 55.2% 57.0% 80.7% Vancouver East $952,200 278.9 0.1% -3.9% -3.5% 16.2% 54.0% 61.3% 108.9% Vancouver West $1,184,800 249.7 -0.8% -3.9% -5.7% 11.9% 44.3% 45.8% 89.7% West Vancouver $2,436,700 261.5 -1.3% -8.2% -12.3% 10.1% 52.6% 60.1% 104.5% Whistler $748,100 173.8 0.8% 6.3% 8.8% 25.2% 61.1% 64.1% 50.6% Single Family Detached Lower Mainland $1,194,000 253.6 -0.4% -3.6% -5.3% 18.3% 56.7% 58.5% 97.7% Greater Vancouver $1,474,800 272.0 -0.6% -4.6% -6.6% 15.8% 58.3% 58.2% 113.3% Bowen Island $830,200 180.0 0.7% 4.7% 4.7% 27.8% 47.4% 47.4% 43.7% Burnaby East $1,150,600 257.3 -1.2% -2.6% -8.0% 12.3% 54.5% 58.0% 103.2% Burnaby North $1,480,500 286.3 -0.6% -4.4% -7.7% 14.7% 59.9% 62.5% 124.7% Burnaby South $1,635,100 313.0 0.8% -1.3% -4.4% 24.4% 68.2% 73.1% 145.1% Coquitlam $1,107,700 245.8 -1.6% -7.5% -9.7% 12.9% 53.1% 63.0% 92.9% Ladner $967,800 233.3 -1.3% -6.6% -6.3% 11.7% 60.8% 58.7% 88.1% Maple Ridge $711,800 202.8 0.5% -0.4% 0.8% 27.3% 56.5% 54.6% 63.3% New Westminster $1,023,900 254.0 -1.1% -2.1% -6.8% 14.9% 55.7% 54.9% 100.3% North Vancouver $1,564,200 249.0 -0.9% -5.7% -7.9% 15.7% 64.6% 65.9% 104.6% Pitt Meadows $770,100 217.0 0.1% -2.8% 0.4% 24.2% 56.5% 54.0% 70.6% Port Coquitlam $833,000 222.2 -1.8% -5.3% -9.4% 9.9% 48.1% 52.8% 75.7% Port Moody $1,344,000 248.2 -0.8% -2.5% -3.8% 18.4% 56.2% 69.5% 94.1% Richmond $1,566,000 314.1 -0.9% -6.4% -8.8% 18.3% 67.5% 56.6% 141.8% Squamish $816,200 217.0 0.3% 6.0% 4.7% 25.2% 61.8% 59.0% 81.9% Sunshine Coast $502,900 176.2 2.0% 4.0% 7.6% 26.0% 49.8% 40.1% 37.9% Tsawwassen $1,162,400 250.3 -1.9% -7.3% -8.4% 11.1% 64.9% 69.4% 98.3% Vancouver East $1,440,500 318.4 -1.1% -5.0% -5.7% 16.7% 65.9% 75.0% 146.4% Vancouver West $3,419,800 351.1 -0.7% -4.2% -4.8% 16.8% 59.4% 58.4% 164.6% West Vancouver $2,907,100 276.4 -1.4% -9.4% -13.6% 9.3% 53.0% 61.9% 117.0% Whistler $1,354,600 187.5 0.0% 3.4% 5.8% 23.6% 49.0% 51.3% 62.1% HOW TO READ THE TABLE: • Benchmark Price: Estimated sale price of a benchmark property. Benchmarks represent a typical property within each market. • Price Index: Index numbers estimate the percentage change in price on typical and constant quality properties over time. All figures are based on past sales. • x Month/Year Change %: Percentage change of index over a period of x month(s)/year(s) * In January 2005, the indexes are set to 100. Townhome properties are similar to Attached properties, a category that was used in the previous MLSLink HPI, but do not included duplexes. The above info is deemed reliable, but is not guaranteed. All dollar amounts in CDN. January 2017* * MLS®, Multiple Listing Service®, and all related graphics are trademarks of The Canadian Real Estate Association 1 of 14
- 4. Property Type Area Benchmark Price Price Index 1 Month Change % 3 Month Change % 6 Month Change % 1 Year Change % 3 Year Change % 5 Year Change % 10 Year Change % January 2017* Townhouse Lower Mainland $558,100 202.0 0.8% -0.4% 0.8% 22.6% 42.6% 42.1% 56.8% Greater Vancouver $666,500 215.4 0.7% -0.4% -0.4% 19.9% 45.0% 45.4% 68.0% Burnaby East $540,300 193.8 0.9% 1.9% 9.0% 28.9% 28.2% 31.7% 50.3% Burnaby North $523,400 195.2 0.6% 0.8% -0.3% 12.4% 31.9% 26.2% 51.0% Burnaby South $575,200 206.4 1.1% 1.1% 2.9% 27.2% 41.1% 36.6% 63.8% Coquitlam $504,600 185.4 0.1% -0.8% -3.0% 11.2% 33.5% 35.1% 44.5% Ladner $613,900 203.4 -0.4% 2.6% -3.2% 17.6% 38.6% 36.8% 59.5% Maple Ridge $396,200 192.5 1.4% -2.1% -0.5% 25.7% 49.7% 44.0% 46.1% New Westminster $535,600 201.2 -0.3% 3.5% -1.7% 18.6% 35.2% 41.2% 57.6% North Vancouver $831,000 198.9 0.0% -1.3% -4.3% 18.5% 42.3% 41.1% 61.3% Pitt Meadows $483,300 209.1 1.1% 1.9% 3.3% 27.0% 49.1% 55.2% 60.5% Port Coquitlam $529,500 200.8 0.3% -3.3% -1.9% 22.7% 40.0% 41.6% 53.2% Port Moody $512,200 173.1 0.3% -2.3% -5.5% -1.3% 29.7% 29.2% 33.7% Richmond $725,700 234.6 0.6% 1.6% 0.2% 21.7% 44.7% 44.7% 83.6% Squamish $704,100 255.8 8.4% 12.6% 16.2% 45.8% 101.6% 161.8% 120.9% Tsawwassen $607,900 200.9 -0.4% 1.4% -2.6% 18.0% 42.4% 32.6% 57.6% Vancouver East $739,200 243.7 1.1% -4.1% -4.0% 11.8% 42.7% 48.0% 78.8% Vancouver West $1,066,700 241.3 0.5% -5.1% -2.0% 19.5% 55.0% 59.6% 89.1% Whistler $808,800 216.3 0.2% 5.1% 7.1% 32.6% 70.0% 99.2% 94.0% Apartment Lower Mainland $464,100 202.6 0.5% 0.4% 1.4% 16.8% 37.0% 37.7% 50.9% Greater Vancouver $512,300 206.0 0.4% 0.0% 0.3% 15.6% 37.2% 38.8% 55.5% Burnaby East $533,400 202.5 0.8% 1.4% -2.9% 7.9% 35.3% 48.1% 42.6% Burnaby North $490,800 207.5 1.6% 5.0% 6.3% 28.7% 46.7% 48.7% 57.7% Burnaby South $551,200 221.3 1.7% 3.9% 3.0% 23.7% 42.9% 47.2% 70.1% Coquitlam $348,200 191.7 0.4% 1.2% 2.5% 14.4% 34.8% 39.1% 43.9% Ladner $380,900 180.5 1.2% -7.9% -7.4% 16.2% 25.4% 22.5% 42.2% Maple Ridge $207,300 149.7 -0.5% 0.9% 7.2% 22.1% 13.1% 13.0% 8.6% New Westminster $387,000 220.4 1.7% 2.7% 5.0% 22.3% 40.8% 45.6% 58.7% North Vancouver $455,300 185.3 0.6% 0.8% -0.2% 15.2% 29.3% 34.4% 46.1% Pitt Meadows $309,600 183.0 -0.3% 1.2% 6.5% 22.9% 19.8% 42.6% 32.7% Port Coquitlam $307,400 182.2 1.3% -0.2% 2.1% 18.3% 39.5% 32.1% 32.8% Port Moody $493,400 205.6 1.0% 3.4% 7.3% 25.4% 54.5% 63.4% 60.6% Richmond $460,900 194.6 1.0% 2.1% 6.6% 16.6% 33.4% 30.0% 49.1% Squamish $371,200 178.8 0.1% 3.9% 9.1% 18.8% 66.9% 61.7% 53.7% Tsawwassen $405,500 171.0 1.2% -5.1% -5.5% 19.3% 28.6% 24.7% 34.8% Vancouver East $438,800 242.1 0.8% -2.5% 0.7% 17.4% 42.2% 48.3% 73.7% Vancouver West $662,400 214.4 -0.6% -2.6% -5.1% 10.6% 37.4% 39.2% 62.7% West Vancouver $915,800 200.1 0.4% 1.8% 2.4% 19.5% 55.0% 51.8% 54.5% Whistler $402,300 131.9 0.3% 9.1% 13.9% 21.1% 89.0% 71.3% 11.3% HOW TO READ THE TABLE: • Benchmark Price: Estimated sale price of a benchmark property. Benchmarks represent a typical property within each market. • Price Index: Index numbers estimate the percentage change in price on typical and constant quality properties over time. All figures are based on past sales. • x Month/Year Change %: Percentage change of index over a period of x month(s)/year(s) In January 2005, the indexes are set to 100. * Townhome properties are similar to attached properties, a category that was used in the previous MLSLink HPI, but do not included duplexes. Lower Mainland includes areas serviced by both Real Estate Board of Greater Vancouver & Fraser Valley Real Estate Board. The above info is deemed reliable, but is not guaranteed. All dollar amounts in CDN. * MLS®, Multiple Listing Service®, and all related graphics are trademarks of The Canadian Real Estate Association 2 of 14
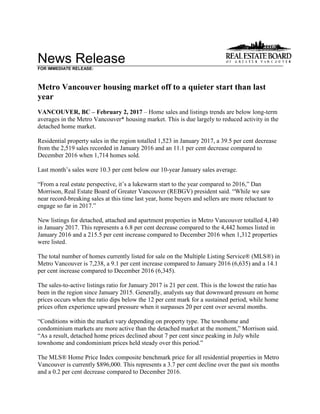
- 5. C:DATAMonthEndHpiexporthi_resgv-hpi2.tifGreaterVancouver 5YearTrend 60 110 160 210 260 310 Jan 2012 Mar 2012 May 2012 Jul 2012 Sep 2012 Nov 2012 Jan 2013 Mar 2013 May 2013 Jul 2013 Sep 2013 Nov 2013 Jan 2014 Mar 2014 May 2014 Jul 2014 Sep 2014 Nov 2014 Jan 2015 Mar 2015 May 2015 Jul 2015 Sep 2015 Nov 2015 Jan 2016 Mar 2016 May 2016 Jul 2016 Sep 2016 Nov 2016 Jan 2017 Price Index ResidentialDetachedTownhouseApartment Jan2005HPI=100
- 8. Listing & Sales Activity Summary Listings Sales 1 2 3 Col. 2 & 3 5 6 7 Col. 6 & 7 9 10 Col. 9 & 10 Jan Dec Jan Percentage Jan Dec Jan Percentage Nov 2015 - Nov 2016 - Percentage 2016 2016 2017 Variance 2016 2016 2017 Variance Jan 2016 Jan 2017 Variance BURNABY % % % DETACHED 169 48 178 270.8 97 42 40 -4.8 316 130 -58.9 ATTACHED 85 21 71 238.1 50 27 27 0.0 203 90 -55.7 APARTMENTS 242 66 205 210.6 179 109 108 -0.9 616 381 -38.1 COQUITLAM DETACHED 167 32 115 259.4 103 47 35 -25.5 332 136 -59.0 ATTACHED 43 10 38 280.0 33 18 19 5.6 127 68 -46.5 APARTMENTS 138 40 123 207.5 93 62 60 -3.2 278 211 -24.1 DELTA DETACHED 97 25 106 324.0 52 18 19 5.6 157 72 -54.1 ATTACHED 7 7 25 257.1 3 8 8 0.0 12 26 116.7 APARTMENTS 24 8 26 225.0 9 10 11 10.0 43 33 -23.3 MAPLE RIDGE/PITT MEADOWS DETACHED 177 43 134 211.6 111 66 57 -13.6 368 206 -44.0 ATTACHED 57 9 62 588.9 38 34 29 -14.7 163 113 -30.7 APARTMENTS 90 26 47 80.8 27 28 35 25.0 94 108 14.9 NORTH VANCOUVER DETACHED 141 25 137 448.0 68 48 34 -29.2 248 143 -42.3 ATTACHED 46 9 32 255.6 37 16 13 -18.8 104 55 -47.1 APARTMENTS 117 35 126 260.0 62 73 59 -19.2 298 218 -26.8 NEW WESTMINSTER DETACHED 34 10 19 90.0 22 9 11 22.2 82 33 -59.8 ATTACHED 9 10 17 70.0 11 6 5 -16.7 36 22 -38.9 APARTMENTS 102 42 96 128.6 56 68 47 -30.9 232 188 -19.0 PORT MOODY/BELCARRA DETACHED 27 7 24 242.9 22 10 8 -20.0 59 28 -52.5 ATTACHED 12 4 8 100.0 12 9 13 44.4 56 30 -46.4 APARTMENTS 32 16 35 118.8 19 22 22 0.0 63 63 0.0 PORT COQUITLAM DETACHED 54 10 44 340.0 27 23 14 -39.1 102 60 -41.2 ATTACHED 39 10 22 120.0 21 10 14 40.0 77 46 -40.3 APARTMENTS 79 21 51 142.9 43 25 31 24.0 124 107 -13.7 RICHMOND DETACHED 243 84 344 309.5 162 59 55 -6.8 531 179 -66.3 ATTACHED 93 47 106 125.5 76 47 47 0.0 276 149 -46.0 APARTMENTS 277 92 210 128.3 154 129 123 -4.7 505 393 -22.2 SUNSHINE COAST DETACHED 63 26 66 153.8 42 43 32 -25.6 172 116 -32.6 ATTACHED 14 2 10 400.0 8 3 6 100.0 25 13 -48.0 APARTMENTS 6 4 7 75.0 4 4 7 75.0 21 25 19.0 SQUAMISH DETACHED 29 12 31 158.3 17 7 16 128.6 69 37 -46.4 ATTACHED 16 4 34 750.0 4 12 11 -8.3 43 38 -11.6 APARTMENTS 24 8 14 75.0 7 16 8 -50.0 25 36 44.0 VANCOUVER EAST DETACHED 210 86 219 154.7 99 63 51 -19.0 365 191 -47.7 ATTACHED 41 19 41 115.8 20 25 12 -52.0 98 64 -34.7 APARTMENTS 139 51 153 200.0 88 94 75 -20.2 336 316 -6.0 VANCOUVER WEST DETACHED 324 65 309 375.4 134 64 36 -43.8 432 168 -61.1 ATTACHED 75 18 73 305.6 36 23 24 4.3 151 91 -39.7 APARTMENTS 583 146 494 238.4 303 237 211 -11.0 1092 744 -31.9 WHISTLER/PEMBERTON DETACHED 16 15 23 53.3 8 7 12 71.4 43 34 -20.9 ATTACHED 20 21 26 23.8 20 17 22 29.4 88 72 -18.2 APARTMENTS 46 23 36 56.5 35 28 15 -46.4 104 81 -22.1 WEST VANCOUVER/HOWE SOUND DETACHED 178 25 166 564.0 82 31 20 -35.5 236 77 -67.4 ATTACHED 14 5 10 100.0 7 3 3 0.0 19 10 -47.4 APARTMENTS 36 24 21 -12.5 17 10 13 30.0 43 36 -16.3 GRAND TOTALS DETACHED 1929 513 1915 273.3 1046 537 440 -18.1 3512 1610 -54.2 ATTACHED 571 196 575 193.4 376 258 253 -1.9 1478 887 -40.0 APARTMENTS 1935 602 1644 173.1 1096 915 825 -9.8 3874 2940 -24.1