
Recomendados
Recomendados
Mais conteúdo relacionado
Mais procurados
Mais procurados (20)
Semelhante a Using GIS to Optimize Local Decisions
Semelhante a Using GIS to Optimize Local Decisions (20)
Using GIS to Optimize Local Decisions
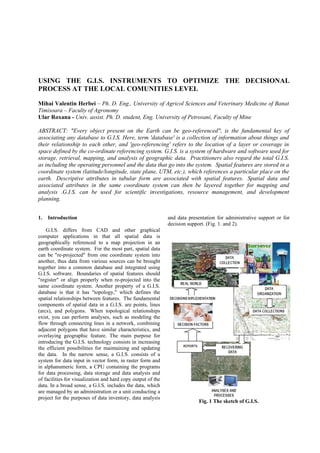
- 1. USING THE G.I.S. INSTRUMENTS TO OPTIMIZE THE DECISIONAL PROCESS AT THE LOCAL COMUNITIES LEVEL Mihai Valentin Herbei – Ph. D. Eng., University of Agricol Sciences and Veterinary Medicine of Banat Timisoara – Faculty of Agronomy Ular Roxana - Univ. assist. Ph. D. student, Eng. University of Petrosani, Faculty of Mine ABSTRACT: "Every object present on the Earth can be geo-referenced", is the fundamental key of associating any database to G.I.S. Here, term 'database' is a collection of information about things and their relationship to each other, and 'geo-referencing' refers to the location of a layer or coverage in space defined by the co-ordinate referencing system. G.I.S. is a system of hardware and software used for storage, retrieval, mapping, and analysis of geographic data. Practitioners also regard the total G.I.S. as including the operating personnel and the data that go into the system. Spatial features are stored in a coordinate system (latitude/longitude, state plane, UTM, etc.), which references a particular place on the earth. Descriptive attributes in tabular form are associated with spatial features. Spatial data and associated attributes in the same coordinate system can then be layered together for mapping and analysis .G.I.S. can be used for scientific investigations, resource management, and development planning. 1. Introduction and data presentation for administrative support or for decision support. (Fig. 1. and 2). G.I.S. differs from CAD and other graphical computer applications in that all spatial data is geographically referenced to a map projection in an earth coordinate system. For the most part, spatial data can be "re-projected" from one coordinate system into another, thus data from various sources can be brought together into a common database and integrated using G.I.S. software. Boundaries of spatial features should "register" or align properly when re-projected into the same coordinate system. Another property of a G.I.S. database is that it has "topology," which defines the spatial relationships between features. The fundamental components of spatial data in a G.I.S. are points, lines (arcs), and polygons. When topological relationships exist, you can perform analyses, such as modeling the flow through connecting lines in a network, combining adjacent polygons that have similar characteristics, and overlaying geographic feature. The main purpose for introducing the G.I.S. technology consists in increasing the efficient possibilities for maintaining and updating the data. In the narrow sense, a G.I.S. consists of a system for data input in vector form, in raster form and in alphanumeric form, a CPU containing the programs for data processing, data storage and data analysis and of facilities for visualization and hard copy output of the data. In a broad sense, a G.I.S. includes the data, which are managed by an administration or a unit conducting a project for the purposes of data inventory, data analysis Fig. 1 The sketch of G.I.S.
- 2. Fig.2 Concept of a G.I.S. 2. Structure of a G.I.S. application necessary quality, in conditions of maxim efficiency. Into the fig. 3 it is presented a general scheme of The G.I.S. technology is used in all fields for which principle of sources that can be taken into consideration the spatial information is relevant, that means in all for making the digital map. fields that use the geographical map for stocking, Acquisitioning the data is the process of conversion analyzing and representing the data which are of the data for the shape in which it is exists in one that processed. can be used by a G.I.S. No matter what is the field, any G.I.S. application The first aspect we may take into account here is the includes a spatial data base (a digital map) and a soft map precision standard of 0,2 mm that depends on the which exploit these data bases. scale assures the G.I.S. data to have a precession like The digital map must contain the spatial data into the following table: specific to any field whose it is designated to this application. In order to furnish some useful information, Table 1 this data base must be actual, which means it must CARTOGRAPHIC CLASSIC ACCURACY represent correctly the terrain (geographic space) that is ACCURACY MAP OF G.I.S. always under changing. SCALE DATA This exploitation soft is made from many functions 1: 25000 5m of analyzing the spatial data contained into the digital 1: 10000 2m map and of visualizing the resulted information, specific 1: 5000 1m 0,2 mm to the application field. 1: 2000 0,4 m 1: 1000 0,2 m 3. Accomplishing the digital map 1: 500 0,1 m The digital map must be made by vaporizing all the In order that the spatial data can be obtained from a existent resources based on a good analyze of these great variety of sources, it must be done the difference content and the involved costs, following to assure the between acquisitioning new data and of the existent one.
- 3. Each data source presumes the existence of some special programs that are used for transforming the data into a shape of the digital map. Fig. 4 Point, line and area objects Fig. 3 Data sources for G.I.S. 4. Models of data from the digital map There are two important components of geographic data: its geographic position and its attributes or properties. In other words, spatial data (where is it?) and attribute data (what is it?). Geographic position specifies the location of a feature or phenomena by using a certain coordinate system. The attributes refer to the properties of spatial entities such as identity (e.g., Fig. 5 Vector format maize, granite, lake), ordinal (ranking, e.g., class 1, class 2, class 3, and so on), or scalar (value, e.g., water A vector format represents the location and shape of depth, elevation, erosion rate, and so on). They are often features and boundaries precisely. Only the accuracy referred to as non-spatial data since they do not in and scale of the map compilation process; the resolution themselves represent location information. of input devices; and the skill of the operator inputting Spatial features in a G.I.S. database are stored in data limit the precision. either vector or raster form. G.I.S. data structures In contrast, the "raster" or "grid-based" format adhering to a "vector" format store the position of map generalizes map features as cells or pixels in a grid features as pairs of x, y (and sometimes z) coordinates. matrix (Fig. 6). The space is defined by a matrix of A point is described by a single X-Y coordinate pair and points or cells, organized into rows and columns. If the by its name or label. A line is described by a set of co- rows and columns are numbered, the position of each ordinate pairs and by its name or label. In reality, a line element can be specified by using column number and is described by an infinite number of points. In practice, row number, which can be linked to coordinate this is not a feasible way of storing a line. Therefore, a positions through the introduction of a coordinate line is built up of straight line segments. An area, also system. Each cell has a attribute value (a number) that called a polygon, is described by a set of coordinate represent a geographic phenomenon or nominal data pairs and by its name or label, with the difference that such as land-use class, rainfall or elevation. The the coordinate pairs at the beginning and the end are the fineness of the grid or, in other words, the size of the same (Fig. 4,5). cells in the grid matrix, will determine the level of detail at which map features are represented. There are advantages to the raster format for storing and processing some types of data in G.I.S..
- 4. Fig. 6 Raster format The "raster" or "grid-based" format generalizes map Fig. 8 Attribute links features as cells or pixels in a grid matrix (Fig. 7). In both models the geographic data of a certain territory are organized on many layers or thematic coverage (Fig. 9.). The digital map is a special territory is represented by the sum of all layers that have been defines. A derived map will be constituted from a layer or a certain combination of layers from the existent ones. One of the main problems that should be solved inside the project of informatics system will be to define the layers that form the digital map and to establish the entities that belong to each layer. Fig Fig. 7 Vector-raster relationship The vector or the raster data are also linked (Fig. 8) to non-graphic information specifying place names and object numbers, which in databases may further be linked to a great variety of coded or alphanumerical attributes (e.g. owners of a parcel, inhabitants of a house, characteristics of a utility feature, statistical data for a defined area). Fig. 9 Layers in a Digital Map 5. Spatial analyses
- 5. requires both geographic and other information (as well The most important feature of a G.I.S. consists in its as specific models). capacity to make spatial analyses, which means to The main spatial operations are as follows: process the spatial data (geographical data) with the • Operations on a single layer; purpose to obtain information (reports) regarding the • Operations on multiple layers; studied area. With this feature of spatial analyze is • Statistic analyze; different the software dedicated to G.I.S. over the • Network analyze; software like the CAD. The processing of spatial data is • Analyze of the surfaces – making the digital model made based on some algorithms specific by using own of the terrain. operations for these such data. A geographic information system must include some 6. Examples of spatial analyses facilities for answering to the following 5 general questions: 6.1. Operations on a single layer LOCATION: "What is at….?" The first of these questions seeks to find what exists at a These operations are called also operations on the particular location. A location can be described in many horizontal. For the vectorial maps it is necessary that the ways, using, for example, place name, postcode, or layers should contain only the graphic primitives of geographic reference such as longitude/ latitude or x and same type, so it will be used the group of operations on y. many layers. CONDITION "Where is it..?" These operations on the horizontal are as follows: The second question is the converse of the first and the manipulation of the graphic primitives (operations requires spatial data to answer. Instead of identifying over the contours and analyze of proximity), their what exists at a given location, one may wish to find selection (their identification) and their classification locations where certain conditions are satisfied (e.g., a (grouping the graphic primitives in classes in order to non-forest area of at least 2,000 square meters in size, make a statistic analyze). within 100 meters of a road, and with soils suitable for The operations that are made over the contours are supporting buildings). as follows: selecting a part of the layer (CLIP – coping a TRENDS: "What has changed since./.?" part of a coverage), removing some graphic primitives The third question might involve both of the first two (ERASE), creating some subdivisions (SPLIT), and seeks to find the differences within an area over assembling some adjacent maps (MAPJOIN), removing time, for example, changes in forest cover or the extent the limits that separate the polygons of same type of urbanization over the last ten years. (DISOLVE) and eliminating some lines (ELIMINATE). PATTERNS: "What spatial pattern exists...?” The analyze of proximity represents the This question is more sophisticated. One might ask this identification some contours at equal distance to graphic question to determine whether landslides are mostly primitive (BUFFER)(Fig. 10). occurring near streams, or to find out which are the traffic points where the accidents occur more frequently. It might be just as important to know how many anomalies there are that do not fit the pattern and where they are located. MODELLING: "What IF...?" "What if…" questions are posed to determine what happens, for example, if a new road is added to a network or if a toxic substance seeps into the local Fig.10 Diagram of simple buffers and a setback groundwater supply. Answering this type of question
- 6. Fig. 11 Geometric spatial queries 6.2. Operations on multiple layers In order to accomplish the operations on multiple layers is needed that all maps involved in this process should be at the same scale and should have the same system of coordinates. These operations are called operations on vertical and they are based on the relations between data on different layers. So, a complex layer may be dissolved in thematic layers and many layers may be combined. These operations are of type “overlay”, proximity analyze and analyze of spatial correlations. The overlay analyzes (Fig. 10) creates some combinations between graphic primitives on different layers and built links between data based on some logical conditions imposed of type: AND, OR, XOR, Fig.12 Example of Polygon-overlay analyze NOT (negation). These operations are as follows: UNION and INTERSECT (intersection). UNION makes that two or many layers should overlap and should result a new coverage. It uses the logic operator OR and it does not that the layers should contain the same type of graphic primitives. INTERSECT uses the logic operator AND, the result being a coverage that contains the common part from the layer and data from the second layer. In this situation the layers must be at the same type of graphic primitive. This operation is more used on layers that contain only polygons. Fig.13 Example of Raster-overlay analyze
- 7. execute responsibilities, and respond to request from 6.3. Generating and interpreting the digital model of citizens, potential developers and other clients. the terrain To accomplish the digital maps and to introduce the G.I.S. systems into local community sectors will increase the level and quality of their decisional process. Being very used in different fields, and starting from the information necessary to any citizen and till environment protection, from the marketing strategies to resources administration, the G.I.S. marked a revolution in solving the problems. The quality information means quality decisions. And G.I.S. offers this possibility, transforming some simple information in real information and offering the interactive access to them. 8. References 1. DUMITRU, G. „Geographic Information System”, Ed. Albastra, 2001 Fig. 14 The 3D model of the surface 2. HERBEI M. - “Performing a Geographic Information System into the areas affected by the mining exploitations by using modern techniques and technologies” - Doctorate thesis, Petrosani, 2009 3. HERBEI O., HERBEI M. – “Geographic Information Systems. Theoretical and applications”, Ed. Universitas, Petroşani, 4. KONECNY, G. – “Geoinformation”, London, 2003 Fig.15 Example of map of Slope 7. Conclusions A geographic information system is an information management tool that helps us to store, organize and utilize spatial information in a form that will enable everyday tasks to be completed more efficiently. Since its rapid growth over the last two decades, G.I.S. technology has become a vital element for us to maintain and integrate information. G.I.S. software, and the hardware required to operate it, have become much more affordable and easy to use. This has resulted in the ability to develop a G.I.S. without making large investments in software, hardware and the support staff that were once needed to implement it. With the implementations of G.I.S., we will see dramatic improvements in the way we access information,