SlideShare uma empresa Scribd logo
1 de 18
Baixar para ler offline
ARTICLE
JOURNAL OF THE ACADEMY et al. / CONSUMER SWITCHING COSTS
                 Burnham OF MARKETING SCIENCE
                 10.1177/0092070302250897                                  SPRING 2003


                                           Consumer Switching Costs: A Typology,
                                           Antecedents, and Consequences
                                           Thomas A. Burnham
                                           Santa Clara University

                                           Judy K. Frels
                                           University of Maryland

                                           Vijay Mahajan
                                           University of Texas at Austin


                                           The management of customer switching costs has been                 In view of the potential importance of switching
                                                                                                               costs, the impact of all strategic moves on switching
                                           hampered by the lack of a comprehensive typology for con-
                                                                                                               costs should be considered.
                                           ceptualizing, categorizing, and measuring consumers’
                                           perceptions of these costs. This research develops a                                      —Michael Porter (1980:122).
                                           switching cost typology that identifies three types of
                                           switching costs: (1) procedural switching costs, primarily
                                                                                                                Reduced regulation, increased price competition, and
                                           involving the loss of time and effort; (2) financial switching
                                                                                                            diminished consumer loyalty have propelled customer
                                           costs, involving the loss of financially quantifiable re-
                                                                                                            retention and customer relationship management (CRM)
                                           sources; and (3) relational switching costs, involving psy-
                                                                                                            to the forefront of marketing concerns (Marketing Science
                                           chological or emotional discomfort due to the loss of
                                                                                                            Institute 2002). As the primary tool for managing cus-
                                           identity and the breaking of bonds. The research then ex-
                                                                                                            tomer retention, customer satisfaction has received
                                           amines the antecedents and consequences of switching
                                                                                                            unflagging attention in the marketing literature (cf. Ander-
                                           costs. The results suggest that consumers’ perceptions of
                                                                                                            son and Sullivan 1993; Fornell 1992; Fournier and Mick
                                           product complexity and provider heterogeneity, their
                                                                                                            1999; Szymanski and Henard 2001). Firms around the
                                           breadth of product use, and their alternative provider and
                                                                                                            world have adopted customer satisfaction measures as a de
                                           switching experience drive the switching costs they per-
                                                                                                            facto standard for monitoring progress, motivated by the
                                           ceive. Furthermore, all three switching cost types signifi-
                                                                                                            belief that customer retention and profitability will follow.
                                           cantly influence consumers’ intentions to stay with their
                                                                                                            While evidence accumulates that satisfaction influences
                                           current service provider, explaining more variance than
                                                                                                            repeat purchase behavior, it typically explains only a quar-
                                           does satisfaction.
                                                                                                            ter of the variance in behavioral intentions (see the meta-
                                                                                                            analysis by Szymanski and Henard 2001), and the rela-
                                           Keywords: switching costs; customer satisfaction; cus-
                                                                                                            tionship between satisfaction and loyalty is now recog-
                                                     tomer retention; customer loyalty; customer
                                                                                                            nized as more complex than originally proposed (Fournier
                                                     relationship management
                                                                                                            and Mick 1999; Mittal and Kamakura 2001; Oliver 1999).
                                                                                                            Yet firms appear to be stuck in a “satisfaction trap,” a myo-
                                                                                                            pic belief that customer satisfaction and service quality are
                                                                                                            the only tools for managing customer retention (Reichheld
                                           Journal of the Academy of Marketing Science.
                                                                                                            1996). To break out of this trap, marketers must devote
                                           Volume 31, No. 2, pages 109-126.
                                                                                                            themselves to more fully understand the various drivers of
                                           DOI: 10.1177/0092070302250897
                                                                                                            customer retention. This research investigates an oft-
                                           Copyright © 2003 by Academy of Marketing Science.
110      JOURNAL OF THE ACADEMY OF MARKETING SCIENCE                                                                SPRING 2003


noted, but seldom studied, driver of repeat choice behav-             • Provide an assessment of major theoretical factors
ior: the switching costs that reduce customers’ desire to               that drive consumer switching cost perceptions
leave an incumbent provider.                                          • Assess the effects of different types of switching
                                                                        costs on consumers’ repeat purchase intentions
   Firms regularly make marketing choices that affect
consumers’ perceived switching costs. Consider an exam-
                                                                      To achieve these objectives, we develop a comprehen-
ple from the U.S. long-distance telephone industry. In
                                                                   sive two-tiered typology for conceptualizing consumer
1991, MCI launched the Friends & Family program. This
                                                                   switching costs using data from two consumer service in-
marketing program asked customers to invest time and
                                                                   dustries. At the lower level, the typology provides the
effort building “circles,” or databases of friends and family
                                                                   granularity necessary to assess distinct switching cost fac-
members, in order to receive a discounted calling rate.
                                                                   ets. At the higher level, it offers the parsimony required to
Between 1991 and 1997, MCI gained almost five share
                                                                   efficiently conceptualize and communicate the construct.
points in the long-distance market. In 1995, AT&T
                                                                   Using this typology, we first test a model of switching cost
scrapped its long-standing use of time-varying prices and
                                                                   antecedents. We then examine how different switching
began offering a 10¢ a minute plan for all long-distance
                                                                   costs explain consumers’ intentions to stay with an incum-
calls. Between 1991 and 1997, AT&T lost 18 percent of
                                                                   bent provider. Drawing on the study findings, recommen-
the market it had once dominated. While additional factors
                                                                   dations are presented for managing the factors that
are likely to have influenced these share changes, we sug-
                                                                   influence consumer switching costs and for using switch-
gest that the AT&T pricing change reduced the costs its
                                                                   ing costs, along with customer satisfaction, in programs to
customers faced in comparing alternatives and thus weak-
                                                                   improve customer retention. We conclude with a discus-
ened AT&T’s customer retention. The MCI Friends &
                                                                   sion of the generalizability of the findings and future re-
Family program, on the other hand, increased the time and
                                                                   search directions.
effort investments its customers would lose upon switch-
ing and thus strengthened MCI’s customer retention.
   In the marketing, management, and economics litera-             THE SWITCHING COST CONSTRUCT
ture, a consensus has emerged that switching costs are
prevalent in a wide variety of industrial and consumer con-        Definition of Switching Costs
texts (Fornell 1992; Klemperer 1995). There is evidence
that switching costs have a significant impact on repeat               Porter (1980) suggested that switching costs are “one-
choice behavior (Weiss and Heide 1993), on the strategies          time” costs (p. 10), as opposed to the ongoing costs
managers should (and do) adopt (Eliashberg and Robert-             associated with using a product or provider once a repeat-
son 1988; Karakaya and Stahl 1989), and on the resultant           purchase relationship is established. We define switching
industry and competitive structures (Farrell and Shapiro           costs as the onetime costs that customers associate with
1988). Switching costs have also been associated with              the process of switching from one provider to another.
higher profits (Beggs and Klemperer 1992), with inelastic          While switching costs must be associated with the switch-
response to price (Farrell and Shapiro 1988), with                 ing process, they need not be incurred immediately upon
increased product preannouncements (Eliashberg and                 switching. Furthermore, switching costs need not be lim-
Robertson 1988), and with barriers to market entry and             ited to objective, “economic” costs. When consumers sim-
sustainable strategic advantage (Karakaya and Stahl 1989;          plistically state that “it’s just not worth it” to switch pro-
Schmalensee 1982; Kerin, Varadarajan, and Peterson                 viders, they may perceive impediments ranging from
1992).                                                             “search costs, transaction costs, learning costs, loyal cus-
   Given their importance, it seems natural that firms             tomer discounts, customer habit, emotional cost and cog-
would want to manage their customers’ perceptions of               nitive effort, coupled with financial, social, and psycho-
switching costs. Regrettably, the existence of perceptions         logical risk on the part of the buyer” (Fornell 1992:10).
of switching costs has, by and large, been supported by            These costs are seldom explicitly assessed, but they
anecdotes, logic, and simplistic measures that do not              become salient and evident when consumers are faced
reflect the multidimensional nature of switching costs dis-        with a reason to consider switching.
cussed in the literature. There is little surprise, then, in the
calls for solid empirical research on the switching cost           A Comprehensive View of Switching Costs
construct and its management (Gatignon and Robertson
1992; Klemperer 1995).                                                To effectively manage switching costs, firms must dis-
      The primary objectives of this research are the following:   tinguish and understand the various types of costs that con-
                                                                   sumers perceive. Regrettably, descriptions of switching
      • Discover and empirically validate a typology of con-       cost facets (e.g., Porter 1980; Jackson 1985; Guiltinan
        sumer switching cost perceptions                           1989; Klemperer 1995) have yet to be supported by empir-
Burnham et al. / CONSUMER SWITCHING COSTS        111


                                                                Switching Cost Facet Definitions
ical research, leaving both researchers and practitioners
without accepted frameworks or measurements to draw
                                                                    1. Economic risk costs are the costs of accepting uncer-
on. This is understandable. As Fornell (1992) stated, “A di-
                                                                tainty with the potential for a negative outcome when
rect measure of switching barriers is difficult to obtain” as
                                                                adopting a new provider about which the consumer has
“all costs associated with deserting one supplier in favor of
                                                                insufficient information (Guiltinan 1989; Jackson 1985;
another constitute switching barriers” (p. 11). A review of
                                                                Klemperer 1995; Samuelson and Zeckhauser 1988). Per-
empirical switching cost literature reveals that prior re-
                                                                ceived consumption risk has been conceptualized as a six-
search has typically adopted one of three approaches to
                                                                dimensional construct (Bettman 1973), three of which are
measuring switching costs:
                                                                relevant here: performance risk, financial risk, and conve-
                                                                nience risk.
   • It has measured one or a few switching cost facets
                                                                    2. Evaluation costs are the time and effort costs associ-
     specific to the context of the research, such as a ven-
                                                                ated with the search and analysis needed to make a switch-
     dor’s retraining effort, their process development ef-
                                                                ing decision (Samuelson and Zeckhauser 1988; Shugan
     fort, and their relationship development time (cf.
                                                                1980). Time and effort are associated with collecting the
     Heide and Weiss 1995).
                                                                information needed to evaluate potential alternative pro-
   • It has measured switching costs as a unidimensional
                                                                viders. Mental effort is required to restructure and analyze
     global construct. For example, “How costly would it
                                                                available information in order to arrive at an informed
     be for you to switch suppliers?” (cf. Eliashberg and
                                                                decision (Shugan 1980).
     Robertson 1988; Karakaya and Stahl 1989; Ping
                                                                    3. Learning costs are the time and effort costs of acquir-
     1993).
                                                                ing new skills or know-how in order to use a new product
   • It has assumed that consumers perceive switching
                                                                or service effectively (Alba and Hutchinson 1987; Eliash-
     costs and has ascribed all evidence of differences in
                                                                berg and Robertson 1988; Guiltinan 1989; Wernerfelt
     satisfaction response to such costs (cf. Anderson and
                                                                1985). Learning investments are often provider-specific,
     Sullivan 1993; Fornell 1992; Klemperer 1995).
                                                                meaning new investments must be made to adapt to a new
                                                                provider (Klemperer 1995).
    While each of these approaches may be appropriate for
its context, reliance on them leaves gaps in our understand-        4. Setup costs are the time and effort costs associated
ing of switching costs, their drivers, and their impact on      with the process of initiating a relationship with a new pro-
customer retention. Examining a single facet of a multifac-     vider or setting up a new product for initial use (consider
eted construct is unlikely to produce an adequate assess-       installing and configuring software) (Guiltinan 1989;
ment of the construct or its relationships with other           Klemperer 1995). Setup costs for services are dominated
constructs (Kumar, Stern, and Achrol 1992), while em-           by the information exchange needed for a new provider to
ploying a global measure provides little guidance for man-      reduce its selling risks and understand the customers’ spe-
aging switching cost perceptions and increases measure-         cific needs (Guiltinan 1989).
ment error as it forces respondents to mentally combine             5. Benefit loss costs are the costs associated with con-
multidimensional ratings. Relying on regression inter-          tractual linkages that create economic benefits for staying
cepts to represent switching costs not only combines the        with an incumbent firm (Guiltinan 1989). In switching to a
effects of multiple switching cost types but also confounds     new provider, consumers may lose points they have accu-
switching costs with other possible influences on repeat        mulated and discounts or benefits that are not afforded to
purchase behavior. A more rigorous means for conceptual-        new customers (Guiltinan 1989).
izing and measuring consumer switching costs is needed.             6. Monetary loss costs are the onetime financial outlays
                                                                that are incurred in switching providers other than those
A Switching Cost Typology                                       used to purchase the new product itself (Heide and Weiss
                                                                1995; Jackson 1985; Klemperer 1995; Porter 1980; Weiss
                                                                and Heide 1993). Adopting a new provider often involves
    On the basis of a review of the literature and interviews
                                                                onetime expenditures such as deposits or initiation fees for
with industry managers and consumer focus groups, we
                                                                new customers (Guiltinan 1989). In addition, switching
developed multi-item scales for comprehensively measur-
                                                                products or providers may involve replacing transaction-
ing consumer switching costs. Following accepted scale
                                                                specific assets, or “coassets,” in which the consumer has
development procedures (Anderson and Gerbing 1988;
                                                                invested (Kerin et al. 1992; Weiss and Heide 1993).
Churchill 1979), we found evidence for eight distinct
switching cost facets. The facets are described next; the           7. Personal relationship loss costs are the affective
methodology by which they were derived is presented later       losses associated with breaking the bonds of identification
in the Method and Results section.                              that have been formed with the people with whom the
112      JOURNAL OF THE ACADEMY OF MARKETING SCIENCE                                                                  SPRING 2003


                                                                     SWITCHING COST ANTECEDENTS
                     FIGURE 1
       A Typology of Consumer Perceptions of
                                                                        Prior research suggests a number of strategies for man-
                  Switching Costs
                                                                     aging specific consumer switching costs (e.g., Crosby,
                                                                     Evans, and Cowles 1990; Klemperer 1995). However,
                                                                     these suggestions support a piecemeal approach to switch-
                                                  Relational
   Procedural               Financial
                                                Switching Costs
 Switching Costs          Switching Costs                            ing cost management, raising a number of concerns. First,
                                                                     managing distinct switching costs separately may be less
  • Economic                • Benefit             • Personal
      Risk Costs                                                     effective than managing them simultaneously, as certain
                                Loss Costs            Relationship
  • Evaluation                                        Loss Costs
                            •   Monetary                             antecedents may influence multiple switching costs. Sec-
    Costs
                                                  •   Brand
                                Loss Costs
  • Set Up Costs                                                     ond, without a thorough understanding of switching costs
                                                      Relationship
  • Learning Costs                                    Loss Costs
                                                                     and their antecedents, a firm may fail to recognize when its
                                                                     actions will influence switching costs—as AT&T’s sim-
                                                                     plification of its pricing structure did—and the firm may
                                                                     inadvertently reduce some of its customers’ switching
                                                                     costs. To provide a framework for managing different
                                                                     types of switching costs, we propose hypotheses linking
                                                                     six antecedents with the three major switching cost types
customer interacts (Guiltinan 1989; Klemperer 1995; Por-
                                                                     (see Figure 2).
ter 1980). Consumers’ familiarity with incumbent pro-
vider employees creates a level of comfort that is not
                                                                     Switching Cost Antecedents and Hypotheses
immediately available with a new provider.
   8. Brand relationship loss costs are the affective losses
                                                                        Prior research suggests three groups of consumer-
associated with breaking the bonds of identification that
                                                                     based antecedents of switching costs:
have been formed with the brand or company with which a
customer has associated (Aaker 1992; Porter 1980). Con-
                                                                        • Perceptions of product and market characteristics
sumers often draw meaning from their purchases and form
                                                                          (Gatignon and Robertson 1992)
associations that become part of their sense of identity
                                                                        • Investments with the provider (Jackson 1985)
(McCracken 1986). These brand- or company-based rela-
                                                                        • Domain expertise (Alba and Hutchinson 1987;
tional bonds are lost in switching providers.
                                                                          Klemperer 1987; Wernerfelt 1985).
Switching Cost Types
                                                                        Perceptions of Product and Market Characteristics

                                                                         Product and market characteristics describe the nature
   To provide a more parsimonious typology of switching
                                                                     of the products and providers in an industry. Switching
costs, we investigated the relationships between the eight
                                                                     costs may be generated by product and market characteris-
switching cost facets. Analyses described in the Method
                                                                     tics associated with a slow diffusion of innovations. Two
and Results section suggested that the eight facets could be
                                                                     such characteristics are the complexity of the items being
further organized as three higher-order switching cost
                                                                     considered (Gatignon and Robertson 1992; Klemperer
types (see Figure 1). These were titled as follows:
                                                                     1995) and the heterogeneity of providers in the market
                                                                     (Schmalensee 1982). Since perceptions of these character-
      • Procedural switching costs: Consisting of economic
                                                                     istics vary among consumers within an industry, differ-
        risk, evaluation, learning, and setup costs, this type
                                                                     ences in switching costs occur as well.
        of switching cost primarily involves the expenditure
                             1
                                                                         Product complexity is defined as the extent to which the
        of time and effort.
                                                                     consumer perceives a product to be difficult to understand
      • Financial switching costs: Consisting of benefits loss
                                                                     or use (Rogers 1995). A product that offers a large number
        and financial-loss costs, this type of switching cost
                                                                2
                                                                     of options or that involves a large number of steps in its use
        involves the loss of financially quantifiable resources.
                                                                     will typically be seen as more complex. Consumers are
      • Relational switching costs: Consisting of personal-
                                                                     likely to perceive higher risks when products are more
        relationship loss and brand relationship loss costs,
                                                                     complex because the difficulty in understanding the prod-
        this type of switching cost involves psychological or
                                                                     uct leads to uncertainty, increasing the perception that an
        emotional discomfort due to the loss of identity and
                                                                     unknown negative outcome may occur (Holak and
        the breaking of bonds.
                                                                     Lehmann 1990). Similarly, the larger number of attributes
    In the next section, we investigate the factors that drive       associated with complex products makes both information
consumers’perceptions of these three switching cost types            collection and direct comparisons of attributes more costly
in order to understand how they might be better managed.             (Shugan 1980). A more complex product is also likely to
Burnham et al. / CONSUMER SWITCHING COSTS      113


                                            FIGURE 2
       Consumer Switching Costs and Their Antecedents and Consequences (Theoretical Model)


             Market Characteristics

             • Product Complexity
      H1
                                         +
             • Provider Heterogeneity
      H2                                                 Procedural Switching Costs
                                         +
                                                        • Economic Risk Costs
                                                        • Evaluation Costs
             Consumer Investments
                                                        • Learning Costs
             • Breadth of Use                           • Set-Up Costs
      H3                                                                                             H8
                                         +                                                                        Intention to Stay
                                                                                                              with Incumbent Provider
             • Extent of Modification
      H4
                                                                                                     +
                                                         Financial Switching Costs
                                         +

                                                        • Benefit Loss Costs
               Domain E xpertise                                                                     H9
                                                        • Monetary Loss Costs
             • Alternative Experience
      H5                                 _                                                           _
                                                                                                                           +
                                                                                                                     H7
                                                        • Relational Switching   Costs
             • Switching Experience
     H6                                  _
                                                        • Personal Relationship Loss Costs                         Satisfaction
                                                        • Brand Relationship Loss Costs
           Individual-Level Covariates

             • Time Pressure
             • Risk Aversion


involve a larger number of learned skills or scripts that               which knowledge concerning one provider is applicable to
must be relearned in order to switch providers (Wernerfelt              another provider (Schmalensee 1982), increasing the un-
1985). Finally, complex products are not “easy to try” (Holak           certainty and the “cost of thinking” associated with
and Lehmann 1990:63); thus, as complexity increases, the                switching providers (Shugan 1980). Similarly, the lack of
efforts required to establish a new relationship will rise. In          standardization implied by heterogeneity suggests that
sum, when consumers perceive products as more complex,                  skills learned for use with one provider may not be appli-
they perceive higher procedural switching costs.                        cable with another (Alba and Hutchinson 1987). Hetero-
                                                                        geneity perceptions may also imply loyalty points or
    Product complexity is also likely to lead to higher
                                                                        reduced prices cannot be transferred across providers
financial switching cost perceptions, as a common source
                                                                        (Klemperer 1987, 1995). Finally, to the extent organiza-
of perceived product complexity is a complex price struc-
                                                                        tions are seen as different and unique, consumers perceive
ture. In the cellular telephone market, the “product” might
                                                                        stronger bonds of identification with them (Bhattacharya,
consist of the cell phone itself, the number of minutes
                                                                        Rao, and Glynn 1995).
available during the business day, the number of minutes
available on the weekend, the geographic area in which a
                                                                          Hypothesis 2: Greater perceived provider heterogeneity
call can be received or placed without additional fees, and
                                                                             will be associated with higher procedural, financial,
other services such as voice mail and phone insurance. This
                                                                             and relational switching costs.
complexity can lead consumers to perceive that switching
to a new offering will involve the outlay of additional funds
                                                                            Investments With the Provider
or forfeiture of previously made down payments, start-up
fees, or investments in provider-specific assets.
                                                                            Investments in relationships tie the members together;
    Finally, when products are perceived as more complex,               if the relationship is terminated, the investments are lost
consumers rely more on relationships with brands and                    (Dwyer, Schurr, and Oh 1987; Morgan and Hunt 1994;
people to ensure that they receive a quality product and to             Klemperer 1995). The potential for such loss makes
simplify choices (Sheth and Parvatiyar 1995).                           investments an important driver of switching costs (Jack-
                                                                        son 1985). Consumers invest in a provider when they use
 Hypothesis 1: Greater perceived product complexity will
                                                                        more of the provider’s different products (Blattberg and
    be associated with higher procedural, financial, and
                                                                        Deighton 1996) and when they modify the products they
    relational switching costs.
                                                                        receive from the provider (Bhardawaj, Varadarajan, and
                                                                        Fahy 1993; Robinson 1988).
    Provider heterogeneity is defined as the extent to which
the providers in a market are seen as different or nonsub-                Breadth of use of a provider is defined as the extent to
stitutable. Provider heterogeneity reduces the extent to                which the consumer employs a variety of product types,
114   JOURNAL OF THE ACADEMY OF MARKETING SCIENCE                                                                SPRING 2003


features, and functions offered by a provider (Ram and           greater communication with the provider or interaction
Jung 1990). Blattberg and Deighton (1996) suggested that         with the product. The interaction and the resultant match-
the degree to which a customer buys complements and              ing between the consumers’ needs and the product pro-
supplements to the core product determines the intrinsic         vided lead to higher personal and brand identification
retainability of the customer. Insurance customers, for          (McCracken 1986), thus creating higher relationship loss
example, often purchase life, health, home, and auto insur-      costs.
ance from a single company. Grocery store customers may
                                                                  Hypothesis 4: Greater modification of the incumbent
take advantage of delis, pharmacies, delivery services,
                                                                     product will be associated with higher procedural,
video rental services, and store discount cards in addition
                                                                     financial, and relational switching costs.
to buying basic groceries. Given the time and effort sav-
ings that a “full-line producer” offers, consumers are likely
                                                                    Domain Expertise
to switch either all the products associated with a given
provider or none of them (Klemperer 1995). The prospect             Expertise in a product domain allows consumers to
of switching multiple products increases the risks associ-       more rapidly and accurately evaluate options and learn
ated with switching providers—not only one product is at         new product-related information (Alba and Hutchinson
risk of performance, financial, or convenience failure but       1987). Consumers gain domain expertise when they
multiple, often interdependent products are placed in jeop-      increase their product-related experiences (Park,
ardy at once. Furthermore, when considering switching            Mothersbaugh, and Feick 1994). Two types of domain-
providers, consumers who use more products need to com-          level product experience are the breadth of the consumer’s
pare alternative providers on a greater number of attributes     prior experience with an alternative provider (Fornell
(Shugan 1980), they need to set up a greater number of new       1992; Klemperer 1987) and the extent of the consumer’s
products or features, and they need to invest in learning        switching experience (Nilssen 1992).
how to use a greater number of new products or features             Alternative experience is defined as the breadth of ex-
(Schmalensee 1982).                                              perience the consumer has with the various products, fea-
   In addition to generating procedural costs, using more        tures, and functions offered by a competing service
linked products or services is also likely to increase the fi-   provider. Broad experience with an alternative provider
nancial costs of switching. The greater the breadth of prod-     leads to increased expertise with the service, which re-
ucts employed, the more likely the customer has                  duces the uncertainty associated with using a new pro-
accumulated benefits that will be lost in switching (con-        vider. Greater expertise is also associated with more well-
sider the multiproduct discounts offered insurance cus-          developed mental structures (Alba and Hutchinson 1987).
                                                                 These structures make encoding and retrieving the infor-
tomers), and the more likely that one of the products or
                                                                 mation needed to evaluate new products easier and facili-
services will be associated with a new monetary outlay in
                                                                 tate new learning (Alba and Hutchinson 1987). Broad
switching. Finally, establishing multiple links with a pro-
                                                                 experience with an alternative provider is also likely to re-
vider requires greater interaction with the provider. This
                                                                 duce perceptions of uniqueness of an existing provider,
increased personal interaction leads to higher personal and
                                                                 leading to weaker relational bonds with the provider
brand identification with the provider (McCracken 1986)
                                                                 (Bhattacharya et al. 1995).
and thus to stronger personal and brand relationship bonds
with the providers of the service.
                                                                  Hypothesis 5: Greater prior experience with alternative
                                                                     providers will be associated with lower procedural
 Hypothesis 3: Greater breadth of incumbent provider use
                                                                     and relational switching costs.
    will be associated with higher procedural, financial,
    and relational switching costs.
                                                                    Switching experience is defined as the extent to which
    Modification of a product is defined as the extent to        the consumer has switched between providers in the past.
which the consumer adapts the product offered so that it         Increased switching reduces switching costs by increasing
better serves his or her individual needs. For example,          the consumer’s familiarity with the process of both switch-
MCI customers “build” Friends & Family calling circles           ing and learning to use new providers (Nilssen 1992).
and program fast-dial codes for their calling cards.             Switching experience also implies a reduced duration with
Citibank customers have personal photographs embedded            the incumbent provider, which means there has been less
in their credit cards and arrange cross-service airline mile-    time to accumulate benefits that might be lost in switching.
age credits. Such modifications must be replicated upon          Furthermore, consumers who have switched more have
switching providers (Bhardawaj et al. 1993). Similarly,          had less time with their current provider to develop brand
benefits such as frequent-flyer miles or other points ac-        and personal relationship bonds, and they are less likely to
quired through modification with the current provider will       perceive their provider relationship as unique (Bhatta-
be lost upon switching. Finally, modification requires           charya et al. 1995).
Burnham et al. / CONSUMER SWITCHING COSTS        115


 Hypothesis 6: Greater switching experience will be asso-      stay with the provider. Put simply, switching costs are dis-
    ciated with lower procedural, financial, and rela-         utilities that consumers would rather not incur. While prior
    tional switching costs.                                    research has not studied the effects of different switching
                                                               cost types, evidence of direct switching cost effects has been
   Individual Characteristics
                                                               accumulating at the industry level and at the global switch-
   Individual consumer characteristics are also likely to      ing cost level (Anderson and Sullivan 1993; Bansal and
influence the extent to which switching costs are per-         Taylor 1999; Weiss and Heide 1993). Consistent with these
ceived. Two individual-level characteristics associated        efforts but offering more specificity in our description of
with switching cost perceptions are the consumers’level of     switching costs, we propose the following direct relation-
time pressure and their level of risk aversion (Jackson        ship between switching costs and customer intentions:
1985). These two antecedents were measured and
included as covariates; no formal hypotheses regarding          Hypothesis 8: Greater (a) procedural, (b) financial, and
                                                                   (c) relational switching costs will be associated with
their effects are offered.
                                                                   higher consumer intentions to stay with an incum-
   To summarize, the antecedent model suggests that
                                                                   bent provider.
greater perceptions of complexity and heterogeneity,
increased breadth of incumbent provider use, and greater
                                                                   Researchers have also suggested that switching costs
product modification will generally be associated with
                                                               and satisfaction may negatively interact with each other in
higher switching costs, while increased experience with an
                                                               driving customer intentions (Jones and Sasser 1995;
alternative provider and increased experience with switch-
                                                               Jones, Mothersbaugh, and Beatty 2000; Oliva, Oliver, and
ing will generally be associated with lower switching costs
                                                               MacMillan 1992). As switching costs rise, the influence of
(see Figure 2).
                                                               satisfaction on intentions to stay with a provider may de-
                                                               crease (and vice versa). Oliver (1999) suggested that “sat-
SWITCHING COST CONSEQUENCES                                    isfaction is a necessary step in loyalty formation but
                                                               becomes less significant as loyalty begins to set through
   The driving force behind managerial interest in switch-     other mechanisms,” including “social bonding at the insti-
ing costs is the premise that these costs impede customer      tutional and personal level” (p. 33). Using a global mea-
switching and hence improve customer retention. While          sure of switching costs, Jones et al. (2000) found evidence
an ample body of research discusses this relationship,         of this negative interaction effect. Consistent with these ef-
empirical evidence is scant; little is known about the role    forts, we propose the following moderating effect for each
that different switching costs play in aiding customer         of the three major switching cost types:
retention. A study of the effects of different types of con-
sumer switching costs not only strengthens the                  Hypothesis 9: The relationship between satisfaction and
nomological network for the construct and the typology             consumer intentions to stay with an incumbent pro-
(Gerbing and Anderson 1988) but also provides insights             vider will be weaker (stronger) when consumers
                                                                   perceive higher (lower) (a) procedural switching
about the utility of switching costs as a managerial tool.
                                                                   costs, (b) financial switching costs, and (c) rela-
Our study of switching cost effects builds on current
                                                                   tional switching costs.
research that focuses on satisfaction as the primary driver
of customer retention.
                                                               METHOD AND RESULTS
The Drivers of Customer Retention
                                                               Measuring and Organizing Switching Costs
   While the role of satisfaction in retaining customers is
now perceived as more complex than initially thought
                                                                  Drawing on interviews with long-distance, local tele-
(Mittal and Kamakura 2001; Oliver 1999), abundant evi-
                                                               phone service, and insurance industry managers; two con-
dence supports the commonsense expectation that satis-
                                                               sumer focus groups; and the switching cost literature, a
fied customers are more likely to stay with their existing
                                                               comprehensive list of the potential losses faced by con-
providers than are dissatisfied customers (cf. Oliver 1997;
                                                               sumers when switching providers was compiled. Items for
Szymanski and Henard 2001).
                                                               each switching cost were developed or borrowed from pre-
                                                               vious research and modified. Based on an expert survey in
 Hypothesis 7: Greater satisfaction will be associated
                                                               which 20 managers rated the presence of different switch-
    with higher intentions to stay with an incumbent
    provider.                                                  ing costs and the level of competition for customers in 15
                                                               different consumer industries, two industries were identi-
   To the extent consumers perceive switching costs or         fied for further study. The credit card industry and the long-
barriers to leaving a provider, they should be inclined to     distance industry were selected as being representative of
116   JOURNAL OF THE ACADEMY OF MARKETING SCIENCE                                                                 SPRING 2003


business domains in which the providers’battle to improve       relationship loss switching costs. Correlations between
customer retention could greatly benefit from switching         these constructs are provided in part A of Table 1.
cost management—industries in which a wide array of                  The more parsimonious structure was derived by first
switching cost perceptions should exist even though it is       submitting composite measures for the eight constructs to
relatively easy for consumers to switch providers. A pre-       a varimax-rotated exploratory factor analysis. The results
test survey was conducted using a convenience sample of         suggested three higher order switching cost types. The
120 nonacademic employees of a large southwestern uni-          three-factor model was then tested using a second-order
versity. A strict definition of switching was provided to       CFA, modeling the flow of the 30 original switching cost
ensure consistent interpretation: respondents were asked        items through the eight first-order constructs. This model
                                                                fit the data well: χ2396 = 769, CFI = .98, NFI = .97, RMSEA
to consider dropping their previously identified primary
service provider in order to adopt a new provider. Respon-      = .056. A CFA for this higher order model was then evalu-
dents rated their perceptions of the costs involved in          ated in comparison with higher order models with
switching using 5-point Likert-type scales. Scales for the      dimensionalities both above and below that of the pro-
switching costs, the antecedents, satisfaction, and con-        posed model. A change in chi-square comparison of alter-
sumer intentions were then refined using exploratory fac-       native, nested covariance models confirmed that the three-
tor analysis, Cronbach’s alpha, and confirmatory factor         factor higher order model fit the data significantly better
analyses (CFAs) (Anderson and Gerbing 1988; Churchill           than the best two-factor higher order model (∆χ2 2 = 34, p <
1979).                                                          .01) and did not fit significantly worse than the best four-
                                                                factor higher order model (∆χ2 2 = 4.8, p > .05). Given the
    The final survey was then distributed to 287 credit card
consumers and 288 long-distance consumers. The sample           virtue of parsimony, these findings support using a three-
included members of a local civic organization, employees       factor model to conceptualize consumer switching costs.
of two national firms, members of a local church organiza-      The validity of pooling at this level was also tested using
tion, and employees of a large state university. One hun-       multigroup methods—pooling of the two industries did
dred fifty-eight completed credit card surveys were             not result in a significant degradation of model fit. Load-
returned (53%), constituting the sample for the credit card     ings of the lower order factors are provided in part B of
study. Of the long-distance surveys distributed, 144 sur-       Table 1, and correlations among the higher order factors
veys were returned (50%) and were usable.                       are provided in part C of Table 1.
    Using CFA (AMOS 4.01) (Arbuckle and Wothke                       Using the criteria set forth by Fornell and Larcker
1999), a measurement model incorporating the eight              (1981) to test for discriminant validity, the average vari-
switching cost facets described earlier was found to fit the    ance extracted for the items of each of the three switching
data well (long distance: χ2 377 = 596, Comparative Fit         cost types was found to be greater than the squared correla-
Index [CFI] = .98, Normed Fit Index [NFI] = .95, root           tions for all pairs of factors (see part D of Table 1). Thus,
mean square error of approximation [RMSEA] = .064;              the three higher order factors are discriminant. In addition,
credit card: χ2 377 = 711, CFI = .97, NFI = .94, RMSEA =        each pair of the eight lower order switching costs also met
.075). Coefficient alphas for the eight scales in both indus-   these criteria except for brand relationship loss costs and
tries ranged from .68 to .87 (Table A1). To test for the        personal-relationship loss costs. On further inspection,
appropriateness of pooling the data, the measurement            this pair passed for the long-distance data but not for the
model was subjected to multigroup tests constraining all        credit card data. Given the conceptual differences in the
loadings and correlations to be equal across the two indus-     two constructs, both were retained.
try data sets. The degradation in model fit was insignifi-
cant, suggesting a sufficiently consistent model structure      Measuring the Antecedents
across industries to support pooling the data to achieve        and Consequences
more accurate parameter estimation in subsequent analy-
ses (χ2 377 = 710, CFI = .99, NFI = .97, RMSEA = .054).            Scales measuring the antecedent and consequence con-
    Following the methods proposed by Anderson and              structs were developed and tested in the same iterative
Gerbing (1988), convergent and discriminant validity of         manner described above. The final versions of the six ante-
the scales were examined. All items loaded significantly        cedent scales (Table A2) demonstrated good reliability
on their intended constructs, suggesting convergent valid-      (coefficient alphas ranging from .69 to .92) as well as con-
ity (Table A1). Discriminant validity was also supported        vergent and discriminant validity; constricting the correla-
(Anderson and Gerbing 1988). The eight resultant switch-        tion between any two constructs to unity resulted in a sig-
ing cost facets are those described in detail earlier: eco-     nificant degradation in model fit. All construct pairs also
nomic risk, evaluation, learning, set-up, benefits loss,        passed the more stringent criteria proposed by Fornell and
financial loss, personal relationship loss and brand            Larcker (1981) except for one pair in one industry (alternative
Burnham et al. / CONSUMER SWITCHING COSTS            117


                                                   TABLE 1
                           Switching Costs Measurement Model Loadings and Correlations
                                                    Risk     Evaluation    Learning      Set-Up        Benefit       Money     Personal
A. Lower Order Switching Cost Facet Correlations
   Risk                                            1.00
   Evaluation                                       .61***   1.00
   Learning                                         .60***    .49***       1.00
   Set-up                                           .64***    .49***        .56***        1.00
   Benefit                                          .18*      .08           .36***         .25             1.00
   Money                                            .53***    .35***        .48***         .55***           .50***   1.00
   Personal                                         .33***    .06           .36***         .19**            .15*      .23**    1.00
   Brand                                            .16*     –.11           .21**          .07              .07       .08       .65***

                                                              Procedural                          Financial                   Relational
B. Loading of Lower Order Facets on Higher Order Types
   Risk                                                          .85***
   Evaluation                                                    .65***
   Learning                                                      .75***
   Set-up                                                        .76***
   Benefit                                                                                           .51***
   Money                                                                                             .88***
   Personal                                                                                                                      .89***
   Brand                                                                                                                         .87***
C. Higher Order Switching Cost Type Correlation
   Procedural                                                  1.00
   Financial                                                    .69***                              1.00
   Relational                                                   .33***                               .25**                     1.00
D. Fornell-Larcker Criteria for Discriminant Validity for
 Higher Order Switching Costs (Average variance extracted
 on diagonal; squared correlation on off-diagonals)
   Procedural                                                    .87
   Financial                                                     .47                                 .66
   Relational                                                    .11                                 .06                         .87

*p < .05. **p < .01. ***p < .001.


provider experience and switching experience in the credit                 (Hypothesis 2) received mixed support, while our hypoth-
card industry). The six constructs were therefore retained.                esis on the effects of product modification (Hypothesis 4)
A four-item satisfaction scale was used to assess respon-                  was not supported. Finally, although no hypotheses were
dents’ general satisfaction, confirmation of expectations,                 offered regarding the covariates, our results suggest that
and distance from the hypothetical ideal product (Fornell                  risk aversion is significantly related to procedural and rela-
1992). A two-item intentions scale was used to assess con-                 tional switching cost perceptions and that time pressure is
sumers’ intentions to stay with their current service pro-                 significantly related to procedural switching cost percep-
vider. Reliability and convergent validity for these scales                tions. The results also supported the hypothesized effects
were satisfactory (Table A3).                                              of satisfaction on intentions (Hypothesis 7) and the
                                                                           hypothesized effects of the three switching cost types on
                                                                           intentions (Hypothesis 8a-c).
Testing the Structural Model
                                                                              To test for interactions, respondents were split into
                                                                           high, medium, and low groups based on their switching
   The relationships between the constructs were exam-
                                                                           cost perceptions for each of the three types. A structural
ined using structural equation modeling. The results are
                                                                           model linking satisfaction with intentions to stay was then
presented in Tables 2, 3, and 4 and are summarized below;
                                                                           constrained to force equal loadings between the high- and
implications are discussed in the following section.
                                                                           the low-level switching cost groups. None of the three
    The results fully supported our hypotheses on the                      cases exhibited a significant degradation in fit when the
switching cost effects of breadth of product use (Hypothe-                 loadings were constrained. Thus, we did not find support
sis 3), alternative provider experience (Hypothesis 5) and                 for the hypothesized negative interaction between satis-
switching experience (Hypothesis 6). Our hypotheses on                     faction and switching costs (Hypothesis 9).
the effects of complexity (Hypothesis 1) and heterogeneity
118    JOURNAL OF THE ACADEMY OF MARKETING SCIENCE                                                                               SPRING 2003


                                                                                              TABLE 3
                          TABLE 2
                                                                                   Consequences Structural Model:
                Antecedents Structural Model:
                                                                                      Effects on Intent to Stay
                 Effects on Switching Costs
                                                                                                                       SMC of
                         Standardized Estimates
                                                                                                          Standardized Intent
                  Procedural Financial Relational                                                           Estimates to Stay         Conclusion
                     Costs     Costs     Costs          Conclusion
                                                                        Combined model
Hypothesis 1:                                                             Hypothesis 7: Satisfaction          .30***       .31      Supported
  Complexity      .60***        .31***     .05         Mixed support      Hypothesis 8a: Procedural costs .20**                     Supported
Hypothesis 2:                                                             Hypothesis 8b: Financial costs      .15*                  Supported
  Heterogeneity   .12*          .05        .37***      Mixed support      Hypothesis 8c: Relational costs .30***                    Supported
Hypothesis 3:                                                                       2
                                                                        Model fit: χ 1,858 = 3,416, CFI = .97, NFI = .93, p < .000,
  Breadth of use .21***         .30***     .28***      Supported          RMSEA = .053
Hypothesis 4:
  Modification   –.10*          .00        .07         Not supported    Satisfaction only model
Hypothesis 5:                                                             Satisfaction                        .40***       .16
  Alternative                                                                       2
                                                                        Model fit: χ 1,861 = 3,477, CFI = .97, NFI = .93, p < .000,
   experience    –.21***        —         –.16*        Supported          RMSEA = .054
Hypothesis 6:
  Switching                                                             Switching costs only model
   experience    –.31***       –.18*      –.27***      Supported          Procedural costs                    .15*         .30
Risk aversion     .14*          .05        .24**          —               Financial costs                     .13*
Time pressure     .17**         .01       –.06            —               Relational costs                    .44***
SMC of switching                                                                    2
                                                                        Model fit: χ 1,859 = 3,434, CFI = .97, NFI = .93, p < .000,
  cost            .62           .22        .38
                                                                          RMSEA = .053
            2
Model fit: χ 1,858 = 3,416, CFI = .97, NFI = .93, p < .000,             NOTE: SMC = squared multiple correlation; CFI = Comparative Fit In-
 RMSEA = .053                                                           dex; NFI = Normed Fit Index; RMSEA = root mean square error of
                                                                        approximation.
NOTE: Dash (—) indicates that relationship is not hypothesized. SMC =   *p < .05, one-tailed. **p < .01, one-tailed. ***p < .001, one-tailed.
squared multiple correlation; CFI = Comparative Fit Index; NFI =
Normed Fit Index; RMSEA = root mean square error of approximation.                               TABLE 4
*p < .05, one-tailed. **p < .01, one-tailed. ***p < .001, one-tailed.
                                                                                      Interaction Structural Models
                                                                        Switching Cost and              Chi-Square
                                                                        Satisfaction Interaction       Change for
DISCUSSION AND                                                          Model                        Constrained Model    p      Conclusion
MANAGERIAL IMPLICATIONS                                                 Hypothesis 9a:
                                                                         Procedural switching cost      .70, 1 df      p > .10   Not supported
The Consumer Switching Cost Typology                                    Hypothesis 9b: Financial
                                                                         switching cost                 .20, 1 df      p > .10   Not supported
                                                                        Hypothesis 9c:
   This research affords managers a set of tools and a
                                                                         Relational switching cost      .70, 1 df      p > .10   Not supported
framework designed to help conceptualize, measure, and
manage consumer switching costs. The eight-facet
typology developed in this study provides a granular rep-
resentation of consumer switching costs, allowing
                                                                        The Antecedents of Switching Costs
researchers and practitioners to more finely distinguish
different switching cost elements and to consider their                    Procedural Switching Costs
links with other constructs and practices. The more parsi-
                                                                           Our study suggests that consumers’ perceptions of pro-
monious three-factor, higher order switching cost
                                                                        cedural switching costs may be increased by increasing
typology addresses researchers, and practitioners need to
                                                                        their perceptions of product complexity or provider heter-
conceptualize complex constructs more succinctly.
                                                                        ogeneity; by encouraging broader product use; and by
Depending on the demands of the question being pursued,
                                                                        reducing, to the extent possible, their experience with
the appropriate level of the typology can be employed. For
                                                                        switching between, and using, other providers. One tactic
applied managerial decisions or consumer segmentation,
                                                                        for increasing complexity perceptions is educating con-
examination of the specific facets of the eight-facet model
                                                                        sumers about the variety of features a product offers.
is more appropriate. For conceptualizing areas for expand-
                                                                        Long-distance and credit card companies regularly send
ing switching cost research, the higher order model may be
                                                                        inserts with their monthly bills describing new services
more useful.
Burnham et al. / CONSUMER SWITCHING COSTS        119


and additional features of the services that they offer.        bundled products); by offering loyalty programs; and, as
Communications that remind existing customers of the            noted above, by informing customers of the variety of
features that differentiate their provider from competitors     products offered. Adding intangible financial services,
may also increase customers’ procedural switching costs,        such as credit card purchase insurance and payment insur-
reduce their search for alternatives (Heide and Weiss 1995;     ance, should increase perceptions of complexity and
Weiss and Heide 1993), and reduce their intentions to           financial switching costs. Finally, as noted above, a greater
switch.                                                         emphasis on defensive, over offensive, marketing should
                                                                decrease the switching experience of a firm’s customers
    Firms seeking to increase their customers’ switching
                                                                and increase its financial switching costs over time.
costs should also consider bundling products and services.
While past bundling research has focused on firms’ ability         Relational Switching Costs
to maximize sales profits through bundling (e.g.,
                                                                   Customers’relational switching costs may be increased
Stremersch and Tellis 2002; Venkatesh and Mahajan
                                                                by increasing their perceptions of provider heterogeneity,
1993), our results suggest that bundling may increase cus-
                                                                by encouraging broader product use, and by reducing the
tomer retainability by increasing the breadth of product
                                                                alternative provider and switching experience of those
use and perceptions of offering complexity. Furthermore,
                                                                acquired. Suggestions for managing each of these ante-
by creatively bundling their products, providers can differ-
                                                                cedents are offered above. Our results support the long-
entiate their offerings and increase customer perceptions
                                                                standing belief that investments in differentiation
of provider heterogeneity.
                                                                strengthen customers’ bonds of identity with a firm. Fur-
    Finally, firms seeking to increase switching-cost-based
                                                                thermore, as customers use more types of a providers’
retention should target customers with limited experience
                                                                products, they appear to enter a more advanced relation-
and avoid avid switchers as they are likely to switch again
                                                                ship stage in which switching is more costly. Finally, con-
in the future. While firms with more sophisticated tools are
                                                                sumers who have less experience with other providers
able to assess the risks and rewards of attracting likely
                                                                appear to perceive stronger ties to their existing providers.
switchers, all firms can take steps to ensure they attract
                                                                Thus, firms may doubly benefit from discounting cross-
those consumers less likely to switch away in the future.
                                                                sales to existing customers, as they may both increase cur-
For example, a survey or interview can be used to assess
                                                                rent breadth of use and preclude customers’ trial of other
the prior history of potential customers, a tactic easily
                                                                providers’ offerings.
employed by services like gyms or clubs. Alternatively,
customers can be targeted early in their life cycles, a prac-
                                                                Satisfaction and Switching Costs
tice that credit card companies have honed on teens and
                                                                as Drivers of Customer Retention
college students. When potential customers cannot be sur-
veyed or known, firms can de-emphasize customer acqui-
                                                                    Our consequence model confirms that satisfaction
sition programs that heavily reward switching. A greater
                                                                drives consumer intentions to stay with an incumbent ser-
emphasis on the basic value proposition and building the
                                                                vice provider. With satisfaction alone, we explain 16 per-
switching cost perceptions of existing customers (e.g.,
                                                                cent of the variance in consumer intentions, well within
defensive marketing) should lead to slower but more sus-
                                                                the bounds reported as typical by Szymanski and Henard’s
tainable customer growth.
                                                                (2001) meta-analysis of satisfaction studies. Thus, we sup-
    Contrary to expectations, we find a negative relation-
                                                                port the continued emphasis on managing customer
ship between modification and consumers’ procedural
                                                                satisfaction.
switching cost perceptions. Consumers may gain product
                                                                    However, we find that switching costs have an even
domain expertise while modifying their products, which
                                                                stronger effect on customer retention, explaining 30 per-
reduces the procedural costs they associate with switching
                                                                cent of the variance in the consumers’ intentions to stay
(Alba and Hutchinson 1987). Alternatively, customers
                                                                with a current provider. We believe this finding is espe-
who perceive lower procedural switching costs may also
                                                                cially noteworthy given our intentional selection of indus-
perceive lower costs associated with making modifica-
                                                                tries, such as the long-distance industry, that are relatively
tions, leading them to make more modifications. Further
                                                                “fluid”—where perceptions of switching costs exist, but
research is needed to better understand this relationship.
                                                                where they are weak enough that switching is still rela-
   Financial Switching Costs
                                                                tively easy. Given the limited research on switching cost
   Customers’ financial switching cost perceptions may          management, it appears that marketing’s pursuit of the
be increased by augmenting perceptions of product com-          customer satisfaction paradigm has blinded it to the
plexity, by encouraging broader product use, and by reduc-      importance of switching costs, or worse, that the field has
ing the switching experience of those acquired. Firms can       “blacklisted” switching costs as customer harming and
increase the perceived complexity of their offerings via        thus unworthy of study. Yet, even if only “passive loyalty”
mixed price bundling (e.g., offering independent and            is generated by switching costs, such behavioral constraints
120   JOURNAL OF THE ACADEMY OF MARKETING SCIENCE                                                              SPRING 2003


                                                                 maintain customer satisfaction and that they must regu-
can prompt relationship-improving investments by
                                                                 larly monitor switching cost perceptions. The former con-
encouraging voice over exit (Ping 1997). In addition,
                                                                 cern suggests that switching costs must be managed with
switching costs can inhibit consumers from switching
                                                                 an eye toward customer acquisition. While we have
immediately after a dissatisfying incident and thereby cre-
                                                                 emphasized the customer retention applications of our
ate the delay needed to return to higher global satisfaction
                                                                 model, our findings are equally relevant for customer
levels that were perceived before the incident (Bolton and
                                                                 acquisition management. For example, firms need to
Drew 1991). Switching costs, like the commitments of
                                                                 lower potential customers’ perceptions of the complexity
marriage, may make for better relationships over time.
                                                                 of their products in order to reduce the costs associated
    All three switching cost types appear to drive consum-
                                                                 with switching “in.” For years, Microsoft promoted the
ers’ intentions to stay with their current provider. Spe-
                                                                 simplicity of its operating systems by emphasizing the
cifically, increasing current customers’ perceptions of the
                                                                 “Start” button in its advertising. New customers then gen-
risks involved in switching (or the safety of staying), the
                                                                 erated set-up and learning switching costs after they
difficulty of evaluating alternatives (or the ease of not
                                                                 installed and used Microsoft’s system. However, Fornell’s
doing so), the hassles of setting up a new relationship, and
                                                                 concerns do highlight the potential downside of an
the learning required to use a new provider will increase
                                                                 overaggressive use of switching costs. Even if few con-
customers’ likelihood of remaining in an existing relation-
                                                                 sumers undertake the hyperrational future switching cost
ship. Furthermore, increasing the potential of losing bene-
                                                                 assessments presumed by economists (e.g., Beggs and
fits or money (or decreasing the costs of staying—Cannon
                                                                 Klemperer 1992), potential customers may search for
and Homburg 2001) will increase customers’likelihood of
                                                                 ways to avoid relationships with firms imposing obviously
staying, even when no discernable physical assets are
                                                                 burdensome switching costs (such as lock-in contracts),
involved. Finally, increasing the strength of customers’
                                                                 and existing customers may become dissatisfied and seek
psychological bonds with a provider’s brand will increase
                                                                 opportunities to undermine firms that unduly constrict
people’s likelihood of staying, even in industries with very
                                                                 them (Jones and Sasser 1995). Thus, switching costs must
little or no face-to-face contact. Of the three types, we find
                                                                 be managed judiciously, reducing them for potential new
that financial switching costs have the weakest impact—
                                                                 customers and increasing them in ways that add value for
our study suggests that procedural and relational costs
                                                                 existing consumers’ experiences.
loom larger when consumers consider switching. How-
ever, generalizations about the relative strength of the
switching cost effects must be made with care. Switching
                                                                 CONCLUSION AND FUTURE RESEARCH
cost effects are likely to vary across industries as contact
levels, physically linked assets, solicitation methods, and
                                                                    This research makes three primary contributions to
other product and/or market factors vary.
                                                                 marketing research. First, it provides a typology of the
   We find no evidence for interactions between switching        switching costs that consumers perceive as well as vali-
costs and satisfaction. This suggests that switching costs       dated scales for measuring those costs. We find consistent
remain a valuable tool for fighting the surprisingly preva-      evidence for eight distinct consumer switching costs: eco-
lent loss of satisfied customers (Jones and Sasser 1995).        nomic risk costs, evaluation costs, learning costs, set-up
Clearly, firms have strong incentives to ensure that both        costs, benefit loss costs, monetary loss costs, personal-
satisfaction and switching cost management are well              relationship loss costs, and brand relationship loss costs.
tended. In addition, both ethical and practical consider-        These eight switching costs comprise three higher order
ations suggest that firms should seek to increase switching      switching cost types: procedural, financial, and relational
costs in ways that add value to consumers. By helping cus-       switching costs. Given the breadth of the literature from
tomers learn how to better use the product, by identifying       which the typology is drawn, its consistency across the
unique features offered, by offering valuable bonus points       industries studied, and its parsimonious nature, we believe
or loyalty services, and by engaging customers in a more         that the typology should provide a solid foundation for
meaningful relationship, firms should seek to simulta-           conceptualizing the nature of switching costs for con-
neously raise customer switching costs and improve cus-          sumer products (goods and services). We encourage future
tomer satisfaction.                                              research employing our scales to build on our understand-
   In managing consumers’ perceived switching costs,             ing by exploring its application in new contexts. While the
strategists are reminded of two potential problems associ-       scales may need to be adapted to suit specific contexts,
ated with relying on barriers to exit (Fornell 1992): (1) cus-   perceptions of the three major switching cost types should
tomer awareness of switching costs may impede customer           be found whenever switching is clearly defined. It is
acquisition, and (2) switching costs may be neutralized or       important to note, however, that with many products (and
eliminated by external forces. The latter concern merely         especially discontinuous products), consumers can try
suggests that firms should not drop their efforts to             new offerings without fully switching to them. When this
Burnham et al. / CONSUMER SWITCHING COSTS      121


is the case, some of the costs associated with using a new       moderators of the relationships studied will enhance the
offering will be lower or nonexistent, and the term switch-      managerial application of switching costs. For example,
ing costs may be inappropriate. It is left to future research-   the effects of breadth of product use may depend on the
ers to fully distinguish the appropriate contexts for using      complementarities between the products purchased from a
the terms switching costs, adoption costs, and trial costs       single provider and on the physical compatibility between
and to identify any differences in the types of costs per-       assets used with different providers. Similarly, the effects
ceived in each context.                                          of prior experiences may depend on the valence of a con-
    Second, this research provides a theoretical framework       sumer’s experiences with other providers and the switch-
of the antecedents that drive consumer switching cost per-       ing process and even on the consumer’s switching experi-
ceptions. We find that three categories of antecedents—          ences in contexts outside of the focal product domain. A
market characteristics, consumer investments, and domain         longitudinal study could offer insights into how switching
expertise—can significantly influence the switching costs        cost perceptions, switching experiences, and (behavioral)
that consumers perceive. These findings concord with, and        loyalty change and affect each other over time. In addition,
expand upon, prior switching cost antecedent research            switching costs’ effects on intentions to stay may depend
(e.g., Alba and Hutchinson 1987; Jackson 1985;                   on the context in which switching is considered; receiving
Samuelson and Zeckhauser 1988) and provide managers              a financial offer from a competitor may make salient dif-
with a broad theoretical basis for designing specific            ferent switching costs than enduring a problem with an
switching cost management programs.                              existing provider. Switching costs’ effects may also
    Third, this research adds to recent research on switch-      depend on such industry characteristics as product usage
ing cost consequences (e.g., Bansal and Taylor 1999;             and solicitation norms. Finally, research on the relation-
Jones et al. 2000) by finding significant effects for three      ship between switching costs and satisfaction could assess
types of consumer switching costs. Even within industries        whether, or when, switching costs lead to dissatisfaction.
where objective switching costs are low, we find that the        While both self-perception theory and cognitive disso-
level and types of costs that consumers associate with           nance theory suggest that consumers who are “stuck” in a
switching explain their intentions better than their satisfac-   behavior will defend the behavior and view themselves as
tion does. While this does not suggest that firms should         satisfied, a dissatisfied customer who can attribute being
abandon the pursuit of customer satisfaction, it does high-      stuck to a firm’s actions will certainly feel even more dis-
light the need to understand, measure, and manage switch-        satisfied. But can switching costs independently lead to
ing cost perceptions.                                            dissatisfaction? Studies providing answers to such ques-
    Many interesting switching cost management ques-             tions will extend our ability to manage the dynamic, con-
tions await future researchers. Additional research on the       textual effects of consumer switching costs.
122     JOURNAL OF THE ACADEMY OF MARKETING SCIENCE                                                                               SPRING 2003


                                                       APPENDIX
                                                       TABLE A1
                    Switching Cost Scale Items, Loadings, Reliabilities, Means, and Standard Deviations

                                                           Standardized
                                                           Item Loading      Coefficient Alpha           Mean            Standard Deviation
                                                       Long-        Credit    Long-     Credit    Long-         Credit    Long-      Credit
Scale                                                 Distance      Card     Distance   Card     Distance       Card     Distance    Card
Economic Risk Costs                                                            .85        .87     3.37          3.02       0.81       0.94
  I worry that the service offered by other service
      providers won’t work as well as expected.            .72       .69
  If I try to switch service providers, I might
      end up with bad service for a while.                 .60       .72
  Switching to a new service provider will
      probably involve hidden costs/charges.               .75       .73
  I am likely to end up with a bad deal financially
      if I switch to a new service provider.               .74       .72
  Switching to a new service provider will
      probably result in some unexpected hassle.           .74       .78
  I don’t know what I’ll end up having to deal
      with while switching to a new service provider.      .70       .80
Evaluation Costs                                                               .80        .83     3.55          3.26       0.84       0.98
  I cannot afford the time to get the information
      to fully evaluate other service providers.           .68       .79
  How much time/effort does it take to get the
       information you need to feel comfortable
      evaluating new service providers?
      (very little . . . a lot)                            .65       .72
  Comparing the benefits of my service provider
      with the benefits of other service providers
      takes too much time/effort, even when I have
      the information.                                     .66       .69
  It is tough to compare the other service providers.      .87       .78
Learning Costs                                                                 .85        .85     2.93          2.88       0.91       0.94
  Learning to use the features offered by a new
      service provider as well as I use my service
      would take time.                                     .68       .78
  There is not much involved in understanding
      a new service provider well. (r)                     .77       .69
  Even after switching, it would take effort to
      “get up to speed” with a new service.                .79       .81
  Getting used to how another service provider
      works would be easy. (r)                             .84       .79
Set-Up Costs                                                                   .74        .80     3.13          3.04       0.85       0.97
  It takes time to go through the steps of switching
      to a new service provider.                           .64       .67
  Switching service providers involves an
      unpleasant sales process.                            .61       .80
  The process of starting up with a new service
      is quick/easy. (r)                                   .70       .77
  There are a lot of formalities involved in
      switching to a new service provider.                 .68       .79
Benefit Loss Costs                                                             .81        .76     2.50          2.84       1.15       1.28
  Switching to a new service provider would mean
      losing or replacing points, credits, services, and
      so on that I have accumulated with my service
      provider.                                            .74       .71
  How much would you lose in credits, accumulated
      points, services you have already paid for, and
      so on if you switched to a new service provider?
      (lose nothing . . . lose a lot)                      .89       .90
  I will lose benefits of being a long-term customer
      if I leave my service provider.                      .70       .58
Monetary Loss Costs                                                            .72        .71     2.58          2.41       0.98       1.01
  Switching to a new service provider would
      involve some up-front costs (set-up fees,
      membership fees, deposits, etc.).                    .68       .67
art. 4 (Y. Polo)
art. 4 (Y. Polo)
art. 4 (Y. Polo)
art. 4 (Y. Polo)

Mais conteúdo relacionado

Destaque

International Journal of Business and Management Invention (IJBMI)
International Journal of Business and Management Invention (IJBMI)International Journal of Business and Management Invention (IJBMI)
International Journal of Business and Management Invention (IJBMI)inventionjournals
 
International Journal of Engineering Research and Development (IJERD)
International Journal of Engineering Research and Development (IJERD)International Journal of Engineering Research and Development (IJERD)
International Journal of Engineering Research and Development (IJERD)IJERD Editor
 
Welcome to International Journal of Engineering Research and Development (IJERD)
Welcome to International Journal of Engineering Research and Development (IJERD)Welcome to International Journal of Engineering Research and Development (IJERD)
Welcome to International Journal of Engineering Research and Development (IJERD)IJERD Editor
 
International Journal of Engineering Research and Development
International Journal of Engineering Research and DevelopmentInternational Journal of Engineering Research and Development
International Journal of Engineering Research and DevelopmentIJERD Editor
 
7 qct optmisation in new product development detailed study on inter-links ...
7 qct optmisation in new product development   detailed study on inter-links ...7 qct optmisation in new product development   detailed study on inter-links ...
7 qct optmisation in new product development detailed study on inter-links ...prjpublications
 

Destaque (7)

8
88
8
 
E080104650
E080104650E080104650
E080104650
 
International Journal of Business and Management Invention (IJBMI)
International Journal of Business and Management Invention (IJBMI)International Journal of Business and Management Invention (IJBMI)
International Journal of Business and Management Invention (IJBMI)
 
International Journal of Engineering Research and Development (IJERD)
International Journal of Engineering Research and Development (IJERD)International Journal of Engineering Research and Development (IJERD)
International Journal of Engineering Research and Development (IJERD)
 
Welcome to International Journal of Engineering Research and Development (IJERD)
Welcome to International Journal of Engineering Research and Development (IJERD)Welcome to International Journal of Engineering Research and Development (IJERD)
Welcome to International Journal of Engineering Research and Development (IJERD)
 
International Journal of Engineering Research and Development
International Journal of Engineering Research and DevelopmentInternational Journal of Engineering Research and Development
International Journal of Engineering Research and Development
 
7 qct optmisation in new product development detailed study on inter-links ...
7 qct optmisation in new product development   detailed study on inter-links ...7 qct optmisation in new product development   detailed study on inter-links ...
7 qct optmisation in new product development detailed study on inter-links ...
 

Semelhante a art. 4 (Y. Polo)

Acceptable%2 b quality%2blevels%2bin%2bthe%2btextile%2bsector%2band%2btheir%2...
Acceptable%2 b quality%2blevels%2bin%2bthe%2btextile%2bsector%2band%2btheir%2...Acceptable%2 b quality%2blevels%2bin%2bthe%2btextile%2bsector%2band%2btheir%2...
Acceptable%2 b quality%2blevels%2bin%2bthe%2btextile%2bsector%2band%2btheir%2...Mohammad Akhtar
 
Customer Centricity Axisof High Performance May2008
Customer Centricity Axisof High Performance May2008Customer Centricity Axisof High Performance May2008
Customer Centricity Axisof High Performance May2008Anil Kumar
 
Factors determining the customer satisfaction & loyalty a study of mobile tel...
Factors determining the customer satisfaction & loyalty a study of mobile tel...Factors determining the customer satisfaction & loyalty a study of mobile tel...
Factors determining the customer satisfaction & loyalty a study of mobile tel...Cuong Dinh
 
Why customer value propositions really matter - A focus on the telecom servic...
Why customer value propositions really matter - A focus on the telecom servic...Why customer value propositions really matter - A focus on the telecom servic...
Why customer value propositions really matter - A focus on the telecom servic...Juan Carlos Sanchez
 
White Paper Benchmark
White Paper BenchmarkWhite Paper Benchmark
White Paper BenchmarkDreid16
 
Yönetim Ansiklopedisi - Segmentasyon
Yönetim Ansiklopedisi - SegmentasyonYönetim Ansiklopedisi - Segmentasyon
Yönetim Ansiklopedisi - SegmentasyonCRM Institute
 
Leveraging Advanced Analytics to Drive Customer Behavior in the Airline Industry
Leveraging Advanced Analytics to Drive Customer Behavior in the Airline IndustryLeveraging Advanced Analytics to Drive Customer Behavior in the Airline Industry
Leveraging Advanced Analytics to Drive Customer Behavior in the Airline IndustryCognizant
 
Empirical Research: Supply Chain and BYOD – Hand in Hand for the Future
Empirical Research: Supply Chain and BYOD – Hand in Hand for the FutureEmpirical Research: Supply Chain and BYOD – Hand in Hand for the Future
Empirical Research: Supply Chain and BYOD – Hand in Hand for the FutureRahul Bansal
 
American Marketing Association is collaborating with JSTOR t.docx
  American Marketing Association is collaborating with JSTOR t.docx  American Marketing Association is collaborating with JSTOR t.docx
American Marketing Association is collaborating with JSTOR t.docxjoyjonna282
 
Impact of Perceived Severity and Controllability of Service Failures on Expec...
Impact of Perceived Severity and Controllability of Service Failures on Expec...Impact of Perceived Severity and Controllability of Service Failures on Expec...
Impact of Perceived Severity and Controllability of Service Failures on Expec...iosrjce
 
'Proceeding 23-20-3924
'Proceeding 23-20-3924'Proceeding 23-20-3924
'Proceeding 23-20-3924rizki_janti
 
Variable costs
Variable costsVariable costs
Variable costssampath316
 
Etude annuelle Aéronautique & Défense "Programmes under pressure" (2011)
Etude annuelle Aéronautique & Défense "Programmes under pressure" (2011)Etude annuelle Aéronautique & Défense "Programmes under pressure" (2011)
Etude annuelle Aéronautique & Défense "Programmes under pressure" (2011)PwC France
 
Accenture 2009 Global Consumer Satisfaction Report
Accenture 2009 Global Consumer Satisfaction ReportAccenture 2009 Global Consumer Satisfaction Report
Accenture 2009 Global Consumer Satisfaction ReportTRG
 

Semelhante a art. 4 (Y. Polo) (20)

32605215
3260521532605215
32605215
 
Acceptable%2 b quality%2blevels%2bin%2bthe%2btextile%2bsector%2band%2btheir%2...
Acceptable%2 b quality%2blevels%2bin%2bthe%2btextile%2bsector%2band%2btheir%2...Acceptable%2 b quality%2blevels%2bin%2bthe%2btextile%2bsector%2band%2btheir%2...
Acceptable%2 b quality%2blevels%2bin%2bthe%2btextile%2bsector%2band%2btheir%2...
 
Customer Centricity Axisof High Performance May2008
Customer Centricity Axisof High Performance May2008Customer Centricity Axisof High Performance May2008
Customer Centricity Axisof High Performance May2008
 
Factsheet bpo 201108_v1
Factsheet bpo 201108_v1Factsheet bpo 201108_v1
Factsheet bpo 201108_v1
 
Factors determining the customer satisfaction & loyalty a study of mobile tel...
Factors determining the customer satisfaction & loyalty a study of mobile tel...Factors determining the customer satisfaction & loyalty a study of mobile tel...
Factors determining the customer satisfaction & loyalty a study of mobile tel...
 
Why customer value propositions really matter - A focus on the telecom servic...
Why customer value propositions really matter - A focus on the telecom servic...Why customer value propositions really matter - A focus on the telecom servic...
Why customer value propositions really matter - A focus on the telecom servic...
 
White Paper Benchmark
White Paper BenchmarkWhite Paper Benchmark
White Paper Benchmark
 
Yönetim Ansiklopedisi - Segmentasyon
Yönetim Ansiklopedisi - SegmentasyonYönetim Ansiklopedisi - Segmentasyon
Yönetim Ansiklopedisi - Segmentasyon
 
Leveraging Advanced Analytics to Drive Customer Behavior in the Airline Industry
Leveraging Advanced Analytics to Drive Customer Behavior in the Airline IndustryLeveraging Advanced Analytics to Drive Customer Behavior in the Airline Industry
Leveraging Advanced Analytics to Drive Customer Behavior in the Airline Industry
 
Empirical Research: Supply Chain and BYOD – Hand in Hand for the Future
Empirical Research: Supply Chain and BYOD – Hand in Hand for the FutureEmpirical Research: Supply Chain and BYOD – Hand in Hand for the Future
Empirical Research: Supply Chain and BYOD – Hand in Hand for the Future
 
05301414
0530141405301414
05301414
 
Data Insight Action
Data Insight ActionData Insight Action
Data Insight Action
 
3[1]
3[1]3[1]
3[1]
 
American Marketing Association is collaborating with JSTOR t.docx
  American Marketing Association is collaborating with JSTOR t.docx  American Marketing Association is collaborating with JSTOR t.docx
American Marketing Association is collaborating with JSTOR t.docx
 
Impact of Perceived Severity and Controllability of Service Failures on Expec...
Impact of Perceived Severity and Controllability of Service Failures on Expec...Impact of Perceived Severity and Controllability of Service Failures on Expec...
Impact of Perceived Severity and Controllability of Service Failures on Expec...
 
'Proceeding 23-20-3924
'Proceeding 23-20-3924'Proceeding 23-20-3924
'Proceeding 23-20-3924
 
Variable costs
Variable costsVariable costs
Variable costs
 
Role of Analytics in Customer Management
Role of Analytics in Customer ManagementRole of Analytics in Customer Management
Role of Analytics in Customer Management
 
Etude annuelle Aéronautique & Défense "Programmes under pressure" (2011)
Etude annuelle Aéronautique & Défense "Programmes under pressure" (2011)Etude annuelle Aéronautique & Défense "Programmes under pressure" (2011)
Etude annuelle Aéronautique & Défense "Programmes under pressure" (2011)
 
Accenture 2009 Global Consumer Satisfaction Report
Accenture 2009 Global Consumer Satisfaction ReportAccenture 2009 Global Consumer Satisfaction Report
Accenture 2009 Global Consumer Satisfaction Report
 

Mais de midiaz

Revista Utopía_Entrevista San Carlos Borromeo
Revista Utopía_Entrevista San Carlos BorromeoRevista Utopía_Entrevista San Carlos Borromeo
Revista Utopía_Entrevista San Carlos Borromeomidiaz
 
Teoría de juegos
Teoría de juegosTeoría de juegos
Teoría de juegosmidiaz
 
art. 5 (en español, por Vicente Salas)
art. 5 (en español, por Vicente Salas)art. 5 (en español, por Vicente Salas)
art. 5 (en español, por Vicente Salas)midiaz
 
Las cuatro velas
Las cuatro velasLas cuatro velas
Las cuatro velasmidiaz
 
art. 3 (Yolanda Polo)
art. 3 (Yolanda Polo)art. 3 (Yolanda Polo)
art. 3 (Yolanda Polo)midiaz
 
art. 5 (Peer Pressure and Partnerships)
art. 5 (Peer Pressure and Partnerships)art. 5 (Peer Pressure and Partnerships)
art. 5 (Peer Pressure and Partnerships)midiaz
 
Padre Claret
Padre ClaretPadre Claret
Padre Claretmidiaz
 

Mais de midiaz (7)

Revista Utopía_Entrevista San Carlos Borromeo
Revista Utopía_Entrevista San Carlos BorromeoRevista Utopía_Entrevista San Carlos Borromeo
Revista Utopía_Entrevista San Carlos Borromeo
 
Teoría de juegos
Teoría de juegosTeoría de juegos
Teoría de juegos
 
art. 5 (en español, por Vicente Salas)
art. 5 (en español, por Vicente Salas)art. 5 (en español, por Vicente Salas)
art. 5 (en español, por Vicente Salas)
 
Las cuatro velas
Las cuatro velasLas cuatro velas
Las cuatro velas
 
art. 3 (Yolanda Polo)
art. 3 (Yolanda Polo)art. 3 (Yolanda Polo)
art. 3 (Yolanda Polo)
 
art. 5 (Peer Pressure and Partnerships)
art. 5 (Peer Pressure and Partnerships)art. 5 (Peer Pressure and Partnerships)
art. 5 (Peer Pressure and Partnerships)
 
Padre Claret
Padre ClaretPadre Claret
Padre Claret
 

Último

Call Girls In Panjim North Goa 9971646499 Genuine Service
Call Girls In Panjim North Goa 9971646499 Genuine ServiceCall Girls In Panjim North Goa 9971646499 Genuine Service
Call Girls In Panjim North Goa 9971646499 Genuine Serviceritikaroy0888
 
HONOR Veterans Event Keynote by Michael Hawkins
HONOR Veterans Event Keynote by Michael HawkinsHONOR Veterans Event Keynote by Michael Hawkins
HONOR Veterans Event Keynote by Michael HawkinsMichael W. Hawkins
 
Cracking the Cultural Competence Code.pptx
Cracking the Cultural Competence Code.pptxCracking the Cultural Competence Code.pptx
Cracking the Cultural Competence Code.pptxWorkforce Group
 
Pharma Works Profile of Karan Communications
Pharma Works Profile of Karan CommunicationsPharma Works Profile of Karan Communications
Pharma Works Profile of Karan Communicationskarancommunications
 
Best VIP Call Girls Noida Sector 40 Call Me: 8448380779
Best VIP Call Girls Noida Sector 40 Call Me: 8448380779Best VIP Call Girls Noida Sector 40 Call Me: 8448380779
Best VIP Call Girls Noida Sector 40 Call Me: 8448380779Delhi Call girls
 
Monthly Social Media Update April 2024 pptx.pptx
Monthly Social Media Update April 2024 pptx.pptxMonthly Social Media Update April 2024 pptx.pptx
Monthly Social Media Update April 2024 pptx.pptxAndy Lambert
 
Mondelez State of Snacking and Future Trends 2023
Mondelez State of Snacking and Future Trends 2023Mondelez State of Snacking and Future Trends 2023
Mondelez State of Snacking and Future Trends 2023Neil Kimberley
 
B.COM Unit – 4 ( CORPORATE SOCIAL RESPONSIBILITY ( CSR ).pptx
B.COM Unit – 4 ( CORPORATE SOCIAL RESPONSIBILITY ( CSR ).pptxB.COM Unit – 4 ( CORPORATE SOCIAL RESPONSIBILITY ( CSR ).pptx
B.COM Unit – 4 ( CORPORATE SOCIAL RESPONSIBILITY ( CSR ).pptxpriyanshujha201
 
Lucknow 💋 Escorts in Lucknow - 450+ Call Girl Cash Payment 8923113531 Neha Th...
Lucknow 💋 Escorts in Lucknow - 450+ Call Girl Cash Payment 8923113531 Neha Th...Lucknow 💋 Escorts in Lucknow - 450+ Call Girl Cash Payment 8923113531 Neha Th...
Lucknow 💋 Escorts in Lucknow - 450+ Call Girl Cash Payment 8923113531 Neha Th...anilsa9823
 
MONA 98765-12871 CALL GIRLS IN LUDHIANA LUDHIANA CALL GIRL
MONA 98765-12871 CALL GIRLS IN LUDHIANA LUDHIANA CALL GIRLMONA 98765-12871 CALL GIRLS IN LUDHIANA LUDHIANA CALL GIRL
MONA 98765-12871 CALL GIRLS IN LUDHIANA LUDHIANA CALL GIRLSeo
 
FULL ENJOY Call Girls In Mahipalpur Delhi Contact Us 8377877756
FULL ENJOY Call Girls In Mahipalpur Delhi Contact Us 8377877756FULL ENJOY Call Girls In Mahipalpur Delhi Contact Us 8377877756
FULL ENJOY Call Girls In Mahipalpur Delhi Contact Us 8377877756dollysharma2066
 
👉Chandigarh Call Girls 👉9878799926👉Just Call👉Chandigarh Call Girl In Chandiga...
👉Chandigarh Call Girls 👉9878799926👉Just Call👉Chandigarh Call Girl In Chandiga...👉Chandigarh Call Girls 👉9878799926👉Just Call👉Chandigarh Call Girl In Chandiga...
👉Chandigarh Call Girls 👉9878799926👉Just Call👉Chandigarh Call Girl In Chandiga...rajveerescorts2022
 
Call Girls Hebbal Just Call 👗 7737669865 👗 Top Class Call Girl Service Bangalore
Call Girls Hebbal Just Call 👗 7737669865 👗 Top Class Call Girl Service BangaloreCall Girls Hebbal Just Call 👗 7737669865 👗 Top Class Call Girl Service Bangalore
Call Girls Hebbal Just Call 👗 7737669865 👗 Top Class Call Girl Service Bangaloreamitlee9823
 
Dr. Admir Softic_ presentation_Green Club_ENG.pdf
Dr. Admir Softic_ presentation_Green Club_ENG.pdfDr. Admir Softic_ presentation_Green Club_ENG.pdf
Dr. Admir Softic_ presentation_Green Club_ENG.pdfAdmir Softic
 
FULL ENJOY Call Girls In Majnu Ka Tilla, Delhi Contact Us 8377877756
FULL ENJOY Call Girls In Majnu Ka Tilla, Delhi Contact Us 8377877756FULL ENJOY Call Girls In Majnu Ka Tilla, Delhi Contact Us 8377877756
FULL ENJOY Call Girls In Majnu Ka Tilla, Delhi Contact Us 8377877756dollysharma2066
 
Call Girls In DLf Gurgaon ➥99902@11544 ( Best price)100% Genuine Escort In 24...
Call Girls In DLf Gurgaon ➥99902@11544 ( Best price)100% Genuine Escort In 24...Call Girls In DLf Gurgaon ➥99902@11544 ( Best price)100% Genuine Escort In 24...
Call Girls In DLf Gurgaon ➥99902@11544 ( Best price)100% Genuine Escort In 24...lizamodels9
 
Call Girls Navi Mumbai Just Call 9907093804 Top Class Call Girl Service Avail...
Call Girls Navi Mumbai Just Call 9907093804 Top Class Call Girl Service Avail...Call Girls Navi Mumbai Just Call 9907093804 Top Class Call Girl Service Avail...
Call Girls Navi Mumbai Just Call 9907093804 Top Class Call Girl Service Avail...Dipal Arora
 
Enhancing and Restoring Safety & Quality Cultures - Dave Litwiller - May 2024...
Enhancing and Restoring Safety & Quality Cultures - Dave Litwiller - May 2024...Enhancing and Restoring Safety & Quality Cultures - Dave Litwiller - May 2024...
Enhancing and Restoring Safety & Quality Cultures - Dave Litwiller - May 2024...Dave Litwiller
 
Insurers' journeys to build a mastery in the IoT usage
Insurers' journeys to build a mastery in the IoT usageInsurers' journeys to build a mastery in the IoT usage
Insurers' journeys to build a mastery in the IoT usageMatteo Carbone
 

Último (20)

Call Girls In Panjim North Goa 9971646499 Genuine Service
Call Girls In Panjim North Goa 9971646499 Genuine ServiceCall Girls In Panjim North Goa 9971646499 Genuine Service
Call Girls In Panjim North Goa 9971646499 Genuine Service
 
HONOR Veterans Event Keynote by Michael Hawkins
HONOR Veterans Event Keynote by Michael HawkinsHONOR Veterans Event Keynote by Michael Hawkins
HONOR Veterans Event Keynote by Michael Hawkins
 
Cracking the Cultural Competence Code.pptx
Cracking the Cultural Competence Code.pptxCracking the Cultural Competence Code.pptx
Cracking the Cultural Competence Code.pptx
 
Pharma Works Profile of Karan Communications
Pharma Works Profile of Karan CommunicationsPharma Works Profile of Karan Communications
Pharma Works Profile of Karan Communications
 
Best VIP Call Girls Noida Sector 40 Call Me: 8448380779
Best VIP Call Girls Noida Sector 40 Call Me: 8448380779Best VIP Call Girls Noida Sector 40 Call Me: 8448380779
Best VIP Call Girls Noida Sector 40 Call Me: 8448380779
 
Monthly Social Media Update April 2024 pptx.pptx
Monthly Social Media Update April 2024 pptx.pptxMonthly Social Media Update April 2024 pptx.pptx
Monthly Social Media Update April 2024 pptx.pptx
 
Mondelez State of Snacking and Future Trends 2023
Mondelez State of Snacking and Future Trends 2023Mondelez State of Snacking and Future Trends 2023
Mondelez State of Snacking and Future Trends 2023
 
B.COM Unit – 4 ( CORPORATE SOCIAL RESPONSIBILITY ( CSR ).pptx
B.COM Unit – 4 ( CORPORATE SOCIAL RESPONSIBILITY ( CSR ).pptxB.COM Unit – 4 ( CORPORATE SOCIAL RESPONSIBILITY ( CSR ).pptx
B.COM Unit – 4 ( CORPORATE SOCIAL RESPONSIBILITY ( CSR ).pptx
 
Lucknow 💋 Escorts in Lucknow - 450+ Call Girl Cash Payment 8923113531 Neha Th...
Lucknow 💋 Escorts in Lucknow - 450+ Call Girl Cash Payment 8923113531 Neha Th...Lucknow 💋 Escorts in Lucknow - 450+ Call Girl Cash Payment 8923113531 Neha Th...
Lucknow 💋 Escorts in Lucknow - 450+ Call Girl Cash Payment 8923113531 Neha Th...
 
MONA 98765-12871 CALL GIRLS IN LUDHIANA LUDHIANA CALL GIRL
MONA 98765-12871 CALL GIRLS IN LUDHIANA LUDHIANA CALL GIRLMONA 98765-12871 CALL GIRLS IN LUDHIANA LUDHIANA CALL GIRL
MONA 98765-12871 CALL GIRLS IN LUDHIANA LUDHIANA CALL GIRL
 
FULL ENJOY Call Girls In Mahipalpur Delhi Contact Us 8377877756
FULL ENJOY Call Girls In Mahipalpur Delhi Contact Us 8377877756FULL ENJOY Call Girls In Mahipalpur Delhi Contact Us 8377877756
FULL ENJOY Call Girls In Mahipalpur Delhi Contact Us 8377877756
 
👉Chandigarh Call Girls 👉9878799926👉Just Call👉Chandigarh Call Girl In Chandiga...
👉Chandigarh Call Girls 👉9878799926👉Just Call👉Chandigarh Call Girl In Chandiga...👉Chandigarh Call Girls 👉9878799926👉Just Call👉Chandigarh Call Girl In Chandiga...
👉Chandigarh Call Girls 👉9878799926👉Just Call👉Chandigarh Call Girl In Chandiga...
 
Call Girls Hebbal Just Call 👗 7737669865 👗 Top Class Call Girl Service Bangalore
Call Girls Hebbal Just Call 👗 7737669865 👗 Top Class Call Girl Service BangaloreCall Girls Hebbal Just Call 👗 7737669865 👗 Top Class Call Girl Service Bangalore
Call Girls Hebbal Just Call 👗 7737669865 👗 Top Class Call Girl Service Bangalore
 
Forklift Operations: Safety through Cartoons
Forklift Operations: Safety through CartoonsForklift Operations: Safety through Cartoons
Forklift Operations: Safety through Cartoons
 
Dr. Admir Softic_ presentation_Green Club_ENG.pdf
Dr. Admir Softic_ presentation_Green Club_ENG.pdfDr. Admir Softic_ presentation_Green Club_ENG.pdf
Dr. Admir Softic_ presentation_Green Club_ENG.pdf
 
FULL ENJOY Call Girls In Majnu Ka Tilla, Delhi Contact Us 8377877756
FULL ENJOY Call Girls In Majnu Ka Tilla, Delhi Contact Us 8377877756FULL ENJOY Call Girls In Majnu Ka Tilla, Delhi Contact Us 8377877756
FULL ENJOY Call Girls In Majnu Ka Tilla, Delhi Contact Us 8377877756
 
Call Girls In DLf Gurgaon ➥99902@11544 ( Best price)100% Genuine Escort In 24...
Call Girls In DLf Gurgaon ➥99902@11544 ( Best price)100% Genuine Escort In 24...Call Girls In DLf Gurgaon ➥99902@11544 ( Best price)100% Genuine Escort In 24...
Call Girls In DLf Gurgaon ➥99902@11544 ( Best price)100% Genuine Escort In 24...
 
Call Girls Navi Mumbai Just Call 9907093804 Top Class Call Girl Service Avail...
Call Girls Navi Mumbai Just Call 9907093804 Top Class Call Girl Service Avail...Call Girls Navi Mumbai Just Call 9907093804 Top Class Call Girl Service Avail...
Call Girls Navi Mumbai Just Call 9907093804 Top Class Call Girl Service Avail...
 
Enhancing and Restoring Safety & Quality Cultures - Dave Litwiller - May 2024...
Enhancing and Restoring Safety & Quality Cultures - Dave Litwiller - May 2024...Enhancing and Restoring Safety & Quality Cultures - Dave Litwiller - May 2024...
Enhancing and Restoring Safety & Quality Cultures - Dave Litwiller - May 2024...
 
Insurers' journeys to build a mastery in the IoT usage
Insurers' journeys to build a mastery in the IoT usageInsurers' journeys to build a mastery in the IoT usage
Insurers' journeys to build a mastery in the IoT usage
 

art. 4 (Y. Polo)

  • 1. ARTICLE JOURNAL OF THE ACADEMY et al. / CONSUMER SWITCHING COSTS Burnham OF MARKETING SCIENCE 10.1177/0092070302250897 SPRING 2003 Consumer Switching Costs: A Typology, Antecedents, and Consequences Thomas A. Burnham Santa Clara University Judy K. Frels University of Maryland Vijay Mahajan University of Texas at Austin The management of customer switching costs has been In view of the potential importance of switching costs, the impact of all strategic moves on switching hampered by the lack of a comprehensive typology for con- costs should be considered. ceptualizing, categorizing, and measuring consumers’ perceptions of these costs. This research develops a —Michael Porter (1980:122). switching cost typology that identifies three types of switching costs: (1) procedural switching costs, primarily Reduced regulation, increased price competition, and involving the loss of time and effort; (2) financial switching diminished consumer loyalty have propelled customer costs, involving the loss of financially quantifiable re- retention and customer relationship management (CRM) sources; and (3) relational switching costs, involving psy- to the forefront of marketing concerns (Marketing Science chological or emotional discomfort due to the loss of Institute 2002). As the primary tool for managing cus- identity and the breaking of bonds. The research then ex- tomer retention, customer satisfaction has received amines the antecedents and consequences of switching unflagging attention in the marketing literature (cf. Ander- costs. The results suggest that consumers’ perceptions of son and Sullivan 1993; Fornell 1992; Fournier and Mick product complexity and provider heterogeneity, their 1999; Szymanski and Henard 2001). Firms around the breadth of product use, and their alternative provider and world have adopted customer satisfaction measures as a de switching experience drive the switching costs they per- facto standard for monitoring progress, motivated by the ceive. Furthermore, all three switching cost types signifi- belief that customer retention and profitability will follow. cantly influence consumers’ intentions to stay with their While evidence accumulates that satisfaction influences current service provider, explaining more variance than repeat purchase behavior, it typically explains only a quar- does satisfaction. ter of the variance in behavioral intentions (see the meta- analysis by Szymanski and Henard 2001), and the rela- Keywords: switching costs; customer satisfaction; cus- tionship between satisfaction and loyalty is now recog- tomer retention; customer loyalty; customer nized as more complex than originally proposed (Fournier relationship management and Mick 1999; Mittal and Kamakura 2001; Oliver 1999). Yet firms appear to be stuck in a “satisfaction trap,” a myo- pic belief that customer satisfaction and service quality are the only tools for managing customer retention (Reichheld Journal of the Academy of Marketing Science. 1996). To break out of this trap, marketers must devote Volume 31, No. 2, pages 109-126. themselves to more fully understand the various drivers of DOI: 10.1177/0092070302250897 customer retention. This research investigates an oft- Copyright © 2003 by Academy of Marketing Science.
  • 2. 110 JOURNAL OF THE ACADEMY OF MARKETING SCIENCE SPRING 2003 noted, but seldom studied, driver of repeat choice behav- • Provide an assessment of major theoretical factors ior: the switching costs that reduce customers’ desire to that drive consumer switching cost perceptions leave an incumbent provider. • Assess the effects of different types of switching costs on consumers’ repeat purchase intentions Firms regularly make marketing choices that affect consumers’ perceived switching costs. Consider an exam- To achieve these objectives, we develop a comprehen- ple from the U.S. long-distance telephone industry. In sive two-tiered typology for conceptualizing consumer 1991, MCI launched the Friends & Family program. This switching costs using data from two consumer service in- marketing program asked customers to invest time and dustries. At the lower level, the typology provides the effort building “circles,” or databases of friends and family granularity necessary to assess distinct switching cost fac- members, in order to receive a discounted calling rate. ets. At the higher level, it offers the parsimony required to Between 1991 and 1997, MCI gained almost five share efficiently conceptualize and communicate the construct. points in the long-distance market. In 1995, AT&T Using this typology, we first test a model of switching cost scrapped its long-standing use of time-varying prices and antecedents. We then examine how different switching began offering a 10¢ a minute plan for all long-distance costs explain consumers’ intentions to stay with an incum- calls. Between 1991 and 1997, AT&T lost 18 percent of bent provider. Drawing on the study findings, recommen- the market it had once dominated. While additional factors dations are presented for managing the factors that are likely to have influenced these share changes, we sug- influence consumer switching costs and for using switch- gest that the AT&T pricing change reduced the costs its ing costs, along with customer satisfaction, in programs to customers faced in comparing alternatives and thus weak- improve customer retention. We conclude with a discus- ened AT&T’s customer retention. The MCI Friends & sion of the generalizability of the findings and future re- Family program, on the other hand, increased the time and search directions. effort investments its customers would lose upon switch- ing and thus strengthened MCI’s customer retention. In the marketing, management, and economics litera- THE SWITCHING COST CONSTRUCT ture, a consensus has emerged that switching costs are prevalent in a wide variety of industrial and consumer con- Definition of Switching Costs texts (Fornell 1992; Klemperer 1995). There is evidence that switching costs have a significant impact on repeat Porter (1980) suggested that switching costs are “one- choice behavior (Weiss and Heide 1993), on the strategies time” costs (p. 10), as opposed to the ongoing costs managers should (and do) adopt (Eliashberg and Robert- associated with using a product or provider once a repeat- son 1988; Karakaya and Stahl 1989), and on the resultant purchase relationship is established. We define switching industry and competitive structures (Farrell and Shapiro costs as the onetime costs that customers associate with 1988). Switching costs have also been associated with the process of switching from one provider to another. higher profits (Beggs and Klemperer 1992), with inelastic While switching costs must be associated with the switch- response to price (Farrell and Shapiro 1988), with ing process, they need not be incurred immediately upon increased product preannouncements (Eliashberg and switching. Furthermore, switching costs need not be lim- Robertson 1988), and with barriers to market entry and ited to objective, “economic” costs. When consumers sim- sustainable strategic advantage (Karakaya and Stahl 1989; plistically state that “it’s just not worth it” to switch pro- Schmalensee 1982; Kerin, Varadarajan, and Peterson viders, they may perceive impediments ranging from 1992). “search costs, transaction costs, learning costs, loyal cus- Given their importance, it seems natural that firms tomer discounts, customer habit, emotional cost and cog- would want to manage their customers’ perceptions of nitive effort, coupled with financial, social, and psycho- switching costs. Regrettably, the existence of perceptions logical risk on the part of the buyer” (Fornell 1992:10). of switching costs has, by and large, been supported by These costs are seldom explicitly assessed, but they anecdotes, logic, and simplistic measures that do not become salient and evident when consumers are faced reflect the multidimensional nature of switching costs dis- with a reason to consider switching. cussed in the literature. There is little surprise, then, in the calls for solid empirical research on the switching cost A Comprehensive View of Switching Costs construct and its management (Gatignon and Robertson 1992; Klemperer 1995). To effectively manage switching costs, firms must dis- The primary objectives of this research are the following: tinguish and understand the various types of costs that con- sumers perceive. Regrettably, descriptions of switching • Discover and empirically validate a typology of con- cost facets (e.g., Porter 1980; Jackson 1985; Guiltinan sumer switching cost perceptions 1989; Klemperer 1995) have yet to be supported by empir-
  • 3. Burnham et al. / CONSUMER SWITCHING COSTS 111 Switching Cost Facet Definitions ical research, leaving both researchers and practitioners without accepted frameworks or measurements to draw 1. Economic risk costs are the costs of accepting uncer- on. This is understandable. As Fornell (1992) stated, “A di- tainty with the potential for a negative outcome when rect measure of switching barriers is difficult to obtain” as adopting a new provider about which the consumer has “all costs associated with deserting one supplier in favor of insufficient information (Guiltinan 1989; Jackson 1985; another constitute switching barriers” (p. 11). A review of Klemperer 1995; Samuelson and Zeckhauser 1988). Per- empirical switching cost literature reveals that prior re- ceived consumption risk has been conceptualized as a six- search has typically adopted one of three approaches to dimensional construct (Bettman 1973), three of which are measuring switching costs: relevant here: performance risk, financial risk, and conve- nience risk. • It has measured one or a few switching cost facets 2. Evaluation costs are the time and effort costs associ- specific to the context of the research, such as a ven- ated with the search and analysis needed to make a switch- dor’s retraining effort, their process development ef- ing decision (Samuelson and Zeckhauser 1988; Shugan fort, and their relationship development time (cf. 1980). Time and effort are associated with collecting the Heide and Weiss 1995). information needed to evaluate potential alternative pro- • It has measured switching costs as a unidimensional viders. Mental effort is required to restructure and analyze global construct. For example, “How costly would it available information in order to arrive at an informed be for you to switch suppliers?” (cf. Eliashberg and decision (Shugan 1980). Robertson 1988; Karakaya and Stahl 1989; Ping 3. Learning costs are the time and effort costs of acquir- 1993). ing new skills or know-how in order to use a new product • It has assumed that consumers perceive switching or service effectively (Alba and Hutchinson 1987; Eliash- costs and has ascribed all evidence of differences in berg and Robertson 1988; Guiltinan 1989; Wernerfelt satisfaction response to such costs (cf. Anderson and 1985). Learning investments are often provider-specific, Sullivan 1993; Fornell 1992; Klemperer 1995). meaning new investments must be made to adapt to a new provider (Klemperer 1995). While each of these approaches may be appropriate for its context, reliance on them leaves gaps in our understand- 4. Setup costs are the time and effort costs associated ing of switching costs, their drivers, and their impact on with the process of initiating a relationship with a new pro- customer retention. Examining a single facet of a multifac- vider or setting up a new product for initial use (consider eted construct is unlikely to produce an adequate assess- installing and configuring software) (Guiltinan 1989; ment of the construct or its relationships with other Klemperer 1995). Setup costs for services are dominated constructs (Kumar, Stern, and Achrol 1992), while em- by the information exchange needed for a new provider to ploying a global measure provides little guidance for man- reduce its selling risks and understand the customers’ spe- aging switching cost perceptions and increases measure- cific needs (Guiltinan 1989). ment error as it forces respondents to mentally combine 5. Benefit loss costs are the costs associated with con- multidimensional ratings. Relying on regression inter- tractual linkages that create economic benefits for staying cepts to represent switching costs not only combines the with an incumbent firm (Guiltinan 1989). In switching to a effects of multiple switching cost types but also confounds new provider, consumers may lose points they have accu- switching costs with other possible influences on repeat mulated and discounts or benefits that are not afforded to purchase behavior. A more rigorous means for conceptual- new customers (Guiltinan 1989). izing and measuring consumer switching costs is needed. 6. Monetary loss costs are the onetime financial outlays that are incurred in switching providers other than those A Switching Cost Typology used to purchase the new product itself (Heide and Weiss 1995; Jackson 1985; Klemperer 1995; Porter 1980; Weiss and Heide 1993). Adopting a new provider often involves On the basis of a review of the literature and interviews onetime expenditures such as deposits or initiation fees for with industry managers and consumer focus groups, we new customers (Guiltinan 1989). In addition, switching developed multi-item scales for comprehensively measur- products or providers may involve replacing transaction- ing consumer switching costs. Following accepted scale specific assets, or “coassets,” in which the consumer has development procedures (Anderson and Gerbing 1988; invested (Kerin et al. 1992; Weiss and Heide 1993). Churchill 1979), we found evidence for eight distinct switching cost facets. The facets are described next; the 7. Personal relationship loss costs are the affective methodology by which they were derived is presented later losses associated with breaking the bonds of identification in the Method and Results section. that have been formed with the people with whom the
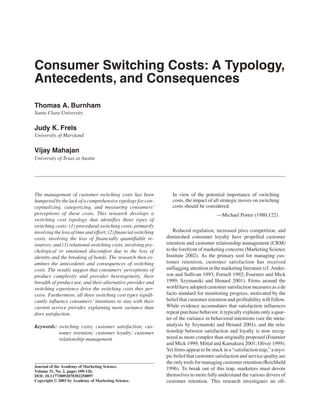
  • 4. 112 JOURNAL OF THE ACADEMY OF MARKETING SCIENCE SPRING 2003 SWITCHING COST ANTECEDENTS FIGURE 1 A Typology of Consumer Perceptions of Prior research suggests a number of strategies for man- Switching Costs aging specific consumer switching costs (e.g., Crosby, Evans, and Cowles 1990; Klemperer 1995). However, these suggestions support a piecemeal approach to switch- Relational Procedural Financial Switching Costs Switching Costs Switching Costs ing cost management, raising a number of concerns. First, managing distinct switching costs separately may be less • Economic • Benefit • Personal Risk Costs effective than managing them simultaneously, as certain Loss Costs Relationship • Evaluation Loss Costs • Monetary antecedents may influence multiple switching costs. Sec- Costs • Brand Loss Costs • Set Up Costs ond, without a thorough understanding of switching costs Relationship • Learning Costs Loss Costs and their antecedents, a firm may fail to recognize when its actions will influence switching costs—as AT&T’s sim- plification of its pricing structure did—and the firm may inadvertently reduce some of its customers’ switching costs. To provide a framework for managing different types of switching costs, we propose hypotheses linking six antecedents with the three major switching cost types customer interacts (Guiltinan 1989; Klemperer 1995; Por- (see Figure 2). ter 1980). Consumers’ familiarity with incumbent pro- vider employees creates a level of comfort that is not Switching Cost Antecedents and Hypotheses immediately available with a new provider. 8. Brand relationship loss costs are the affective losses Prior research suggests three groups of consumer- associated with breaking the bonds of identification that based antecedents of switching costs: have been formed with the brand or company with which a customer has associated (Aaker 1992; Porter 1980). Con- • Perceptions of product and market characteristics sumers often draw meaning from their purchases and form (Gatignon and Robertson 1992) associations that become part of their sense of identity • Investments with the provider (Jackson 1985) (McCracken 1986). These brand- or company-based rela- • Domain expertise (Alba and Hutchinson 1987; tional bonds are lost in switching providers. Klemperer 1987; Wernerfelt 1985). Switching Cost Types Perceptions of Product and Market Characteristics Product and market characteristics describe the nature To provide a more parsimonious typology of switching of the products and providers in an industry. Switching costs, we investigated the relationships between the eight costs may be generated by product and market characteris- switching cost facets. Analyses described in the Method tics associated with a slow diffusion of innovations. Two and Results section suggested that the eight facets could be such characteristics are the complexity of the items being further organized as three higher-order switching cost considered (Gatignon and Robertson 1992; Klemperer types (see Figure 1). These were titled as follows: 1995) and the heterogeneity of providers in the market (Schmalensee 1982). Since perceptions of these character- • Procedural switching costs: Consisting of economic istics vary among consumers within an industry, differ- risk, evaluation, learning, and setup costs, this type ences in switching costs occur as well. of switching cost primarily involves the expenditure 1 Product complexity is defined as the extent to which the of time and effort. consumer perceives a product to be difficult to understand • Financial switching costs: Consisting of benefits loss or use (Rogers 1995). A product that offers a large number and financial-loss costs, this type of switching cost 2 of options or that involves a large number of steps in its use involves the loss of financially quantifiable resources. will typically be seen as more complex. Consumers are • Relational switching costs: Consisting of personal- likely to perceive higher risks when products are more relationship loss and brand relationship loss costs, complex because the difficulty in understanding the prod- this type of switching cost involves psychological or uct leads to uncertainty, increasing the perception that an emotional discomfort due to the loss of identity and unknown negative outcome may occur (Holak and the breaking of bonds. Lehmann 1990). Similarly, the larger number of attributes In the next section, we investigate the factors that drive associated with complex products makes both information consumers’perceptions of these three switching cost types collection and direct comparisons of attributes more costly in order to understand how they might be better managed. (Shugan 1980). A more complex product is also likely to
  • 5. Burnham et al. / CONSUMER SWITCHING COSTS 113 FIGURE 2 Consumer Switching Costs and Their Antecedents and Consequences (Theoretical Model) Market Characteristics • Product Complexity H1 + • Provider Heterogeneity H2 Procedural Switching Costs + • Economic Risk Costs • Evaluation Costs Consumer Investments • Learning Costs • Breadth of Use • Set-Up Costs H3 H8 + Intention to Stay with Incumbent Provider • Extent of Modification H4 + Financial Switching Costs + • Benefit Loss Costs Domain E xpertise H9 • Monetary Loss Costs • Alternative Experience H5 _ _ + H7 • Relational Switching Costs • Switching Experience H6 _ • Personal Relationship Loss Costs Satisfaction • Brand Relationship Loss Costs Individual-Level Covariates • Time Pressure • Risk Aversion involve a larger number of learned skills or scripts that which knowledge concerning one provider is applicable to must be relearned in order to switch providers (Wernerfelt another provider (Schmalensee 1982), increasing the un- 1985). Finally, complex products are not “easy to try” (Holak certainty and the “cost of thinking” associated with and Lehmann 1990:63); thus, as complexity increases, the switching providers (Shugan 1980). Similarly, the lack of efforts required to establish a new relationship will rise. In standardization implied by heterogeneity suggests that sum, when consumers perceive products as more complex, skills learned for use with one provider may not be appli- they perceive higher procedural switching costs. cable with another (Alba and Hutchinson 1987). Hetero- geneity perceptions may also imply loyalty points or Product complexity is also likely to lead to higher reduced prices cannot be transferred across providers financial switching cost perceptions, as a common source (Klemperer 1987, 1995). Finally, to the extent organiza- of perceived product complexity is a complex price struc- tions are seen as different and unique, consumers perceive ture. In the cellular telephone market, the “product” might stronger bonds of identification with them (Bhattacharya, consist of the cell phone itself, the number of minutes Rao, and Glynn 1995). available during the business day, the number of minutes available on the weekend, the geographic area in which a Hypothesis 2: Greater perceived provider heterogeneity call can be received or placed without additional fees, and will be associated with higher procedural, financial, other services such as voice mail and phone insurance. This and relational switching costs. complexity can lead consumers to perceive that switching to a new offering will involve the outlay of additional funds Investments With the Provider or forfeiture of previously made down payments, start-up fees, or investments in provider-specific assets. Investments in relationships tie the members together; Finally, when products are perceived as more complex, if the relationship is terminated, the investments are lost consumers rely more on relationships with brands and (Dwyer, Schurr, and Oh 1987; Morgan and Hunt 1994; people to ensure that they receive a quality product and to Klemperer 1995). The potential for such loss makes simplify choices (Sheth and Parvatiyar 1995). investments an important driver of switching costs (Jack- son 1985). Consumers invest in a provider when they use Hypothesis 1: Greater perceived product complexity will more of the provider’s different products (Blattberg and be associated with higher procedural, financial, and Deighton 1996) and when they modify the products they relational switching costs. receive from the provider (Bhardawaj, Varadarajan, and Fahy 1993; Robinson 1988). Provider heterogeneity is defined as the extent to which the providers in a market are seen as different or nonsub- Breadth of use of a provider is defined as the extent to stitutable. Provider heterogeneity reduces the extent to which the consumer employs a variety of product types,
  • 6. 114 JOURNAL OF THE ACADEMY OF MARKETING SCIENCE SPRING 2003 features, and functions offered by a provider (Ram and greater communication with the provider or interaction Jung 1990). Blattberg and Deighton (1996) suggested that with the product. The interaction and the resultant match- the degree to which a customer buys complements and ing between the consumers’ needs and the product pro- supplements to the core product determines the intrinsic vided lead to higher personal and brand identification retainability of the customer. Insurance customers, for (McCracken 1986), thus creating higher relationship loss example, often purchase life, health, home, and auto insur- costs. ance from a single company. Grocery store customers may Hypothesis 4: Greater modification of the incumbent take advantage of delis, pharmacies, delivery services, product will be associated with higher procedural, video rental services, and store discount cards in addition financial, and relational switching costs. to buying basic groceries. Given the time and effort sav- ings that a “full-line producer” offers, consumers are likely Domain Expertise to switch either all the products associated with a given provider or none of them (Klemperer 1995). The prospect Expertise in a product domain allows consumers to of switching multiple products increases the risks associ- more rapidly and accurately evaluate options and learn ated with switching providers—not only one product is at new product-related information (Alba and Hutchinson risk of performance, financial, or convenience failure but 1987). Consumers gain domain expertise when they multiple, often interdependent products are placed in jeop- increase their product-related experiences (Park, ardy at once. Furthermore, when considering switching Mothersbaugh, and Feick 1994). Two types of domain- providers, consumers who use more products need to com- level product experience are the breadth of the consumer’s pare alternative providers on a greater number of attributes prior experience with an alternative provider (Fornell (Shugan 1980), they need to set up a greater number of new 1992; Klemperer 1987) and the extent of the consumer’s products or features, and they need to invest in learning switching experience (Nilssen 1992). how to use a greater number of new products or features Alternative experience is defined as the breadth of ex- (Schmalensee 1982). perience the consumer has with the various products, fea- In addition to generating procedural costs, using more tures, and functions offered by a competing service linked products or services is also likely to increase the fi- provider. Broad experience with an alternative provider nancial costs of switching. The greater the breadth of prod- leads to increased expertise with the service, which re- ucts employed, the more likely the customer has duces the uncertainty associated with using a new pro- accumulated benefits that will be lost in switching (con- vider. Greater expertise is also associated with more well- sider the multiproduct discounts offered insurance cus- developed mental structures (Alba and Hutchinson 1987). These structures make encoding and retrieving the infor- tomers), and the more likely that one of the products or mation needed to evaluate new products easier and facili- services will be associated with a new monetary outlay in tate new learning (Alba and Hutchinson 1987). Broad switching. Finally, establishing multiple links with a pro- experience with an alternative provider is also likely to re- vider requires greater interaction with the provider. This duce perceptions of uniqueness of an existing provider, increased personal interaction leads to higher personal and leading to weaker relational bonds with the provider brand identification with the provider (McCracken 1986) (Bhattacharya et al. 1995). and thus to stronger personal and brand relationship bonds with the providers of the service. Hypothesis 5: Greater prior experience with alternative providers will be associated with lower procedural Hypothesis 3: Greater breadth of incumbent provider use and relational switching costs. will be associated with higher procedural, financial, and relational switching costs. Switching experience is defined as the extent to which Modification of a product is defined as the extent to the consumer has switched between providers in the past. which the consumer adapts the product offered so that it Increased switching reduces switching costs by increasing better serves his or her individual needs. For example, the consumer’s familiarity with the process of both switch- MCI customers “build” Friends & Family calling circles ing and learning to use new providers (Nilssen 1992). and program fast-dial codes for their calling cards. Switching experience also implies a reduced duration with Citibank customers have personal photographs embedded the incumbent provider, which means there has been less in their credit cards and arrange cross-service airline mile- time to accumulate benefits that might be lost in switching. age credits. Such modifications must be replicated upon Furthermore, consumers who have switched more have switching providers (Bhardawaj et al. 1993). Similarly, had less time with their current provider to develop brand benefits such as frequent-flyer miles or other points ac- and personal relationship bonds, and they are less likely to quired through modification with the current provider will perceive their provider relationship as unique (Bhatta- be lost upon switching. Finally, modification requires charya et al. 1995).
  • 7. Burnham et al. / CONSUMER SWITCHING COSTS 115 Hypothesis 6: Greater switching experience will be asso- stay with the provider. Put simply, switching costs are dis- ciated with lower procedural, financial, and rela- utilities that consumers would rather not incur. While prior tional switching costs. research has not studied the effects of different switching cost types, evidence of direct switching cost effects has been Individual Characteristics accumulating at the industry level and at the global switch- Individual consumer characteristics are also likely to ing cost level (Anderson and Sullivan 1993; Bansal and influence the extent to which switching costs are per- Taylor 1999; Weiss and Heide 1993). Consistent with these ceived. Two individual-level characteristics associated efforts but offering more specificity in our description of with switching cost perceptions are the consumers’level of switching costs, we propose the following direct relation- time pressure and their level of risk aversion (Jackson ship between switching costs and customer intentions: 1985). These two antecedents were measured and included as covariates; no formal hypotheses regarding Hypothesis 8: Greater (a) procedural, (b) financial, and (c) relational switching costs will be associated with their effects are offered. higher consumer intentions to stay with an incum- To summarize, the antecedent model suggests that bent provider. greater perceptions of complexity and heterogeneity, increased breadth of incumbent provider use, and greater Researchers have also suggested that switching costs product modification will generally be associated with and satisfaction may negatively interact with each other in higher switching costs, while increased experience with an driving customer intentions (Jones and Sasser 1995; alternative provider and increased experience with switch- Jones, Mothersbaugh, and Beatty 2000; Oliva, Oliver, and ing will generally be associated with lower switching costs MacMillan 1992). As switching costs rise, the influence of (see Figure 2). satisfaction on intentions to stay with a provider may de- crease (and vice versa). Oliver (1999) suggested that “sat- SWITCHING COST CONSEQUENCES isfaction is a necessary step in loyalty formation but becomes less significant as loyalty begins to set through The driving force behind managerial interest in switch- other mechanisms,” including “social bonding at the insti- ing costs is the premise that these costs impede customer tutional and personal level” (p. 33). Using a global mea- switching and hence improve customer retention. While sure of switching costs, Jones et al. (2000) found evidence an ample body of research discusses this relationship, of this negative interaction effect. Consistent with these ef- empirical evidence is scant; little is known about the role forts, we propose the following moderating effect for each that different switching costs play in aiding customer of the three major switching cost types: retention. A study of the effects of different types of con- sumer switching costs not only strengthens the Hypothesis 9: The relationship between satisfaction and nomological network for the construct and the typology consumer intentions to stay with an incumbent pro- (Gerbing and Anderson 1988) but also provides insights vider will be weaker (stronger) when consumers perceive higher (lower) (a) procedural switching about the utility of switching costs as a managerial tool. costs, (b) financial switching costs, and (c) rela- Our study of switching cost effects builds on current tional switching costs. research that focuses on satisfaction as the primary driver of customer retention. METHOD AND RESULTS The Drivers of Customer Retention Measuring and Organizing Switching Costs While the role of satisfaction in retaining customers is now perceived as more complex than initially thought Drawing on interviews with long-distance, local tele- (Mittal and Kamakura 2001; Oliver 1999), abundant evi- phone service, and insurance industry managers; two con- dence supports the commonsense expectation that satis- sumer focus groups; and the switching cost literature, a fied customers are more likely to stay with their existing comprehensive list of the potential losses faced by con- providers than are dissatisfied customers (cf. Oliver 1997; sumers when switching providers was compiled. Items for Szymanski and Henard 2001). each switching cost were developed or borrowed from pre- vious research and modified. Based on an expert survey in Hypothesis 7: Greater satisfaction will be associated which 20 managers rated the presence of different switch- with higher intentions to stay with an incumbent provider. ing costs and the level of competition for customers in 15 different consumer industries, two industries were identi- To the extent consumers perceive switching costs or fied for further study. The credit card industry and the long- barriers to leaving a provider, they should be inclined to distance industry were selected as being representative of
  • 8. 116 JOURNAL OF THE ACADEMY OF MARKETING SCIENCE SPRING 2003 business domains in which the providers’battle to improve relationship loss switching costs. Correlations between customer retention could greatly benefit from switching these constructs are provided in part A of Table 1. cost management—industries in which a wide array of The more parsimonious structure was derived by first switching cost perceptions should exist even though it is submitting composite measures for the eight constructs to relatively easy for consumers to switch providers. A pre- a varimax-rotated exploratory factor analysis. The results test survey was conducted using a convenience sample of suggested three higher order switching cost types. The 120 nonacademic employees of a large southwestern uni- three-factor model was then tested using a second-order versity. A strict definition of switching was provided to CFA, modeling the flow of the 30 original switching cost ensure consistent interpretation: respondents were asked items through the eight first-order constructs. This model fit the data well: χ2396 = 769, CFI = .98, NFI = .97, RMSEA to consider dropping their previously identified primary service provider in order to adopt a new provider. Respon- = .056. A CFA for this higher order model was then evalu- dents rated their perceptions of the costs involved in ated in comparison with higher order models with switching using 5-point Likert-type scales. Scales for the dimensionalities both above and below that of the pro- switching costs, the antecedents, satisfaction, and con- posed model. A change in chi-square comparison of alter- sumer intentions were then refined using exploratory fac- native, nested covariance models confirmed that the three- tor analysis, Cronbach’s alpha, and confirmatory factor factor higher order model fit the data significantly better analyses (CFAs) (Anderson and Gerbing 1988; Churchill than the best two-factor higher order model (∆χ2 2 = 34, p < 1979). .01) and did not fit significantly worse than the best four- factor higher order model (∆χ2 2 = 4.8, p > .05). Given the The final survey was then distributed to 287 credit card consumers and 288 long-distance consumers. The sample virtue of parsimony, these findings support using a three- included members of a local civic organization, employees factor model to conceptualize consumer switching costs. of two national firms, members of a local church organiza- The validity of pooling at this level was also tested using tion, and employees of a large state university. One hun- multigroup methods—pooling of the two industries did dred fifty-eight completed credit card surveys were not result in a significant degradation of model fit. Load- returned (53%), constituting the sample for the credit card ings of the lower order factors are provided in part B of study. Of the long-distance surveys distributed, 144 sur- Table 1, and correlations among the higher order factors veys were returned (50%) and were usable. are provided in part C of Table 1. Using CFA (AMOS 4.01) (Arbuckle and Wothke Using the criteria set forth by Fornell and Larcker 1999), a measurement model incorporating the eight (1981) to test for discriminant validity, the average vari- switching cost facets described earlier was found to fit the ance extracted for the items of each of the three switching data well (long distance: χ2 377 = 596, Comparative Fit cost types was found to be greater than the squared correla- Index [CFI] = .98, Normed Fit Index [NFI] = .95, root tions for all pairs of factors (see part D of Table 1). Thus, mean square error of approximation [RMSEA] = .064; the three higher order factors are discriminant. In addition, credit card: χ2 377 = 711, CFI = .97, NFI = .94, RMSEA = each pair of the eight lower order switching costs also met .075). Coefficient alphas for the eight scales in both indus- these criteria except for brand relationship loss costs and tries ranged from .68 to .87 (Table A1). To test for the personal-relationship loss costs. On further inspection, appropriateness of pooling the data, the measurement this pair passed for the long-distance data but not for the model was subjected to multigroup tests constraining all credit card data. Given the conceptual differences in the loadings and correlations to be equal across the two indus- two constructs, both were retained. try data sets. The degradation in model fit was insignifi- cant, suggesting a sufficiently consistent model structure Measuring the Antecedents across industries to support pooling the data to achieve and Consequences more accurate parameter estimation in subsequent analy- ses (χ2 377 = 710, CFI = .99, NFI = .97, RMSEA = .054). Scales measuring the antecedent and consequence con- Following the methods proposed by Anderson and structs were developed and tested in the same iterative Gerbing (1988), convergent and discriminant validity of manner described above. The final versions of the six ante- the scales were examined. All items loaded significantly cedent scales (Table A2) demonstrated good reliability on their intended constructs, suggesting convergent valid- (coefficient alphas ranging from .69 to .92) as well as con- ity (Table A1). Discriminant validity was also supported vergent and discriminant validity; constricting the correla- (Anderson and Gerbing 1988). The eight resultant switch- tion between any two constructs to unity resulted in a sig- ing cost facets are those described in detail earlier: eco- nificant degradation in model fit. All construct pairs also nomic risk, evaluation, learning, set-up, benefits loss, passed the more stringent criteria proposed by Fornell and financial loss, personal relationship loss and brand Larcker (1981) except for one pair in one industry (alternative
  • 9. Burnham et al. / CONSUMER SWITCHING COSTS 117 TABLE 1 Switching Costs Measurement Model Loadings and Correlations Risk Evaluation Learning Set-Up Benefit Money Personal A. Lower Order Switching Cost Facet Correlations Risk 1.00 Evaluation .61*** 1.00 Learning .60*** .49*** 1.00 Set-up .64*** .49*** .56*** 1.00 Benefit .18* .08 .36*** .25 1.00 Money .53*** .35*** .48*** .55*** .50*** 1.00 Personal .33*** .06 .36*** .19** .15* .23** 1.00 Brand .16* –.11 .21** .07 .07 .08 .65*** Procedural Financial Relational B. Loading of Lower Order Facets on Higher Order Types Risk .85*** Evaluation .65*** Learning .75*** Set-up .76*** Benefit .51*** Money .88*** Personal .89*** Brand .87*** C. Higher Order Switching Cost Type Correlation Procedural 1.00 Financial .69*** 1.00 Relational .33*** .25** 1.00 D. Fornell-Larcker Criteria for Discriminant Validity for Higher Order Switching Costs (Average variance extracted on diagonal; squared correlation on off-diagonals) Procedural .87 Financial .47 .66 Relational .11 .06 .87 *p < .05. **p < .01. ***p < .001. provider experience and switching experience in the credit (Hypothesis 2) received mixed support, while our hypoth- card industry). The six constructs were therefore retained. esis on the effects of product modification (Hypothesis 4) A four-item satisfaction scale was used to assess respon- was not supported. Finally, although no hypotheses were dents’ general satisfaction, confirmation of expectations, offered regarding the covariates, our results suggest that and distance from the hypothetical ideal product (Fornell risk aversion is significantly related to procedural and rela- 1992). A two-item intentions scale was used to assess con- tional switching cost perceptions and that time pressure is sumers’ intentions to stay with their current service pro- significantly related to procedural switching cost percep- vider. Reliability and convergent validity for these scales tions. The results also supported the hypothesized effects were satisfactory (Table A3). of satisfaction on intentions (Hypothesis 7) and the hypothesized effects of the three switching cost types on intentions (Hypothesis 8a-c). Testing the Structural Model To test for interactions, respondents were split into high, medium, and low groups based on their switching The relationships between the constructs were exam- cost perceptions for each of the three types. A structural ined using structural equation modeling. The results are model linking satisfaction with intentions to stay was then presented in Tables 2, 3, and 4 and are summarized below; constrained to force equal loadings between the high- and implications are discussed in the following section. the low-level switching cost groups. None of the three The results fully supported our hypotheses on the cases exhibited a significant degradation in fit when the switching cost effects of breadth of product use (Hypothe- loadings were constrained. Thus, we did not find support sis 3), alternative provider experience (Hypothesis 5) and for the hypothesized negative interaction between satis- switching experience (Hypothesis 6). Our hypotheses on faction and switching costs (Hypothesis 9). the effects of complexity (Hypothesis 1) and heterogeneity
  • 10. 118 JOURNAL OF THE ACADEMY OF MARKETING SCIENCE SPRING 2003 TABLE 3 TABLE 2 Consequences Structural Model: Antecedents Structural Model: Effects on Intent to Stay Effects on Switching Costs SMC of Standardized Estimates Standardized Intent Procedural Financial Relational Estimates to Stay Conclusion Costs Costs Costs Conclusion Combined model Hypothesis 1: Hypothesis 7: Satisfaction .30*** .31 Supported Complexity .60*** .31*** .05 Mixed support Hypothesis 8a: Procedural costs .20** Supported Hypothesis 2: Hypothesis 8b: Financial costs .15* Supported Heterogeneity .12* .05 .37*** Mixed support Hypothesis 8c: Relational costs .30*** Supported Hypothesis 3: 2 Model fit: χ 1,858 = 3,416, CFI = .97, NFI = .93, p < .000, Breadth of use .21*** .30*** .28*** Supported RMSEA = .053 Hypothesis 4: Modification –.10* .00 .07 Not supported Satisfaction only model Hypothesis 5: Satisfaction .40*** .16 Alternative 2 Model fit: χ 1,861 = 3,477, CFI = .97, NFI = .93, p < .000, experience –.21*** — –.16* Supported RMSEA = .054 Hypothesis 6: Switching Switching costs only model experience –.31*** –.18* –.27*** Supported Procedural costs .15* .30 Risk aversion .14* .05 .24** — Financial costs .13* Time pressure .17** .01 –.06 — Relational costs .44*** SMC of switching 2 Model fit: χ 1,859 = 3,434, CFI = .97, NFI = .93, p < .000, cost .62 .22 .38 RMSEA = .053 2 Model fit: χ 1,858 = 3,416, CFI = .97, NFI = .93, p < .000, NOTE: SMC = squared multiple correlation; CFI = Comparative Fit In- RMSEA = .053 dex; NFI = Normed Fit Index; RMSEA = root mean square error of approximation. NOTE: Dash (—) indicates that relationship is not hypothesized. SMC = *p < .05, one-tailed. **p < .01, one-tailed. ***p < .001, one-tailed. squared multiple correlation; CFI = Comparative Fit Index; NFI = Normed Fit Index; RMSEA = root mean square error of approximation. TABLE 4 *p < .05, one-tailed. **p < .01, one-tailed. ***p < .001, one-tailed. Interaction Structural Models Switching Cost and Chi-Square Satisfaction Interaction Change for DISCUSSION AND Model Constrained Model p Conclusion MANAGERIAL IMPLICATIONS Hypothesis 9a: Procedural switching cost .70, 1 df p > .10 Not supported The Consumer Switching Cost Typology Hypothesis 9b: Financial switching cost .20, 1 df p > .10 Not supported Hypothesis 9c: This research affords managers a set of tools and a Relational switching cost .70, 1 df p > .10 Not supported framework designed to help conceptualize, measure, and manage consumer switching costs. The eight-facet typology developed in this study provides a granular rep- resentation of consumer switching costs, allowing The Antecedents of Switching Costs researchers and practitioners to more finely distinguish different switching cost elements and to consider their Procedural Switching Costs links with other constructs and practices. The more parsi- Our study suggests that consumers’ perceptions of pro- monious three-factor, higher order switching cost cedural switching costs may be increased by increasing typology addresses researchers, and practitioners need to their perceptions of product complexity or provider heter- conceptualize complex constructs more succinctly. ogeneity; by encouraging broader product use; and by Depending on the demands of the question being pursued, reducing, to the extent possible, their experience with the appropriate level of the typology can be employed. For switching between, and using, other providers. One tactic applied managerial decisions or consumer segmentation, for increasing complexity perceptions is educating con- examination of the specific facets of the eight-facet model sumers about the variety of features a product offers. is more appropriate. For conceptualizing areas for expand- Long-distance and credit card companies regularly send ing switching cost research, the higher order model may be inserts with their monthly bills describing new services more useful.
  • 11. Burnham et al. / CONSUMER SWITCHING COSTS 119 and additional features of the services that they offer. bundled products); by offering loyalty programs; and, as Communications that remind existing customers of the noted above, by informing customers of the variety of features that differentiate their provider from competitors products offered. Adding intangible financial services, may also increase customers’ procedural switching costs, such as credit card purchase insurance and payment insur- reduce their search for alternatives (Heide and Weiss 1995; ance, should increase perceptions of complexity and Weiss and Heide 1993), and reduce their intentions to financial switching costs. Finally, as noted above, a greater switch. emphasis on defensive, over offensive, marketing should decrease the switching experience of a firm’s customers Firms seeking to increase their customers’ switching and increase its financial switching costs over time. costs should also consider bundling products and services. While past bundling research has focused on firms’ ability Relational Switching Costs to maximize sales profits through bundling (e.g., Customers’relational switching costs may be increased Stremersch and Tellis 2002; Venkatesh and Mahajan by increasing their perceptions of provider heterogeneity, 1993), our results suggest that bundling may increase cus- by encouraging broader product use, and by reducing the tomer retainability by increasing the breadth of product alternative provider and switching experience of those use and perceptions of offering complexity. Furthermore, acquired. Suggestions for managing each of these ante- by creatively bundling their products, providers can differ- cedents are offered above. Our results support the long- entiate their offerings and increase customer perceptions standing belief that investments in differentiation of provider heterogeneity. strengthen customers’ bonds of identity with a firm. Fur- Finally, firms seeking to increase switching-cost-based thermore, as customers use more types of a providers’ retention should target customers with limited experience products, they appear to enter a more advanced relation- and avoid avid switchers as they are likely to switch again ship stage in which switching is more costly. Finally, con- in the future. While firms with more sophisticated tools are sumers who have less experience with other providers able to assess the risks and rewards of attracting likely appear to perceive stronger ties to their existing providers. switchers, all firms can take steps to ensure they attract Thus, firms may doubly benefit from discounting cross- those consumers less likely to switch away in the future. sales to existing customers, as they may both increase cur- For example, a survey or interview can be used to assess rent breadth of use and preclude customers’ trial of other the prior history of potential customers, a tactic easily providers’ offerings. employed by services like gyms or clubs. Alternatively, customers can be targeted early in their life cycles, a prac- Satisfaction and Switching Costs tice that credit card companies have honed on teens and as Drivers of Customer Retention college students. When potential customers cannot be sur- veyed or known, firms can de-emphasize customer acqui- Our consequence model confirms that satisfaction sition programs that heavily reward switching. A greater drives consumer intentions to stay with an incumbent ser- emphasis on the basic value proposition and building the vice provider. With satisfaction alone, we explain 16 per- switching cost perceptions of existing customers (e.g., cent of the variance in consumer intentions, well within defensive marketing) should lead to slower but more sus- the bounds reported as typical by Szymanski and Henard’s tainable customer growth. (2001) meta-analysis of satisfaction studies. Thus, we sup- Contrary to expectations, we find a negative relation- port the continued emphasis on managing customer ship between modification and consumers’ procedural satisfaction. switching cost perceptions. Consumers may gain product However, we find that switching costs have an even domain expertise while modifying their products, which stronger effect on customer retention, explaining 30 per- reduces the procedural costs they associate with switching cent of the variance in the consumers’ intentions to stay (Alba and Hutchinson 1987). Alternatively, customers with a current provider. We believe this finding is espe- who perceive lower procedural switching costs may also cially noteworthy given our intentional selection of indus- perceive lower costs associated with making modifica- tries, such as the long-distance industry, that are relatively tions, leading them to make more modifications. Further “fluid”—where perceptions of switching costs exist, but research is needed to better understand this relationship. where they are weak enough that switching is still rela- Financial Switching Costs tively easy. Given the limited research on switching cost Customers’ financial switching cost perceptions may management, it appears that marketing’s pursuit of the be increased by augmenting perceptions of product com- customer satisfaction paradigm has blinded it to the plexity, by encouraging broader product use, and by reduc- importance of switching costs, or worse, that the field has ing the switching experience of those acquired. Firms can “blacklisted” switching costs as customer harming and increase the perceived complexity of their offerings via thus unworthy of study. Yet, even if only “passive loyalty” mixed price bundling (e.g., offering independent and is generated by switching costs, such behavioral constraints
  • 12. 120 JOURNAL OF THE ACADEMY OF MARKETING SCIENCE SPRING 2003 maintain customer satisfaction and that they must regu- can prompt relationship-improving investments by larly monitor switching cost perceptions. The former con- encouraging voice over exit (Ping 1997). In addition, cern suggests that switching costs must be managed with switching costs can inhibit consumers from switching an eye toward customer acquisition. While we have immediately after a dissatisfying incident and thereby cre- emphasized the customer retention applications of our ate the delay needed to return to higher global satisfaction model, our findings are equally relevant for customer levels that were perceived before the incident (Bolton and acquisition management. For example, firms need to Drew 1991). Switching costs, like the commitments of lower potential customers’ perceptions of the complexity marriage, may make for better relationships over time. of their products in order to reduce the costs associated All three switching cost types appear to drive consum- with switching “in.” For years, Microsoft promoted the ers’ intentions to stay with their current provider. Spe- simplicity of its operating systems by emphasizing the cifically, increasing current customers’ perceptions of the “Start” button in its advertising. New customers then gen- risks involved in switching (or the safety of staying), the erated set-up and learning switching costs after they difficulty of evaluating alternatives (or the ease of not installed and used Microsoft’s system. However, Fornell’s doing so), the hassles of setting up a new relationship, and concerns do highlight the potential downside of an the learning required to use a new provider will increase overaggressive use of switching costs. Even if few con- customers’ likelihood of remaining in an existing relation- sumers undertake the hyperrational future switching cost ship. Furthermore, increasing the potential of losing bene- assessments presumed by economists (e.g., Beggs and fits or money (or decreasing the costs of staying—Cannon Klemperer 1992), potential customers may search for and Homburg 2001) will increase customers’likelihood of ways to avoid relationships with firms imposing obviously staying, even when no discernable physical assets are burdensome switching costs (such as lock-in contracts), involved. Finally, increasing the strength of customers’ and existing customers may become dissatisfied and seek psychological bonds with a provider’s brand will increase opportunities to undermine firms that unduly constrict people’s likelihood of staying, even in industries with very them (Jones and Sasser 1995). Thus, switching costs must little or no face-to-face contact. Of the three types, we find be managed judiciously, reducing them for potential new that financial switching costs have the weakest impact— customers and increasing them in ways that add value for our study suggests that procedural and relational costs existing consumers’ experiences. loom larger when consumers consider switching. How- ever, generalizations about the relative strength of the switching cost effects must be made with care. Switching CONCLUSION AND FUTURE RESEARCH cost effects are likely to vary across industries as contact levels, physically linked assets, solicitation methods, and This research makes three primary contributions to other product and/or market factors vary. marketing research. First, it provides a typology of the We find no evidence for interactions between switching switching costs that consumers perceive as well as vali- costs and satisfaction. This suggests that switching costs dated scales for measuring those costs. We find consistent remain a valuable tool for fighting the surprisingly preva- evidence for eight distinct consumer switching costs: eco- lent loss of satisfied customers (Jones and Sasser 1995). nomic risk costs, evaluation costs, learning costs, set-up Clearly, firms have strong incentives to ensure that both costs, benefit loss costs, monetary loss costs, personal- satisfaction and switching cost management are well relationship loss costs, and brand relationship loss costs. tended. In addition, both ethical and practical consider- These eight switching costs comprise three higher order ations suggest that firms should seek to increase switching switching cost types: procedural, financial, and relational costs in ways that add value to consumers. By helping cus- switching costs. Given the breadth of the literature from tomers learn how to better use the product, by identifying which the typology is drawn, its consistency across the unique features offered, by offering valuable bonus points industries studied, and its parsimonious nature, we believe or loyalty services, and by engaging customers in a more that the typology should provide a solid foundation for meaningful relationship, firms should seek to simulta- conceptualizing the nature of switching costs for con- neously raise customer switching costs and improve cus- sumer products (goods and services). We encourage future tomer satisfaction. research employing our scales to build on our understand- In managing consumers’ perceived switching costs, ing by exploring its application in new contexts. While the strategists are reminded of two potential problems associ- scales may need to be adapted to suit specific contexts, ated with relying on barriers to exit (Fornell 1992): (1) cus- perceptions of the three major switching cost types should tomer awareness of switching costs may impede customer be found whenever switching is clearly defined. It is acquisition, and (2) switching costs may be neutralized or important to note, however, that with many products (and eliminated by external forces. The latter concern merely especially discontinuous products), consumers can try suggests that firms should not drop their efforts to new offerings without fully switching to them. When this
  • 13. Burnham et al. / CONSUMER SWITCHING COSTS 121 is the case, some of the costs associated with using a new moderators of the relationships studied will enhance the offering will be lower or nonexistent, and the term switch- managerial application of switching costs. For example, ing costs may be inappropriate. It is left to future research- the effects of breadth of product use may depend on the ers to fully distinguish the appropriate contexts for using complementarities between the products purchased from a the terms switching costs, adoption costs, and trial costs single provider and on the physical compatibility between and to identify any differences in the types of costs per- assets used with different providers. Similarly, the effects ceived in each context. of prior experiences may depend on the valence of a con- Second, this research provides a theoretical framework sumer’s experiences with other providers and the switch- of the antecedents that drive consumer switching cost per- ing process and even on the consumer’s switching experi- ceptions. We find that three categories of antecedents— ences in contexts outside of the focal product domain. A market characteristics, consumer investments, and domain longitudinal study could offer insights into how switching expertise—can significantly influence the switching costs cost perceptions, switching experiences, and (behavioral) that consumers perceive. These findings concord with, and loyalty change and affect each other over time. In addition, expand upon, prior switching cost antecedent research switching costs’ effects on intentions to stay may depend (e.g., Alba and Hutchinson 1987; Jackson 1985; on the context in which switching is considered; receiving Samuelson and Zeckhauser 1988) and provide managers a financial offer from a competitor may make salient dif- with a broad theoretical basis for designing specific ferent switching costs than enduring a problem with an switching cost management programs. existing provider. Switching costs’ effects may also Third, this research adds to recent research on switch- depend on such industry characteristics as product usage ing cost consequences (e.g., Bansal and Taylor 1999; and solicitation norms. Finally, research on the relation- Jones et al. 2000) by finding significant effects for three ship between switching costs and satisfaction could assess types of consumer switching costs. Even within industries whether, or when, switching costs lead to dissatisfaction. where objective switching costs are low, we find that the While both self-perception theory and cognitive disso- level and types of costs that consumers associate with nance theory suggest that consumers who are “stuck” in a switching explain their intentions better than their satisfac- behavior will defend the behavior and view themselves as tion does. While this does not suggest that firms should satisfied, a dissatisfied customer who can attribute being abandon the pursuit of customer satisfaction, it does high- stuck to a firm’s actions will certainly feel even more dis- light the need to understand, measure, and manage switch- satisfied. But can switching costs independently lead to ing cost perceptions. dissatisfaction? Studies providing answers to such ques- Many interesting switching cost management ques- tions will extend our ability to manage the dynamic, con- tions await future researchers. Additional research on the textual effects of consumer switching costs.
  • 14. 122 JOURNAL OF THE ACADEMY OF MARKETING SCIENCE SPRING 2003 APPENDIX TABLE A1 Switching Cost Scale Items, Loadings, Reliabilities, Means, and Standard Deviations Standardized Item Loading Coefficient Alpha Mean Standard Deviation Long- Credit Long- Credit Long- Credit Long- Credit Scale Distance Card Distance Card Distance Card Distance Card Economic Risk Costs .85 .87 3.37 3.02 0.81 0.94 I worry that the service offered by other service providers won’t work as well as expected. .72 .69 If I try to switch service providers, I might end up with bad service for a while. .60 .72 Switching to a new service provider will probably involve hidden costs/charges. .75 .73 I am likely to end up with a bad deal financially if I switch to a new service provider. .74 .72 Switching to a new service provider will probably result in some unexpected hassle. .74 .78 I don’t know what I’ll end up having to deal with while switching to a new service provider. .70 .80 Evaluation Costs .80 .83 3.55 3.26 0.84 0.98 I cannot afford the time to get the information to fully evaluate other service providers. .68 .79 How much time/effort does it take to get the information you need to feel comfortable evaluating new service providers? (very little . . . a lot) .65 .72 Comparing the benefits of my service provider with the benefits of other service providers takes too much time/effort, even when I have the information. .66 .69 It is tough to compare the other service providers. .87 .78 Learning Costs .85 .85 2.93 2.88 0.91 0.94 Learning to use the features offered by a new service provider as well as I use my service would take time. .68 .78 There is not much involved in understanding a new service provider well. (r) .77 .69 Even after switching, it would take effort to “get up to speed” with a new service. .79 .81 Getting used to how another service provider works would be easy. (r) .84 .79 Set-Up Costs .74 .80 3.13 3.04 0.85 0.97 It takes time to go through the steps of switching to a new service provider. .64 .67 Switching service providers involves an unpleasant sales process. .61 .80 The process of starting up with a new service is quick/easy. (r) .70 .77 There are a lot of formalities involved in switching to a new service provider. .68 .79 Benefit Loss Costs .81 .76 2.50 2.84 1.15 1.28 Switching to a new service provider would mean losing or replacing points, credits, services, and so on that I have accumulated with my service provider. .74 .71 How much would you lose in credits, accumulated points, services you have already paid for, and so on if you switched to a new service provider? (lose nothing . . . lose a lot) .89 .90 I will lose benefits of being a long-term customer if I leave my service provider. .70 .58 Monetary Loss Costs .72 .71 2.58 2.41 0.98 1.01 Switching to a new service provider would involve some up-front costs (set-up fees, membership fees, deposits, etc.). .68 .67