SlideShare uma empresa Scribd logo
1 de 3
Baixar para ler offline
NatCatSERVICE

Loss events worldwide 2013
Overall and insured losses per continent
Overall losses

5%

41%

Insured losses –
percentage share of
overall losses

46%

<1%
Continent
N. America

1,300

Europe

54%

37,500

S. America

<1%

Overall
losses
US$ m

22,500

Africa
Asia
Australia/

Source: Munich Re, NatCatSERVICE, 2014

© 2014 Münchener Rückversicherungs-Gesellschaft, Geo Risks Research – As at January 2014

Oceania

210
60,000
3,500
NatCatSERVICE

Loss events worldwide 2013 vs. 1980 – 2012
Overall losses US$ 125bn (2013), 115bn (1980 – 2012 mean)
Continent

15%

37%

41%

Overall
losses
US$ m

N. America

37,500
1,300

Europe

18%

S. America

22,500
210

Africa

30%

48%

60,000

Asia
Australia/

3,500

Oceania

1%
<1%

1980 – 2012 mean*
N. America

1%

3%
3%

43,000

S. America

3,500

Europe

17,000

Africa

1,400

Asia

3%

47,000

Australia/
Source: Munich Re, NatCatSERVICE, 2014

3,200

Oceania
* in 2013 values

© 2014 Münchener Rückversicherungs-Gesellschaft, Geo Risks Research – As at January 2014
NatCatSERVICE

Loss events worldwide 2013 vs. 1980 – 2012
Insured losses US$ 31bn (2013), 30bn (1980 – 2012 mean)
Continent
N. America

29%
56%

Minor
9,000
Minor

Asia

10%

S. America

Africa

13%

17,000

Europe

16%

65%

Insured
losses
US$ m

3,000

Australia/

1,600

Oceania

<1%
<1%

1980 – 2012 mean*
N. America

1%
<1%

5%
5%

19,400

S. America

0,400

Europe

4,800

Africa

Minor

Asia

4,000

Australia/
Source: Munich Re, NatCatSERVICE, 2014

1,400

Oceania
* in 2013 values

© 2014 Münchener Rückversicherungs-Gesellschaft, Geo Risks Research – As at January 2014

Mais conteúdo relacionado

Mais de haemmerle-consulting

Munich RE Naturkatastrophen 2013 Überblick
Munich RE Naturkatastrophen 2013 ÜberblickMunich RE Naturkatastrophen 2013 Überblick
Munich RE Naturkatastrophen 2013 Überblickhaemmerle-consulting
 
The hard realities of earthquake recovery for seattle
The hard realities of earthquake recovery for seattleThe hard realities of earthquake recovery for seattle
The hard realities of earthquake recovery for seattlehaemmerle-consulting
 
Iso 22301 - der neue Standard für Business Continuity Management
Iso 22301 - der neue Standard für Business Continuity ManagementIso 22301 - der neue Standard für Business Continuity Management
Iso 22301 - der neue Standard für Business Continuity Managementhaemmerle-consulting
 
Umfrageergebnisse "BC Manager Agenda 2012"
Umfrageergebnisse "BC Manager Agenda 2012"Umfrageergebnisse "BC Manager Agenda 2012"
Umfrageergebnisse "BC Manager Agenda 2012"haemmerle-consulting
 
Kochbuch für eine BIA von bcm news
Kochbuch für eine BIA von bcm newsKochbuch für eine BIA von bcm news
Kochbuch für eine BIA von bcm newshaemmerle-consulting
 
Alarmierung und Kommunikation im BCM
Alarmierung und Kommunikation im BCMAlarmierung und Kommunikation im BCM
Alarmierung und Kommunikation im BCMhaemmerle-consulting
 

Mais de haemmerle-consulting (19)

Munich RE Naturkatastrophen 2013 Überblick
Munich RE Naturkatastrophen 2013 ÜberblickMunich RE Naturkatastrophen 2013 Überblick
Munich RE Naturkatastrophen 2013 Überblick
 
Global Climate Risk Index 2014
Global Climate Risk Index 2014Global Climate Risk Index 2014
Global Climate Risk Index 2014
 
Supply chain-resilience-2013-en
Supply chain-resilience-2013-enSupply chain-resilience-2013-en
Supply chain-resilience-2013-en
 
BCM Standards und Good Practices
BCM Standards und Good PracticesBCM Standards und Good Practices
BCM Standards und Good Practices
 
BCAW 2013 poster english
BCAW 2013 poster englishBCAW 2013 poster english
BCAW 2013 poster english
 
Audit des BCM
Audit des BCMAudit des BCM
Audit des BCM
 
kes BCM in der Supply Chain
kes BCM in der Supply Chainkes BCM in der Supply Chain
kes BCM in der Supply Chain
 
Tests und übungen
Tests und übungenTests und übungen
Tests und übungen
 
BCM Planung
BCM PlanungBCM Planung
BCM Planung
 
BCM Lifecycle
BCM LifecycleBCM Lifecycle
BCM Lifecycle
 
BCM Strategien
BCM StrategienBCM Strategien
BCM Strategien
 
Krisenmanagement Case Study
Krisenmanagement Case StudyKrisenmanagement Case Study
Krisenmanagement Case Study
 
The hard realities of earthquake recovery for seattle
The hard realities of earthquake recovery for seattleThe hard realities of earthquake recovery for seattle
The hard realities of earthquake recovery for seattle
 
BCI Supply Chain Resilience 2012
BCI Supply Chain Resilience 2012BCI Supply Chain Resilience 2012
BCI Supply Chain Resilience 2012
 
Iso 22301 - der neue Standard für Business Continuity Management
Iso 22301 - der neue Standard für Business Continuity ManagementIso 22301 - der neue Standard für Business Continuity Management
Iso 22301 - der neue Standard für Business Continuity Management
 
BCM Stakeholder Management
BCM Stakeholder ManagementBCM Stakeholder Management
BCM Stakeholder Management
 
Umfrageergebnisse "BC Manager Agenda 2012"
Umfrageergebnisse "BC Manager Agenda 2012"Umfrageergebnisse "BC Manager Agenda 2012"
Umfrageergebnisse "BC Manager Agenda 2012"
 
Kochbuch für eine BIA von bcm news
Kochbuch für eine BIA von bcm newsKochbuch für eine BIA von bcm news
Kochbuch für eine BIA von bcm news
 
Alarmierung und Kommunikation im BCM
Alarmierung und Kommunikation im BCMAlarmierung und Kommunikation im BCM
Alarmierung und Kommunikation im BCM
 

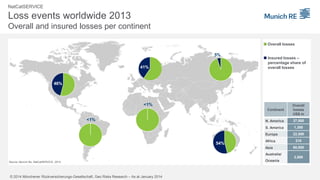
Schäden aus Naturkatastrophen 2013 per Kontinent

  • 1. NatCatSERVICE Loss events worldwide 2013 Overall and insured losses per continent Overall losses 5% 41% Insured losses – percentage share of overall losses 46% <1% Continent N. America 1,300 Europe 54% 37,500 S. America <1% Overall losses US$ m 22,500 Africa Asia Australia/ Source: Munich Re, NatCatSERVICE, 2014 © 2014 Münchener Rückversicherungs-Gesellschaft, Geo Risks Research – As at January 2014 Oceania 210 60,000 3,500
  • 2. NatCatSERVICE Loss events worldwide 2013 vs. 1980 – 2012 Overall losses US$ 125bn (2013), 115bn (1980 – 2012 mean) Continent 15% 37% 41% Overall losses US$ m N. America 37,500 1,300 Europe 18% S. America 22,500 210 Africa 30% 48% 60,000 Asia Australia/ 3,500 Oceania 1% <1% 1980 – 2012 mean* N. America 1% 3% 3% 43,000 S. America 3,500 Europe 17,000 Africa 1,400 Asia 3% 47,000 Australia/ Source: Munich Re, NatCatSERVICE, 2014 3,200 Oceania * in 2013 values © 2014 Münchener Rückversicherungs-Gesellschaft, Geo Risks Research – As at January 2014
  • 3. NatCatSERVICE Loss events worldwide 2013 vs. 1980 – 2012 Insured losses US$ 31bn (2013), 30bn (1980 – 2012 mean) Continent N. America 29% 56% Minor 9,000 Minor Asia 10% S. America Africa 13% 17,000 Europe 16% 65% Insured losses US$ m 3,000 Australia/ 1,600 Oceania <1% <1% 1980 – 2012 mean* N. America 1% <1% 5% 5% 19,400 S. America 0,400 Europe 4,800 Africa Minor Asia 4,000 Australia/ Source: Munich Re, NatCatSERVICE, 2014 1,400 Oceania * in 2013 values © 2014 Münchener Rückversicherungs-Gesellschaft, Geo Risks Research – As at January 2014