SlideShare uma empresa Scribd logo
1 de 5
Baixar para ler offline
Emily Mendell, NVCA, 610-565-3904, emendell@nvca.org
Joshua Radler, Thomson Venture Economics, 646-822-7323, Joshua.radler@thomson.com

         VENTURE-BACKED IPO ACTIVITY WEAK IN Q4 AND FULL YEAR;
  ACQUISITIONS MARKET CARRIED 2005 EXITS FOR VENTURE-BACKED COMPANIES

New York, NY- January 3, 2006 – Seventeen venture-backed companies raised $1.6 billion through initial
public offerings (IPOs) and 78 venture-backed acquisitions were reported in the fourth quarter of 2005,
according to the Exit Poll report by Thomson Venture Economics and the National Venture Capital
Association (NVCA). The fourth quarter exit activity mirrored the full year 2005 which was characterized
by a significantly weak IPO market propped up by a stronger acquisitions market. For the full year 2005,
fifty-six venture-backed IPOs raised a total of $4.5 billion representing a 40% decline in volume from 2004
while the acquisitions market saw 330 transactions with a disclosed value of $14.4 billion, similar to the
previous year.

                             Venture-Backed Liquidity Events by Year/Quarter, 2000-2005
                                                    Total                                  Total     Average
                                    M&A Deals                   **Average
                                                    M&A                                    IPO         IPO
                                       with       Disclosed     M&A Deal                   Offer      Offer
                    Total M&A       Disclosed       Value          Size      ***Number    Amount     Amount
     Quarter/Year                    Values          ($M)          ($M)                    ($M)       ($M)
                      Deals                                                    of IPOs
     2000              317              203        68,492.1       338.4         264       25,499.4    96.6
     2001              353              165        16,798.9       101.8          41       3,489.9     85.1
     2002              316              151         7,874.4        52.1          24       2,473.5     103.1
     2003-1             69               21         1,453.3        69.2           1         77.2      77.2
     2003-2             75               27         1,841.9        68.2           2        164.0      82.0
     2003-3             78               41         2,127.7        51.9           9        732.8      81.4
     2003-4             71               34         2,303.2        67.7          17       1,048.7     61.7
     2003              293              123         7,726.1        62.8          29       2,022.7     69.7
     2004-1             80               45         3,921.0        87.1          13       2,721.1     209.3
     2004-2             89               48         4,514.6        94.1          29       2,077.8     71.6
     2004-3             86               46         4,140.1        90.0          24       3,225.6     134.4
     2004-4             84               46         2,862.2        62.2          27       2,990.4     110.8
     2004              339              185        15,437.9        83.4          93       11,014.9    118.4
     2005-1             80               45         4,209.9        93.6          10        720.7      72.1
     2005-2             76               32         3,691.0       115.3          10        714.1      71.5
     2005-3             96               46         4,094.8        89.0          19       1,458.1     76.7
     2005-4*            78               34         2368.8         69.7          17       1,568.1     92.2
     2005              330              157        14,364.4        91.5          56       4,461.0     79.7
        Thomson Venture Economics & National Venture Capital Association
        Data comprises transactions reported as closing as of 12/30/05
        *Q4 2005 M&A data is preliminary and subject to change
        **Only accounts for deals with disclosed values
        ***Includes all companies with at least one U.S. VC investor that trade on U.S. exchanges,
        regardless of domicile
According to Mark Heesen, president of the NVCA, the venture capital exit market was characterized in
2005 by a lackluster IPO market, which can be attributed to a number of factors.

“For the IPO market to improve, we need relief from certain hurdles associated with the Sarbanes Oxley
Act, but we also need an investing public that is bullish on technology,” said Heesen. “Investors have every
reason to have confidence in the venture-backed companies in registration today. Most have survived the
boom and the bust, which speaks to the soundness of their business models and the strength of their
discipline. They have weathered significant difficulties and understand excess and how to avoid it. Once
the market begins to accept these organizations and that is reflected in their share prices, emerging
companies will consider the IPO path once again.”

IPO Activity Highlights
The fourth quarter of 2005 was dominated by the Technology sector, which saw ten venture-backed IPOs
raise $1.1 billion. The Technology sector also contained the largest IPO of the fourth quarter and the year,
with IntercontinentalExchange, Inc.’s $415.9 million offering. IntercontinentalExchange was backed by
TA Associates and Goldman, Sachs & Co. The second largest IPO of the quarter, DealerTrack, Inc., was
also from the Technology sector. DealerTrack raised $170.0 million and was backed by J.P. Morgan
Partners and GRP Partners. The Life Sciences sector had five venture-backed IPOs raise a total of $191.2
million in the fourth quarter. The largest Life Sciences IPOs in the quarter were NxStage Medical, Inc. and
Somaxon Pharmaceuticals, Inc., which both raised $55.0 million.

In 2005, the Technology sector saw 26 venture-backed companies raise a total of $2.6 billion, with the
Internet Specific category leading the sector with ten IPOs raising $1.3 billion. The Life Sciences sector
saw 23 companies raise a total of $1.2 billion, while Non-high Technology had seven IPOs raise $727.6
million. The two largest IPOs of 2005, IntercontinentalExchange, Inc. and OptionsXpress, Inc., were from
the Technology sector. The third largest venture-backed IPO of the year, Focus Media, came from the
Non-high Technology sector. As of December 30th, 33 of the 56 companies, or 59%, were trading at or
above their offering price.

                                               IPO Industry Breakdown
                                                        Q4 2005             Full-Year 2005

                                                    *Number      Total     *Number
                                                        of      Venture        of        Total
                                                     Venture    Backed      Venture    Venture
                                                     Backed     Offering    Backed      Backed
                                                     IPO's in     Size      IPO's in   Offering
                          Industry                   the U.S.    ($M)       the U.S.   Size ($M)
                           Internet Specific           4         602.1        10        1,259.3
                           Semiconductors              3         240.5        7         570.1
                           Communications/Media        2         103.5        4         315.8
                           Computer Software           1         170.0        3         356.5
                           Computer Hardware           --          --         2          55.2
             Technology    TOTAL                       10       1,116.1       26        2,556.9
                           Medical/Health              4         136.2        13        670.0
                           Biotechnology               1         55.0         10        506.4
                Life
              Sciences     TOTAL                       5         191.2        23        1,176.4
                           Non-high Technology         2         260.8        7         727.6
                Other      TOTAL                       2         260.8        7         727.6
         Thomson Venture Economics & National Venture Capital Association

         *Includes all companies with at least one U.S. VC investor that trade on U.S. exchanges,
regardless of domicile
There are currently only 16 companies ‘in registration’ with the Securities and Exchange Commission,
      meaning they have filed during 2005 and are currently preparing for their initial public offerings. This
      compares with 57 venture-backed companies that were in registration at the end of 2004.

      Merger and Acquisition Highlights
      Venture-backed M&A activity remained strong for the second consecutive year, carrying forward the
      recovery from the post-bubble trough. Based on data collected as of December 30, 2005, the number of
      transactions for the year held steady at 330 compared to 339 in 2004. The average disclosed deal value
      rose in 2005 to $91.5 million from $83.4 million in 2004.

      Daniel Benkert, senior analyst at Thomson Financial said, “We have entered a short-term period of stasis,
      where the mass of those bubble-era companies are finally reaching a level of maturity worthy of a
      profitable exit. Considering the uncertain state of the IPO option, the M&A market remains healthy and we
      are probably seeing that market coming to a plateau, but a reasonably sustainable and very rational one.”

                                             M&A Industry Breakdown

                                                  Q4 2005                                    Full-Year 2005

                                                                       Total     *Number                           Total
                                                                      Venture        of                           Venture
                                     *Number         *Number of       Backed      Venture       *Number of        Backed
                                                                     Disclosed    Backed                         Disclosed
                                    of Venture    Venture Backed                             Venture Backed
                                      Backed             M&A            Deal        M&A             M&A             Deal
                                    M&A deals     (disclosed)deals     Value      deals in   (disclosed)deals      Value
             Industry                                                   ($M)      the U.S.                          ($M)
                                    in the U.S.       in the U.S.                                in the U.S.
             Internet Specific          20               9             452.0        76             36             3408.1
             Semiconductors              6               4             173.7        14              6              281.2
             Communications/Media        4               3             81.0         31             15             2316.8
             Computer Software          24               7             675.7       109             50             3462.7
             Computer Hardware           5               3             69.9         13              6              233.9
Technology   TOTAL                      59              26            1,452.2      243             113            9,702.6
             Medical/Health             11               5             682.5        46             25             3277.0
             Biotechnology               4               1             113.5        12              4              699.5
   Life
 Sciences    TOTAL                      15               6             796.0        58             29             3,976.5
             Non-high Technology         4               2             120.4        29             15              685.2
  Other      TOTAL*                     78              34            2,368.8      330             157           14,364.4

      *Q 4 2005 M&A numbers are preliminary and are subject to change


      The Software sector saw the most transactions in the fourth quarter at 24 followed closely by the Internet –
      Specific sector at 20. These sectors also hold the number one and two positions for the full year 2005 at
      109 and 76 deals respectively. Life Sciences, which includes biotechnology and medical devices, saw 15
      deals in the fourth quarter and 58 deals for the full year.
Analysis of M& A Transaction Values versus Amount Invested


                      Relationship between transaction
                                                                 2004        2005
                      value and investment


                      Deals where transaction value is less
                      than total venture investment               62          48


                      Deals where transaction value is 1-4x
                      total venture investment                    61          58


                      Deals where transaction value is 4x-
                      10x total venture investment                39          30


                      Deals where transaction value is
                                                                  21          18
                      greater than 10x venture investment


                      Total Disclosed Deals                       183         154


Source: Thomson Venture Economics & National Venture Capital Association
 * In 2004, 185 deals had disclosed values, but two of these targets did not have a
   disclosed total investment amount.
 ** In 2005, 157 deals had disclosed values, but three of these targets did not have a disclosed total
investment amount.

An analysis of the returns these acquisitions generated in transaction values shows a market with a strong
degree of symmetry with regard to the level of success that can be expected using the M&A liquidity
option. Both 2004 and 2005 follow the same pattern, with roughly 1/3 of deals returning at least 4x or
greater the investment, 1/3 returning 1x – 4x the investment, and 1/3 bringing in less than the amount
invested.


Thomson Venture Economics, a Thomson Financial company, is the foremost information provider for
equity professionals worldwide. Venture Economics offers an unparalleled range of products from
directories to conferences, journals, newsletters, research reports, and the VentureXpert™ database. For
over 40 years, Venture Economics has been tracking the venture capital and buyouts industry. Since 1961,
it has been a recognized source for comprehensive analysis of investment activity and performance of the
private equity industry. Venture Economics maintains a long-standing relationship within the private equity
investment community, in-depth industry knowledge, and proprietary research techniques. Private equity
managers and institutional investors alike consider Venture Economics information to be the industry
standard. For more information about Venture Economics, please visit www.ventureeconomics.com.

Thomson Financial
Thomson Financial is a US$1.73 billion provider of information and technology solutions to the worldwide
financial community. Through the widest range of products and services in the industry, Thomson
Financial helps clients in more than 70 countries make better decisions, be more productive and achieve
superior results. Thomson Financial is part of The Thomson Corporation (www.thomson.com), a global
leader in providing integrated information solutions to more than 20 million business and professional
customers in the fields of law, tax, accounting, financial services, higher education, reference information,
corporate e-learning and assessment, scientific research and healthcare. With revenues of US$8.10 billion,
The Thomson Corporation lists its common shares on the New York and Toronto stock exchanges (NYSE:
TOC; TSX: TOC).

The National Venture Capital Association (NVCA) represents approximately 460 venture capital and
private equity firms. NVCA's mission is to foster greater understanding of the importance of venture capital
to the U.S. economy, and support entrepreneurial activity and innovation. According to a 2004 Global
Insight study, venture-backed companies accounted for 10.1 million jobs and $1.8 trillion in revenue in the
United States in 2003. The NVCA represents the public policy interests of the venture capital community,
strives to maintain high professional standards, provides reliable industry data, sponsors professional
development, and facilitates interaction among its members. For more information about the NVCA, please
visit www.nvca.org.

Mais conteúdo relacionado

Mais procurados

Q3 '05 venture backed IPOs & M&As
  	Q3 '05 venture backed IPOs & M&As   	Q3 '05 venture backed IPOs & M&As
Q3 '05 venture backed IPOs & M&As mensa25
 
Venture Backed Exits - Q4 2008
 	Venture Backed Exits - Q4 2008  	Venture Backed Exits - Q4 2008
Venture Backed Exits - Q4 2008 mensa25
 
Venture Backed M&A's Q1 2005
Venture Backed M&A's Q1 2005 Venture Backed M&A's Q1 2005
Venture Backed M&A's Q1 2005 mensa25
 
Venture Backed Exits Q3 2008 - Capital Markets Crisis Remains
 	Venture Backed Exits Q3 2008 - Capital Markets Crisis Remains   	Venture Backed Exits Q3 2008 - Capital Markets Crisis Remains
Venture Backed Exits Q3 2008 - Capital Markets Crisis Remains mensa25
 
Q2 ’04 IPO Activity
 	Q2 ’04 IPO Activity 	Q2 ’04 IPO Activity
Q2 ’04 IPO Activitymensa25
 
Q4 Venture Backed IPOs
Q4 Venture Backed IPOsQ4 Venture Backed IPOs
Q4 Venture Backed IPOsmensa25
 
Daily Newsletter for 8th November, 2010
Daily Newsletter for 8th November, 2010Daily Newsletter for 8th November, 2010
Daily Newsletter for 8th November, 2010Fullerton Securities
 
Apresentação call 2 t12_eng
Apresentação call 2 t12_engApresentação call 2 t12_eng
Apresentação call 2 t12_engArteris S.A.
 
Global CDO market Issuance Data
Global CDO market Issuance DataGlobal CDO market Issuance Data
Global CDO market Issuance Datafinancedude
 
Market outlook 18 10 10
Market outlook 18 10 10Market outlook 18 10 10
Market outlook 18 10 10Angel Broking
 
Health Insurance Report
Health Insurance ReportHealth Insurance Report
Health Insurance ReportJugal Rasilay
 
DAILY EQUTY REPORT BY EPIC RESEARCH-03 JULY 2012
DAILY EQUTY REPORT BY EPIC RESEARCH-03 JULY 2012DAILY EQUTY REPORT BY EPIC RESEARCH-03 JULY 2012
DAILY EQUTY REPORT BY EPIC RESEARCH-03 JULY 2012Epic Research Limited
 
The Emergence of Private Equity in Asia
The Emergence of Private Equity in AsiaThe Emergence of Private Equity in Asia
The Emergence of Private Equity in AsiaTuck Seng Low
 
Market outlook 08 06-10
Market outlook 08 06-10Market outlook 08 06-10
Market outlook 08 06-10Angel Broking
 
DAILY EQUTY REPORT BY EPIC RESEARCH-06 JULY 2012
DAILY EQUTY REPORT BY EPIC RESEARCH-06 JULY 2012DAILY EQUTY REPORT BY EPIC RESEARCH-06 JULY 2012
DAILY EQUTY REPORT BY EPIC RESEARCH-06 JULY 2012Epic Research Limited
 
Market outlook 01 10 10
Market outlook 01 10 10Market outlook 01 10 10
Market outlook 01 10 10Angel Broking
 

Mais procurados (18)

Q3 '05 venture backed IPOs & M&As
  	Q3 '05 venture backed IPOs & M&As   	Q3 '05 venture backed IPOs & M&As
Q3 '05 venture backed IPOs & M&As
 
Venture Backed Exits - Q4 2008
 	Venture Backed Exits - Q4 2008  	Venture Backed Exits - Q4 2008
Venture Backed Exits - Q4 2008
 
Venture Backed M&A's Q1 2005
Venture Backed M&A's Q1 2005 Venture Backed M&A's Q1 2005
Venture Backed M&A's Q1 2005
 
Venture Backed Exits Q3 2008 - Capital Markets Crisis Remains
 	Venture Backed Exits Q3 2008 - Capital Markets Crisis Remains   	Venture Backed Exits Q3 2008 - Capital Markets Crisis Remains
Venture Backed Exits Q3 2008 - Capital Markets Crisis Remains
 
Q2 ’04 IPO Activity
 	Q2 ’04 IPO Activity 	Q2 ’04 IPO Activity
Q2 ’04 IPO Activity
 
Q4 Venture Backed IPOs
Q4 Venture Backed IPOsQ4 Venture Backed IPOs
Q4 Venture Backed IPOs
 
Daily Newsletter for 8th November, 2010
Daily Newsletter for 8th November, 2010Daily Newsletter for 8th November, 2010
Daily Newsletter for 8th November, 2010
 
Apresentação call 2 t12_eng
Apresentação call 2 t12_engApresentação call 2 t12_eng
Apresentação call 2 t12_eng
 
Global CDO market Issuance Data
Global CDO market Issuance DataGlobal CDO market Issuance Data
Global CDO market Issuance Data
 
Market outlook 18 10 10
Market outlook 18 10 10Market outlook 18 10 10
Market outlook 18 10 10
 
Health Insurance Report
Health Insurance ReportHealth Insurance Report
Health Insurance Report
 
Finalaya daily wrap_01feb2013
Finalaya daily wrap_01feb2013Finalaya daily wrap_01feb2013
Finalaya daily wrap_01feb2013
 
AZN/ALXN
AZN/ALXNAZN/ALXN
AZN/ALXN
 
DAILY EQUTY REPORT BY EPIC RESEARCH-03 JULY 2012
DAILY EQUTY REPORT BY EPIC RESEARCH-03 JULY 2012DAILY EQUTY REPORT BY EPIC RESEARCH-03 JULY 2012
DAILY EQUTY REPORT BY EPIC RESEARCH-03 JULY 2012
 
The Emergence of Private Equity in Asia
The Emergence of Private Equity in AsiaThe Emergence of Private Equity in Asia
The Emergence of Private Equity in Asia
 
Market outlook 08 06-10
Market outlook 08 06-10Market outlook 08 06-10
Market outlook 08 06-10
 
DAILY EQUTY REPORT BY EPIC RESEARCH-06 JULY 2012
DAILY EQUTY REPORT BY EPIC RESEARCH-06 JULY 2012DAILY EQUTY REPORT BY EPIC RESEARCH-06 JULY 2012
DAILY EQUTY REPORT BY EPIC RESEARCH-06 JULY 2012
 
Market outlook 01 10 10
Market outlook 01 10 10Market outlook 01 10 10
Market outlook 01 10 10
 

Destaque

Palin Report / Branchflower Report OFFICIAL FINAL Full Text with Gov.'s Press...
Palin Report / Branchflower Report OFFICIAL FINAL Full Text with Gov.'s Press...Palin Report / Branchflower Report OFFICIAL FINAL Full Text with Gov.'s Press...
Palin Report / Branchflower Report OFFICIAL FINAL Full Text with Gov.'s Press...mensa25
 
Q3 ‘04 Venture Capital Performance
Q3 ‘04 Venture Capital Performance Q3 ‘04 Venture Capital Performance
Q3 ‘04 Venture Capital Performance mensa25
 
Sarah Palin Speaking At The Rnc+08
Sarah Palin Speaking At The Rnc+08Sarah Palin Speaking At The Rnc+08
Sarah Palin Speaking At The Rnc+08mensa25
 
Top 10 Sarah Palin Look Alikes
Top 10 Sarah Palin Look AlikesTop 10 Sarah Palin Look Alikes
Top 10 Sarah Palin Look Alikesmensa25
 
Sarah Palin Troopergate Report
Sarah Palin Troopergate ReportSarah Palin Troopergate Report
Sarah Palin Troopergate Reportmensa25
 
Palin Mask
Palin MaskPalin Mask
Palin Maskmensa25
 
NIST Corporate Venture Capital Study
 	NIST Corporate Venture Capital Study 	NIST Corporate Venture Capital Study
NIST Corporate Venture Capital Studymensa25
 
Venture Capital Investment Q4 04 – MoneyTree Survey
Venture Capital Investment Q4 04 – MoneyTree Survey Venture Capital Investment Q4 04 – MoneyTree Survey
Venture Capital Investment Q4 04 – MoneyTree Survey mensa25
 

Destaque (8)

Palin Report / Branchflower Report OFFICIAL FINAL Full Text with Gov.'s Press...
Palin Report / Branchflower Report OFFICIAL FINAL Full Text with Gov.'s Press...Palin Report / Branchflower Report OFFICIAL FINAL Full Text with Gov.'s Press...
Palin Report / Branchflower Report OFFICIAL FINAL Full Text with Gov.'s Press...
 
Q3 ‘04 Venture Capital Performance
Q3 ‘04 Venture Capital Performance Q3 ‘04 Venture Capital Performance
Q3 ‘04 Venture Capital Performance
 
Sarah Palin Speaking At The Rnc+08
Sarah Palin Speaking At The Rnc+08Sarah Palin Speaking At The Rnc+08
Sarah Palin Speaking At The Rnc+08
 
Top 10 Sarah Palin Look Alikes
Top 10 Sarah Palin Look AlikesTop 10 Sarah Palin Look Alikes
Top 10 Sarah Palin Look Alikes
 
Sarah Palin Troopergate Report
Sarah Palin Troopergate ReportSarah Palin Troopergate Report
Sarah Palin Troopergate Report
 
Palin Mask
Palin MaskPalin Mask
Palin Mask
 
NIST Corporate Venture Capital Study
 	NIST Corporate Venture Capital Study 	NIST Corporate Venture Capital Study
NIST Corporate Venture Capital Study
 
Venture Capital Investment Q4 04 – MoneyTree Survey
Venture Capital Investment Q4 04 – MoneyTree Survey Venture Capital Investment Q4 04 – MoneyTree Survey
Venture Capital Investment Q4 04 – MoneyTree Survey
 

Semelhante a Venture-backed IPO & Acquisitions Q4 05

Q3 '05 venture backed IPOs & M&As
Q3 '05 venture backed IPOs & M&As Q3 '05 venture backed IPOs & M&As
Q3 '05 venture backed IPOs & M&As mensa25
 
Q3 '05 venture backed IPOs & M&As
Q3 '05 venture backed IPOs & M&As Q3 '05 venture backed IPOs & M&As
Q3 '05 venture backed IPOs & M&As mensa25
 
Venture Backed Exits Q2 2008 - NVCA Declares Capital Crisis for Start Up C...
  	Venture Backed Exits Q2 2008 - NVCA Declares Capital Crisis for Start Up C...  	Venture Backed Exits Q2 2008 - NVCA Declares Capital Crisis for Start Up C...
Venture Backed Exits Q2 2008 - NVCA Declares Capital Crisis for Start Up C...mensa25
 
VC Fundraising Q2 2005
  	VC Fundraising Q2 2005   	VC Fundraising Q2 2005
VC Fundraising Q2 2005 mensa25
 
Venture-Backed Exits - Q1 '06
  	Venture-Backed Exits - Q1 '06   	Venture-Backed Exits - Q1 '06
Venture-Backed Exits - Q1 '06 mensa25
 
Venture-Backed M&A's Q2 '05
  	Venture-Backed M&A's Q2 '05   	Venture-Backed M&A's Q2 '05
Venture-Backed M&A's Q2 '05 mensa25
 
Venture-Backed M&A's Q2 '05
Venture-Backed M&A's Q2 '05 Venture-Backed M&A's Q2 '05
Venture-Backed M&A's Q2 '05 mensa25
 
Venture-Backed IPO Market Shows Signs of Life in Third Quart
 	Venture-Backed IPO Market Shows Signs of Life in Third Quart 	Venture-Backed IPO Market Shows Signs of Life in Third Quart
Venture-Backed IPO Market Shows Signs of Life in Third Quartmensa25
 
Q3 04 Venture-Backed IPOs
 	Q3 04 Venture-Backed IPOs 	Q3 04 Venture-Backed IPOs
Q3 04 Venture-Backed IPOsmensa25
 
Venture-Backed IPO Market Activity Continues to Lag
 	Venture-Backed IPO Market Activity Continues to Lag 	Venture-Backed IPO Market Activity Continues to Lag
Venture-Backed IPO Market Activity Continues to Lagmensa25
 
Q1 ’05 Venture-Backed IPOs
  	Q1 ’05 Venture-Backed IPOs   	Q1 ’05 Venture-Backed IPOs
Q1 ’05 Venture-Backed IPOs mensa25
 
VC Fundraising Q2 2005
  	VC Fundraising Q2 2005   	VC Fundraising Q2 2005
VC Fundraising Q2 2005 mensa25
 
May Strong for VC Backed IPOs
 	May Strong for VC Backed IPOs  	May Strong for VC Backed IPOs
May Strong for VC Backed IPOs mensa25
 
Venture Capital Fundraising Q1 05
Venture Capital Fundraising Q1 05 Venture Capital Fundraising Q1 05
Venture Capital Fundraising Q1 05 mensa25
 
Venture-Backed Mergers And Acquisitions Benefitted From Rising Valuation In...
 	Venture-Backed Mergers And Acquisitions Benefitted From Rising Valuation In... 	Venture-Backed Mergers And Acquisitions Benefitted From Rising Valuation In...
Venture-Backed Mergers And Acquisitions Benefitted From Rising Valuation In...mensa25
 
VC Fundraising Q3 2005
  	VC Fundraising Q3 2005   	VC Fundraising Q3 2005
VC Fundraising Q3 2005 mensa25
 
Venture-Backed M&A Activity Witnesses Slight Uptick in Q2
Venture-Backed M&A Activity Witnesses Slight Uptick in Q2Venture-Backed M&A Activity Witnesses Slight Uptick in Q2
Venture-Backed M&A Activity Witnesses Slight Uptick in Q2mensa25
 
Venture Capital Fundraising Q3 06
 	Venture Capital Fundraising Q3 06   	Venture Capital Fundraising Q3 06
Venture Capital Fundraising Q3 06 mensa25
 
Number of Venture-Backed Companies Acquired in the First Quarter of 2003 De...
 	Number of Venture-Backed Companies Acquired in the First Quarter of 2003 De... 	Number of Venture-Backed Companies Acquired in the First Quarter of 2003 De...
Number of Venture-Backed Companies Acquired in the First Quarter of 2003 De...mensa25
 

Semelhante a Venture-backed IPO & Acquisitions Q4 05 (20)

Q3 '05 venture backed IPOs & M&As
Q3 '05 venture backed IPOs & M&As Q3 '05 venture backed IPOs & M&As
Q3 '05 venture backed IPOs & M&As
 
Q3 '05 venture backed IPOs & M&As
Q3 '05 venture backed IPOs & M&As Q3 '05 venture backed IPOs & M&As
Q3 '05 venture backed IPOs & M&As
 
Venture Backed Exits Q2 2008 - NVCA Declares Capital Crisis for Start Up C...
  	Venture Backed Exits Q2 2008 - NVCA Declares Capital Crisis for Start Up C...  	Venture Backed Exits Q2 2008 - NVCA Declares Capital Crisis for Start Up C...
Venture Backed Exits Q2 2008 - NVCA Declares Capital Crisis for Start Up C...
 
VC Fundraising Q2 2005
  	VC Fundraising Q2 2005   	VC Fundraising Q2 2005
VC Fundraising Q2 2005
 
Venture-Backed Exits - Q1 '06
  	Venture-Backed Exits - Q1 '06   	Venture-Backed Exits - Q1 '06
Venture-Backed Exits - Q1 '06
 
Venture-Backed M&A's Q2 '05
  	Venture-Backed M&A's Q2 '05   	Venture-Backed M&A's Q2 '05
Venture-Backed M&A's Q2 '05
 
Venture-Backed M&A's Q2 '05
Venture-Backed M&A's Q2 '05 Venture-Backed M&A's Q2 '05
Venture-Backed M&A's Q2 '05
 
Venture-Backed IPO Market Shows Signs of Life in Third Quart
 	Venture-Backed IPO Market Shows Signs of Life in Third Quart 	Venture-Backed IPO Market Shows Signs of Life in Third Quart
Venture-Backed IPO Market Shows Signs of Life in Third Quart
 
Q3 04 Venture-Backed IPOs
 	Q3 04 Venture-Backed IPOs 	Q3 04 Venture-Backed IPOs
Q3 04 Venture-Backed IPOs
 
Venture-Backed IPO Market Activity Continues to Lag
 	Venture-Backed IPO Market Activity Continues to Lag 	Venture-Backed IPO Market Activity Continues to Lag
Venture-Backed IPO Market Activity Continues to Lag
 
Q1 ’05 Venture-Backed IPOs
  	Q1 ’05 Venture-Backed IPOs   	Q1 ’05 Venture-Backed IPOs
Q1 ’05 Venture-Backed IPOs
 
VC Fundraising Q2 2005
  	VC Fundraising Q2 2005   	VC Fundraising Q2 2005
VC Fundraising Q2 2005
 
May Strong for VC Backed IPOs
 	May Strong for VC Backed IPOs  	May Strong for VC Backed IPOs
May Strong for VC Backed IPOs
 
Venture Capital Fundraising Q1 05
Venture Capital Fundraising Q1 05 Venture Capital Fundraising Q1 05
Venture Capital Fundraising Q1 05
 
 
Venture-Backed Mergers And Acquisitions Benefitted From Rising Valuation In...
 	Venture-Backed Mergers And Acquisitions Benefitted From Rising Valuation In... 	Venture-Backed Mergers And Acquisitions Benefitted From Rising Valuation In...
Venture-Backed Mergers And Acquisitions Benefitted From Rising Valuation In...
 
VC Fundraising Q3 2005
  	VC Fundraising Q3 2005   	VC Fundraising Q3 2005
VC Fundraising Q3 2005
 
Venture-Backed M&A Activity Witnesses Slight Uptick in Q2
Venture-Backed M&A Activity Witnesses Slight Uptick in Q2Venture-Backed M&A Activity Witnesses Slight Uptick in Q2
Venture-Backed M&A Activity Witnesses Slight Uptick in Q2
 
Venture Capital Fundraising Q3 06
 	Venture Capital Fundraising Q3 06   	Venture Capital Fundraising Q3 06
Venture Capital Fundraising Q3 06
 
Number of Venture-Backed Companies Acquired in the First Quarter of 2003 De...
 	Number of Venture-Backed Companies Acquired in the First Quarter of 2003 De... 	Number of Venture-Backed Companies Acquired in the First Quarter of 2003 De...
Number of Venture-Backed Companies Acquired in the First Quarter of 2003 De...
 

Mais de mensa25

Sarah Palin Snl Rap
Sarah Palin Snl RapSarah Palin Snl Rap
Sarah Palin Snl Rapmensa25
 
Sarah Palin September 3 2008
Sarah Palin September 3 2008Sarah Palin September 3 2008
Sarah Palin September 3 2008mensa25
 
Sarah Palin Secret Emails What Does Sarah Palin Have To Hide
Sarah Palin Secret Emails  What Does Sarah Palin Have To HideSarah Palin Secret Emails  What Does Sarah Palin Have To Hide
Sarah Palin Secret Emails What Does Sarah Palin Have To Hidemensa25
 
Sarah Palin Painting
Sarah Palin PaintingSarah Palin Painting
Sarah Palin Paintingmensa25
 
Sarah Palin In Vogue
Sarah Palin In VogueSarah Palin In Vogue
Sarah Palin In Voguemensa25
 
Sarah Palin Gop Convention Photo 2008
Sarah Palin Gop Convention Photo 2008Sarah Palin Gop Convention Photo 2008
Sarah Palin Gop Convention Photo 2008mensa25
 
Sarah Palin Being Sworn In As Governor
Sarah Palin Being Sworn In As GovernorSarah Palin Being Sworn In As Governor
Sarah Palin Being Sworn In As Governormensa25
 
Sarah Palin At Age 17
Sarah Palin At Age 17Sarah Palin At Age 17
Sarah Palin At Age 17mensa25
 
Sarah Palin As A Little Girl
Sarah Palin As A Little GirlSarah Palin As A Little Girl
Sarah Palin As A Little Girlmensa25
 
Palin Family Meets Mc Cain
Palin Family Meets Mc CainPalin Family Meets Mc Cain
Palin Family Meets Mc Cainmensa25
 
Palin Bikini Photo Was Photoshopped
Palin Bikini Photo Was PhotoshoppedPalin Bikini Photo Was Photoshopped
Palin Bikini Photo Was Photoshoppedmensa25
 
Official Photo Of Palin Family 2007
Official Photo Of Palin Family 2007Official Photo Of Palin Family 2007
Official Photo Of Palin Family 2007mensa25
 
Mc Cain Palin On Stage At Rnc September 3 2008
Mc Cain Palin On Stage At Rnc September 3 2008Mc Cain Palin On Stage At Rnc September 3 2008
Mc Cain Palin On Stage At Rnc September 3 2008mensa25
 
List Of Sarah Palin Secret Emails
List Of Sarah Palin Secret EmailsList Of Sarah Palin Secret Emails
List Of Sarah Palin Secret Emailsmensa25
 
Palin Quotes
Palin QuotesPalin Quotes
Palin Quotesmensa25
 
Mother of five fights back: Wake Up Sarah Palin
Mother of five fights back: Wake Up Sarah PalinMother of five fights back: Wake Up Sarah Palin
Mother of five fights back: Wake Up Sarah Palinmensa25
 
Sarah Palin Stats
Sarah Palin StatsSarah Palin Stats
Sarah Palin Statsmensa25
 
Strong Fund Reserves Diminish Need For Venture Capitalists to Raise Additiona...
Strong Fund Reserves Diminish Need For Venture Capitalists to Raise Additiona...Strong Fund Reserves Diminish Need For Venture Capitalists to Raise Additiona...
Strong Fund Reserves Diminish Need For Venture Capitalists to Raise Additiona...mensa25
 
Private Equity Returns Continue to be Impacted By Falling Valuations and Li...
 	Private Equity Returns Continue to be Impacted By Falling Valuations and Li... 	Private Equity Returns Continue to be Impacted By Falling Valuations and Li...
Private Equity Returns Continue to be Impacted By Falling Valuations and Li...mensa25
 
Life Sciences Regain Prominence in Venture Capital Arena
 	Life Sciences Regain Prominence in Venture Capital Arena 	Life Sciences Regain Prominence in Venture Capital Arena
Life Sciences Regain Prominence in Venture Capital Arenamensa25
 

Mais de mensa25 (20)

Sarah Palin Snl Rap
Sarah Palin Snl RapSarah Palin Snl Rap
Sarah Palin Snl Rap
 
Sarah Palin September 3 2008
Sarah Palin September 3 2008Sarah Palin September 3 2008
Sarah Palin September 3 2008
 
Sarah Palin Secret Emails What Does Sarah Palin Have To Hide
Sarah Palin Secret Emails  What Does Sarah Palin Have To HideSarah Palin Secret Emails  What Does Sarah Palin Have To Hide
Sarah Palin Secret Emails What Does Sarah Palin Have To Hide
 
Sarah Palin Painting
Sarah Palin PaintingSarah Palin Painting
Sarah Palin Painting
 
Sarah Palin In Vogue
Sarah Palin In VogueSarah Palin In Vogue
Sarah Palin In Vogue
 
Sarah Palin Gop Convention Photo 2008
Sarah Palin Gop Convention Photo 2008Sarah Palin Gop Convention Photo 2008
Sarah Palin Gop Convention Photo 2008
 
Sarah Palin Being Sworn In As Governor
Sarah Palin Being Sworn In As GovernorSarah Palin Being Sworn In As Governor
Sarah Palin Being Sworn In As Governor
 
Sarah Palin At Age 17
Sarah Palin At Age 17Sarah Palin At Age 17
Sarah Palin At Age 17
 
Sarah Palin As A Little Girl
Sarah Palin As A Little GirlSarah Palin As A Little Girl
Sarah Palin As A Little Girl
 
Palin Family Meets Mc Cain
Palin Family Meets Mc CainPalin Family Meets Mc Cain
Palin Family Meets Mc Cain
 
Palin Bikini Photo Was Photoshopped
Palin Bikini Photo Was PhotoshoppedPalin Bikini Photo Was Photoshopped
Palin Bikini Photo Was Photoshopped
 
Official Photo Of Palin Family 2007
Official Photo Of Palin Family 2007Official Photo Of Palin Family 2007
Official Photo Of Palin Family 2007
 
Mc Cain Palin On Stage At Rnc September 3 2008
Mc Cain Palin On Stage At Rnc September 3 2008Mc Cain Palin On Stage At Rnc September 3 2008
Mc Cain Palin On Stage At Rnc September 3 2008
 
List Of Sarah Palin Secret Emails
List Of Sarah Palin Secret EmailsList Of Sarah Palin Secret Emails
List Of Sarah Palin Secret Emails
 
Palin Quotes
Palin QuotesPalin Quotes
Palin Quotes
 
Mother of five fights back: Wake Up Sarah Palin
Mother of five fights back: Wake Up Sarah PalinMother of five fights back: Wake Up Sarah Palin
Mother of five fights back: Wake Up Sarah Palin
 
Sarah Palin Stats
Sarah Palin StatsSarah Palin Stats
Sarah Palin Stats
 
Strong Fund Reserves Diminish Need For Venture Capitalists to Raise Additiona...
Strong Fund Reserves Diminish Need For Venture Capitalists to Raise Additiona...Strong Fund Reserves Diminish Need For Venture Capitalists to Raise Additiona...
Strong Fund Reserves Diminish Need For Venture Capitalists to Raise Additiona...
 
Private Equity Returns Continue to be Impacted By Falling Valuations and Li...
 	Private Equity Returns Continue to be Impacted By Falling Valuations and Li... 	Private Equity Returns Continue to be Impacted By Falling Valuations and Li...
Private Equity Returns Continue to be Impacted By Falling Valuations and Li...
 
Life Sciences Regain Prominence in Venture Capital Arena
 	Life Sciences Regain Prominence in Venture Capital Arena 	Life Sciences Regain Prominence in Venture Capital Arena
Life Sciences Regain Prominence in Venture Capital Arena
 

Último

Investment in The Coconut Industry by Nancy Cheruiyot
Investment in The Coconut Industry by Nancy CheruiyotInvestment in The Coconut Industry by Nancy Cheruiyot
Investment in The Coconut Industry by Nancy Cheruiyotictsugar
 
Appkodes Tinder Clone Script with Customisable Solutions.pptx
Appkodes Tinder Clone Script with Customisable Solutions.pptxAppkodes Tinder Clone Script with Customisable Solutions.pptx
Appkodes Tinder Clone Script with Customisable Solutions.pptxappkodes
 
NewBase 19 April 2024 Energy News issue - 1717 by Khaled Al Awadi.pdf
NewBase  19 April  2024  Energy News issue - 1717 by Khaled Al Awadi.pdfNewBase  19 April  2024  Energy News issue - 1717 by Khaled Al Awadi.pdf
NewBase 19 April 2024 Energy News issue - 1717 by Khaled Al Awadi.pdfKhaled Al Awadi
 
Traction part 2 - EOS Model JAX Bridges.
Traction part 2 - EOS Model JAX Bridges.Traction part 2 - EOS Model JAX Bridges.
Traction part 2 - EOS Model JAX Bridges.Anamaria Contreras
 
8447779800, Low rate Call girls in Kotla Mubarakpur Delhi NCR
8447779800, Low rate Call girls in Kotla Mubarakpur Delhi NCR8447779800, Low rate Call girls in Kotla Mubarakpur Delhi NCR
8447779800, Low rate Call girls in Kotla Mubarakpur Delhi NCRashishs7044
 
PB Project 1: Exploring Your Personal Brand
PB Project 1: Exploring Your Personal BrandPB Project 1: Exploring Your Personal Brand
PB Project 1: Exploring Your Personal BrandSharisaBethune
 
(Best) ENJOY Call Girls in Faridabad Ex | 8377087607
(Best) ENJOY Call Girls in Faridabad Ex | 8377087607(Best) ENJOY Call Girls in Faridabad Ex | 8377087607
(Best) ENJOY Call Girls in Faridabad Ex | 8377087607dollysharma2066
 
Memorándum de Entendimiento (MoU) entre Codelco y SQM
Memorándum de Entendimiento (MoU) entre Codelco y SQMMemorándum de Entendimiento (MoU) entre Codelco y SQM
Memorándum de Entendimiento (MoU) entre Codelco y SQMVoces Mineras
 
Pitch Deck Teardown: Geodesic.Life's $500k Pre-seed deck
Pitch Deck Teardown: Geodesic.Life's $500k Pre-seed deckPitch Deck Teardown: Geodesic.Life's $500k Pre-seed deck
Pitch Deck Teardown: Geodesic.Life's $500k Pre-seed deckHajeJanKamps
 
8447779800, Low rate Call girls in Dwarka mor Delhi NCR
8447779800, Low rate Call girls in Dwarka mor Delhi NCR8447779800, Low rate Call girls in Dwarka mor Delhi NCR
8447779800, Low rate Call girls in Dwarka mor Delhi NCRashishs7044
 
PSCC - Capability Statement Presentation
PSCC - Capability Statement PresentationPSCC - Capability Statement Presentation
PSCC - Capability Statement PresentationAnamaria Contreras
 
8447779800, Low rate Call girls in Uttam Nagar Delhi NCR
8447779800, Low rate Call girls in Uttam Nagar Delhi NCR8447779800, Low rate Call girls in Uttam Nagar Delhi NCR
8447779800, Low rate Call girls in Uttam Nagar Delhi NCRashishs7044
 
8447779800, Low rate Call girls in Tughlakabad Delhi NCR
8447779800, Low rate Call girls in Tughlakabad Delhi NCR8447779800, Low rate Call girls in Tughlakabad Delhi NCR
8447779800, Low rate Call girls in Tughlakabad Delhi NCRashishs7044
 
8447779800, Low rate Call girls in Saket Delhi NCR
8447779800, Low rate Call girls in Saket Delhi NCR8447779800, Low rate Call girls in Saket Delhi NCR
8447779800, Low rate Call girls in Saket Delhi NCRashishs7044
 
Guide Complete Set of Residential Architectural Drawings PDF
Guide Complete Set of Residential Architectural Drawings PDFGuide Complete Set of Residential Architectural Drawings PDF
Guide Complete Set of Residential Architectural Drawings PDFChandresh Chudasama
 
Flow Your Strategy at Flight Levels Day 2024
Flow Your Strategy at Flight Levels Day 2024Flow Your Strategy at Flight Levels Day 2024
Flow Your Strategy at Flight Levels Day 2024Kirill Klimov
 
The-Ethical-issues-ghhhhhhhhjof-Byjus.pptx
The-Ethical-issues-ghhhhhhhhjof-Byjus.pptxThe-Ethical-issues-ghhhhhhhhjof-Byjus.pptx
The-Ethical-issues-ghhhhhhhhjof-Byjus.pptxmbikashkanyari
 
Cyber Security Training in Office Environment
Cyber Security Training in Office EnvironmentCyber Security Training in Office Environment
Cyber Security Training in Office Environmentelijahj01012
 
Cybersecurity Awareness Training Presentation v2024.03
Cybersecurity Awareness Training Presentation v2024.03Cybersecurity Awareness Training Presentation v2024.03
Cybersecurity Awareness Training Presentation v2024.03DallasHaselhorst
 

Último (20)

Investment in The Coconut Industry by Nancy Cheruiyot
Investment in The Coconut Industry by Nancy CheruiyotInvestment in The Coconut Industry by Nancy Cheruiyot
Investment in The Coconut Industry by Nancy Cheruiyot
 
Appkodes Tinder Clone Script with Customisable Solutions.pptx
Appkodes Tinder Clone Script with Customisable Solutions.pptxAppkodes Tinder Clone Script with Customisable Solutions.pptx
Appkodes Tinder Clone Script with Customisable Solutions.pptx
 
NewBase 19 April 2024 Energy News issue - 1717 by Khaled Al Awadi.pdf
NewBase  19 April  2024  Energy News issue - 1717 by Khaled Al Awadi.pdfNewBase  19 April  2024  Energy News issue - 1717 by Khaled Al Awadi.pdf
NewBase 19 April 2024 Energy News issue - 1717 by Khaled Al Awadi.pdf
 
Traction part 2 - EOS Model JAX Bridges.
Traction part 2 - EOS Model JAX Bridges.Traction part 2 - EOS Model JAX Bridges.
Traction part 2 - EOS Model JAX Bridges.
 
8447779800, Low rate Call girls in Kotla Mubarakpur Delhi NCR
8447779800, Low rate Call girls in Kotla Mubarakpur Delhi NCR8447779800, Low rate Call girls in Kotla Mubarakpur Delhi NCR
8447779800, Low rate Call girls in Kotla Mubarakpur Delhi NCR
 
PB Project 1: Exploring Your Personal Brand
PB Project 1: Exploring Your Personal BrandPB Project 1: Exploring Your Personal Brand
PB Project 1: Exploring Your Personal Brand
 
(Best) ENJOY Call Girls in Faridabad Ex | 8377087607
(Best) ENJOY Call Girls in Faridabad Ex | 8377087607(Best) ENJOY Call Girls in Faridabad Ex | 8377087607
(Best) ENJOY Call Girls in Faridabad Ex | 8377087607
 
Memorándum de Entendimiento (MoU) entre Codelco y SQM
Memorándum de Entendimiento (MoU) entre Codelco y SQMMemorándum de Entendimiento (MoU) entre Codelco y SQM
Memorándum de Entendimiento (MoU) entre Codelco y SQM
 
Pitch Deck Teardown: Geodesic.Life's $500k Pre-seed deck
Pitch Deck Teardown: Geodesic.Life's $500k Pre-seed deckPitch Deck Teardown: Geodesic.Life's $500k Pre-seed deck
Pitch Deck Teardown: Geodesic.Life's $500k Pre-seed deck
 
8447779800, Low rate Call girls in Dwarka mor Delhi NCR
8447779800, Low rate Call girls in Dwarka mor Delhi NCR8447779800, Low rate Call girls in Dwarka mor Delhi NCR
8447779800, Low rate Call girls in Dwarka mor Delhi NCR
 
PSCC - Capability Statement Presentation
PSCC - Capability Statement PresentationPSCC - Capability Statement Presentation
PSCC - Capability Statement Presentation
 
8447779800, Low rate Call girls in Uttam Nagar Delhi NCR
8447779800, Low rate Call girls in Uttam Nagar Delhi NCR8447779800, Low rate Call girls in Uttam Nagar Delhi NCR
8447779800, Low rate Call girls in Uttam Nagar Delhi NCR
 
8447779800, Low rate Call girls in Tughlakabad Delhi NCR
8447779800, Low rate Call girls in Tughlakabad Delhi NCR8447779800, Low rate Call girls in Tughlakabad Delhi NCR
8447779800, Low rate Call girls in Tughlakabad Delhi NCR
 
8447779800, Low rate Call girls in Saket Delhi NCR
8447779800, Low rate Call girls in Saket Delhi NCR8447779800, Low rate Call girls in Saket Delhi NCR
8447779800, Low rate Call girls in Saket Delhi NCR
 
Guide Complete Set of Residential Architectural Drawings PDF
Guide Complete Set of Residential Architectural Drawings PDFGuide Complete Set of Residential Architectural Drawings PDF
Guide Complete Set of Residential Architectural Drawings PDF
 
Flow Your Strategy at Flight Levels Day 2024
Flow Your Strategy at Flight Levels Day 2024Flow Your Strategy at Flight Levels Day 2024
Flow Your Strategy at Flight Levels Day 2024
 
The-Ethical-issues-ghhhhhhhhjof-Byjus.pptx
The-Ethical-issues-ghhhhhhhhjof-Byjus.pptxThe-Ethical-issues-ghhhhhhhhjof-Byjus.pptx
The-Ethical-issues-ghhhhhhhhjof-Byjus.pptx
 
Corporate Profile 47Billion Information Technology
Corporate Profile 47Billion Information TechnologyCorporate Profile 47Billion Information Technology
Corporate Profile 47Billion Information Technology
 
Cyber Security Training in Office Environment
Cyber Security Training in Office EnvironmentCyber Security Training in Office Environment
Cyber Security Training in Office Environment
 
Cybersecurity Awareness Training Presentation v2024.03
Cybersecurity Awareness Training Presentation v2024.03Cybersecurity Awareness Training Presentation v2024.03
Cybersecurity Awareness Training Presentation v2024.03
 

Venture-backed IPO & Acquisitions Q4 05

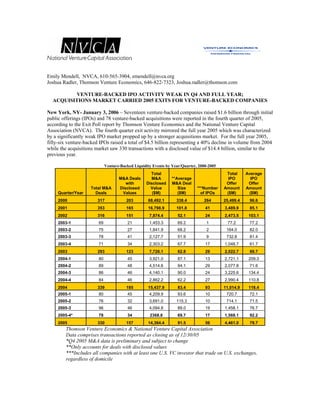
  • 1. Emily Mendell, NVCA, 610-565-3904, emendell@nvca.org Joshua Radler, Thomson Venture Economics, 646-822-7323, Joshua.radler@thomson.com VENTURE-BACKED IPO ACTIVITY WEAK IN Q4 AND FULL YEAR; ACQUISITIONS MARKET CARRIED 2005 EXITS FOR VENTURE-BACKED COMPANIES New York, NY- January 3, 2006 – Seventeen venture-backed companies raised $1.6 billion through initial public offerings (IPOs) and 78 venture-backed acquisitions were reported in the fourth quarter of 2005, according to the Exit Poll report by Thomson Venture Economics and the National Venture Capital Association (NVCA). The fourth quarter exit activity mirrored the full year 2005 which was characterized by a significantly weak IPO market propped up by a stronger acquisitions market. For the full year 2005, fifty-six venture-backed IPOs raised a total of $4.5 billion representing a 40% decline in volume from 2004 while the acquisitions market saw 330 transactions with a disclosed value of $14.4 billion, similar to the previous year. Venture-Backed Liquidity Events by Year/Quarter, 2000-2005 Total Total Average M&A Deals **Average M&A IPO IPO with Disclosed M&A Deal Offer Offer Total M&A Disclosed Value Size ***Number Amount Amount Quarter/Year Values ($M) ($M) ($M) ($M) Deals of IPOs 2000 317 203 68,492.1 338.4 264 25,499.4 96.6 2001 353 165 16,798.9 101.8 41 3,489.9 85.1 2002 316 151 7,874.4 52.1 24 2,473.5 103.1 2003-1 69 21 1,453.3 69.2 1 77.2 77.2 2003-2 75 27 1,841.9 68.2 2 164.0 82.0 2003-3 78 41 2,127.7 51.9 9 732.8 81.4 2003-4 71 34 2,303.2 67.7 17 1,048.7 61.7 2003 293 123 7,726.1 62.8 29 2,022.7 69.7 2004-1 80 45 3,921.0 87.1 13 2,721.1 209.3 2004-2 89 48 4,514.6 94.1 29 2,077.8 71.6 2004-3 86 46 4,140.1 90.0 24 3,225.6 134.4 2004-4 84 46 2,862.2 62.2 27 2,990.4 110.8 2004 339 185 15,437.9 83.4 93 11,014.9 118.4 2005-1 80 45 4,209.9 93.6 10 720.7 72.1 2005-2 76 32 3,691.0 115.3 10 714.1 71.5 2005-3 96 46 4,094.8 89.0 19 1,458.1 76.7 2005-4* 78 34 2368.8 69.7 17 1,568.1 92.2 2005 330 157 14,364.4 91.5 56 4,461.0 79.7 Thomson Venture Economics & National Venture Capital Association Data comprises transactions reported as closing as of 12/30/05 *Q4 2005 M&A data is preliminary and subject to change **Only accounts for deals with disclosed values ***Includes all companies with at least one U.S. VC investor that trade on U.S. exchanges, regardless of domicile
  • 2. According to Mark Heesen, president of the NVCA, the venture capital exit market was characterized in 2005 by a lackluster IPO market, which can be attributed to a number of factors. “For the IPO market to improve, we need relief from certain hurdles associated with the Sarbanes Oxley Act, but we also need an investing public that is bullish on technology,” said Heesen. “Investors have every reason to have confidence in the venture-backed companies in registration today. Most have survived the boom and the bust, which speaks to the soundness of their business models and the strength of their discipline. They have weathered significant difficulties and understand excess and how to avoid it. Once the market begins to accept these organizations and that is reflected in their share prices, emerging companies will consider the IPO path once again.” IPO Activity Highlights The fourth quarter of 2005 was dominated by the Technology sector, which saw ten venture-backed IPOs raise $1.1 billion. The Technology sector also contained the largest IPO of the fourth quarter and the year, with IntercontinentalExchange, Inc.’s $415.9 million offering. IntercontinentalExchange was backed by TA Associates and Goldman, Sachs & Co. The second largest IPO of the quarter, DealerTrack, Inc., was also from the Technology sector. DealerTrack raised $170.0 million and was backed by J.P. Morgan Partners and GRP Partners. The Life Sciences sector had five venture-backed IPOs raise a total of $191.2 million in the fourth quarter. The largest Life Sciences IPOs in the quarter were NxStage Medical, Inc. and Somaxon Pharmaceuticals, Inc., which both raised $55.0 million. In 2005, the Technology sector saw 26 venture-backed companies raise a total of $2.6 billion, with the Internet Specific category leading the sector with ten IPOs raising $1.3 billion. The Life Sciences sector saw 23 companies raise a total of $1.2 billion, while Non-high Technology had seven IPOs raise $727.6 million. The two largest IPOs of 2005, IntercontinentalExchange, Inc. and OptionsXpress, Inc., were from the Technology sector. The third largest venture-backed IPO of the year, Focus Media, came from the Non-high Technology sector. As of December 30th, 33 of the 56 companies, or 59%, were trading at or above their offering price. IPO Industry Breakdown Q4 2005 Full-Year 2005 *Number Total *Number of Venture of Total Venture Backed Venture Venture Backed Offering Backed Backed IPO's in Size IPO's in Offering Industry the U.S. ($M) the U.S. Size ($M) Internet Specific 4 602.1 10 1,259.3 Semiconductors 3 240.5 7 570.1 Communications/Media 2 103.5 4 315.8 Computer Software 1 170.0 3 356.5 Computer Hardware -- -- 2 55.2 Technology TOTAL 10 1,116.1 26 2,556.9 Medical/Health 4 136.2 13 670.0 Biotechnology 1 55.0 10 506.4 Life Sciences TOTAL 5 191.2 23 1,176.4 Non-high Technology 2 260.8 7 727.6 Other TOTAL 2 260.8 7 727.6 Thomson Venture Economics & National Venture Capital Association *Includes all companies with at least one U.S. VC investor that trade on U.S. exchanges, regardless of domicile
  • 3. There are currently only 16 companies ‘in registration’ with the Securities and Exchange Commission, meaning they have filed during 2005 and are currently preparing for their initial public offerings. This compares with 57 venture-backed companies that were in registration at the end of 2004. Merger and Acquisition Highlights Venture-backed M&A activity remained strong for the second consecutive year, carrying forward the recovery from the post-bubble trough. Based on data collected as of December 30, 2005, the number of transactions for the year held steady at 330 compared to 339 in 2004. The average disclosed deal value rose in 2005 to $91.5 million from $83.4 million in 2004. Daniel Benkert, senior analyst at Thomson Financial said, “We have entered a short-term period of stasis, where the mass of those bubble-era companies are finally reaching a level of maturity worthy of a profitable exit. Considering the uncertain state of the IPO option, the M&A market remains healthy and we are probably seeing that market coming to a plateau, but a reasonably sustainable and very rational one.” M&A Industry Breakdown Q4 2005 Full-Year 2005 Total *Number Total Venture of Venture *Number *Number of Backed Venture *Number of Backed Disclosed Backed Disclosed of Venture Venture Backed Venture Backed Backed M&A Deal M&A M&A Deal M&A deals (disclosed)deals Value deals in (disclosed)deals Value Industry ($M) the U.S. ($M) in the U.S. in the U.S. in the U.S. Internet Specific 20 9 452.0 76 36 3408.1 Semiconductors 6 4 173.7 14 6 281.2 Communications/Media 4 3 81.0 31 15 2316.8 Computer Software 24 7 675.7 109 50 3462.7 Computer Hardware 5 3 69.9 13 6 233.9 Technology TOTAL 59 26 1,452.2 243 113 9,702.6 Medical/Health 11 5 682.5 46 25 3277.0 Biotechnology 4 1 113.5 12 4 699.5 Life Sciences TOTAL 15 6 796.0 58 29 3,976.5 Non-high Technology 4 2 120.4 29 15 685.2 Other TOTAL* 78 34 2,368.8 330 157 14,364.4 *Q 4 2005 M&A numbers are preliminary and are subject to change The Software sector saw the most transactions in the fourth quarter at 24 followed closely by the Internet – Specific sector at 20. These sectors also hold the number one and two positions for the full year 2005 at 109 and 76 deals respectively. Life Sciences, which includes biotechnology and medical devices, saw 15 deals in the fourth quarter and 58 deals for the full year.
  • 4. Analysis of M& A Transaction Values versus Amount Invested Relationship between transaction 2004 2005 value and investment Deals where transaction value is less than total venture investment 62 48 Deals where transaction value is 1-4x total venture investment 61 58 Deals where transaction value is 4x- 10x total venture investment 39 30 Deals where transaction value is 21 18 greater than 10x venture investment Total Disclosed Deals 183 154 Source: Thomson Venture Economics & National Venture Capital Association * In 2004, 185 deals had disclosed values, but two of these targets did not have a disclosed total investment amount. ** In 2005, 157 deals had disclosed values, but three of these targets did not have a disclosed total investment amount. An analysis of the returns these acquisitions generated in transaction values shows a market with a strong degree of symmetry with regard to the level of success that can be expected using the M&A liquidity option. Both 2004 and 2005 follow the same pattern, with roughly 1/3 of deals returning at least 4x or greater the investment, 1/3 returning 1x – 4x the investment, and 1/3 bringing in less than the amount invested. Thomson Venture Economics, a Thomson Financial company, is the foremost information provider for equity professionals worldwide. Venture Economics offers an unparalleled range of products from directories to conferences, journals, newsletters, research reports, and the VentureXpert™ database. For over 40 years, Venture Economics has been tracking the venture capital and buyouts industry. Since 1961, it has been a recognized source for comprehensive analysis of investment activity and performance of the private equity industry. Venture Economics maintains a long-standing relationship within the private equity investment community, in-depth industry knowledge, and proprietary research techniques. Private equity managers and institutional investors alike consider Venture Economics information to be the industry standard. For more information about Venture Economics, please visit www.ventureeconomics.com. Thomson Financial Thomson Financial is a US$1.73 billion provider of information and technology solutions to the worldwide financial community. Through the widest range of products and services in the industry, Thomson Financial helps clients in more than 70 countries make better decisions, be more productive and achieve superior results. Thomson Financial is part of The Thomson Corporation (www.thomson.com), a global leader in providing integrated information solutions to more than 20 million business and professional customers in the fields of law, tax, accounting, financial services, higher education, reference information, corporate e-learning and assessment, scientific research and healthcare. With revenues of US$8.10 billion,
  • 5. The Thomson Corporation lists its common shares on the New York and Toronto stock exchanges (NYSE: TOC; TSX: TOC). The National Venture Capital Association (NVCA) represents approximately 460 venture capital and private equity firms. NVCA's mission is to foster greater understanding of the importance of venture capital to the U.S. economy, and support entrepreneurial activity and innovation. According to a 2004 Global Insight study, venture-backed companies accounted for 10.1 million jobs and $1.8 trillion in revenue in the United States in 2003. The NVCA represents the public policy interests of the venture capital community, strives to maintain high professional standards, provides reliable industry data, sponsors professional development, and facilitates interaction among its members. For more information about the NVCA, please visit www.nvca.org.