Caribbean Consumer Trends
•Transferir como PPT, PDF•
2 gostaram•2,455 visualizações

This document provides an overview of the Caribbean market for agricultural and food products from the United States. It discusses the geography, population demographics, economies, infrastructure, and consumer trends of the Caribbean region. It also outlines the market segments of retail and foodservice/hospitality industries. Finally, it covers requirements and strategies for entering the Caribbean market, including import regulations, labeling laws, and what Caribbean food buyers are looking for.

Recomendados
Mais conteúdo relacionado
Destaque
Semelhante a Caribbean Consumer Trends
Semelhante a Caribbean Consumer Trends (20)
Mais de World Trade Center Harrisburg, serving Central PA
Mais de World Trade Center Harrisburg, serving Central PA (7)
Caribbean Consumer Trends
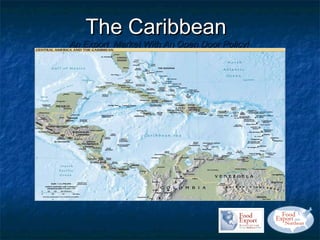
- 1. The Caribbean An Export Market With An Open Door Policy!
- 2. The Caribbean Islands 1. Anguilla 16. Martinique 2. Antigua & Barbuda 17. Montserrat 3. Aruba 18. Netherlands Antilles (Sint 4. The Bahamas Maarten, Sint Eustatius, 5. Barbados Saba, Curacao, Bonaire) 6. Bermuda 19. Puerto Rico 7. BVI 20. St. Barthelemy 8. Cayman Islands 21. St. Kitts & Nevis 9. Cuba 22. St. Lucia 10. Dominica 23. St. Martin 11. The Dominican Republic 24. St. Vincent & the Grenadines 12. Guadeloupe 25. Trinidad & Tobago 13. Grenada 26. Turks & Caicos 14. Haiti 27. USVI 15. Jamaica
- 3. Discussion Outline I. Caribbean Market Overview II. Consumer Trends III. Market Segments IV. Market Entry Requirements and Strategies V. Activities Targeting Caribbean Buyers
- 4. I. Caribbean Market Overview Geography
- 5. I. Caribbean Market Overview Geography CONTINUED • Single Island or Multi-Island Chains • Location: From: Bermuda in N. Atlantic, E. of South Carolina To: Trinidad & Tobago, btw Caribbean / N. Atlantic, N.E. of Venezuela • Climate: Sub-Tropical / Tropical Maritime / Tropical, Minimal Seasonal Temp Variation, Seasonal Rainfall Variation • Terrain: Varies! Low lying limestone base, coral reefs, plains, fertile valleys, low hills and mountains
- 6. I. Caribbean Market Overview Geography CONTINUED • Natural Resources: “Sun, Sand & Sea”, Limestone, Nickel, Bauxite, Gold Silver, Petroleum, Natural Gas and Asphalt • Land Use: The Dominican Republic – Arable Land = 23%, Permanent crops = 10% and Other Use = 67% The Bahamas – Arable Land = 1%, Permanent crops = 0% and Other Use = 99% • Natural Hazards: Hurricanes (June – November), Occasional Floods, Periodic Droughts
- 7. I. Caribbean Market Overview Population/Demographics Out of Many One People
- 8. I. Caribbean Market Overview Population/Demographics CONTINUED Total Population : 40 Million (approx) Top 5 : 92% / 37 Million Cuba – 11.5 M / Dominican Republic – 9.7 M / Haiti – 9 M / Puerto Rico – 4 M / Jamaica – 2.8 M Annual Population Growth Rate Haiti – 1.8% / Dominican Republic 1.5% / Barbados 0.38% Male : Female Ratio Haiti – 0.98: 1 / Dominican Republic 1.03:1 / Barbados 0.94:1 Life Expectancy Haiti – 61 Years / Dominican Republic & Barbados 74 Years
- 9. I. Caribbean Market Overview Population/Demographics CONTINUED Ethnic Groups African, European, East Indian, Asian, Caribbean Amerindian, Mixed Religions Protestant (Anglican, Seven-Day Adventist, Pentecostal, Baptist, Methodist , etc.), Roman Catholic, Hindu, Muslim, Jewish, Other, None Languages SPANISH , FRENCH / Creole / French Patois, ENGLISH/ English Patois, DUTCH / Papiamento Literacy Haiti – 53% / Dominican Republic – 87% / Barbados – 99%
- 10. I. Caribbean Market Overview Governments
- 11. I. Caribbean Market Overview Governments CONTINUED Status: Independent Nations vs. Dependent / Overseas Territories / Overseas Departments Types: Parliamentary Democracies, Democratic Republics, Self-Governing Territories, Commonwealth State, Communist State Legal Systems: Based on: English Common Law, French Civil Law, Spanish Civil Law, Roman Civil Law and US Laws Heads of State / Government: H of S: Queen Elizabeth II, Queen Beatrix, President Obama, Local Presidents H of G: Prime Ministers, Presidents, Premiers, Leaders of Government, Governors Suffrage: 18 years of age / Universal
- 12. I. Caribbean Market Overview Economies
- 13. I. Caribbean Market Overview Economies CONTINUED Aruba $ 21, 800 GDP per Capita Bermuda $ 69,900 Income Dominican Rep. $ 8,200 Haiti $ 1,300 Agric. Indus. Serv. Aruba 0.4% 33% 66% GDP Composition by Bermuda 1% 10% 89% Sector Dom. 11% 23% 66% Rep. Haiti 28% 20% 52%
- 14. I. Caribbean Market Overview Economies CONTINUED Unemployment Rates: Aruba: 6.9% / Bermuda: 2.1% / Dominican Republic: 14.1% / Haiti: widespread, two-thirds of the labor force do not have formal jobs Industries: Tourism, Banking, Insurance & Finance, Sugar, Bananas, Tobacco, Food Processing, Beverage, Light Manufacturing, Cement, Textiles, Mining (Bauxite, other Metallic and Non-Metallic Minerals) , Petroleum, Chemicals, Information Technology Major Import Partners: Aruba: US 53%, Netherlands 12%, UK 5% Bermuda: Italy 26%, US 18%, South Korea 17%, UK 8%, Singapore 5%, France 5%, Norway 4% Dominican Republic: US 39%, Venezuela 8%, Mexico 5%, Colombia 5% Haiti: US 34%, Dominican Republic 23%, Netherland Antilles 10%, China 4%
- 15. I. Caribbean Market Overview Infrastructure
- 16. I. Caribbean Market Overview Infrastructure CONTINUED Telephon Telephon TV Internet Intl. Air e Main e Cellular Stations Users and Sea Lines Ports Dom. 985,700 7.2 M 25 2.1 M 10 – Air Rep. Plus Cable 22% of Pop. 5 - Sea Jamaica 316,600 2.7 M 7 1.5 M 2 – Air Plus Cable 54% of Pop. 5 - Sea Trinidad & 307,000 1.5 M 6 227 K 2 – Air Tobago Plus Cable 19% of Pop. 3 - Sea Neth. 88,000 200,000 3 32 K 3 – Air Antilles Plus Cable 14% of Pop. 3 - Sea
- 17. I. Caribbean Market Overview Top 10 Export Markets U.S. Agriculture, Fish & Forestry Products 2011 Caym an Barbados Berm uda Net h. Ant . Baham as Trinidad Cuba Hait i Jam aica Dom . Rep. 0 500 1000 1500 Source: USDA $ Millions
- 18. II. Consumer Trends U.S. Agriculture, Fish & Forestry Exports to the Top 5 Caribbean Markets 2011($ Millions) TOTAL Dom. Jamaic Haiti Cuba Trinidad Caribbea Rep. a & n Tobago Bulk 1,228.9 548.4 144.5 174.1 194.9 71.9 Intermediate 671.4 328.1 101.4 47.7 36.5 82.4 Consumer 1,516.8 312.2 155.2 104.7 121.3 161.0 Forest 249.9 49.1 29.7 30.1 1.5 19.0 Prod. Seafood 51.6 9.2 3.6 1.0 0 4.4 Total 3,718.6 1,247.1 434.4 357.5 354.3 338.7 Source: USDA
- 19. II. Consumer Trends Growth in US Agricultural Exports to the Caribbean Source: USDA 4.5 4 3.5 3 $ Billions 2.5 2 1.5 1 0.5 0 2007 2008 2009 2010 2011
- 20. II. Consumer Trends Growth in US Consumer-Oriented Agricultural Exports to the Caribbean Source: USDA 1600 1400 1200 1000 $ Millions 800 600 400 200 0 2007 2008 2009 2010 2011
- 21. II. Consumer Trends Caribbean Market for Packaged Foods Market Size – Retail Value – Growth Forecast 6000 5000 4000 $ Millions 3000 2000 1000 0 2005 2006 2007 2008 2009 2010 2011 2012 2013 2014 Source: EUROMONITOR
- 22. II. Consumer Trends Top 10 Caribbean Markets for Packaged Foods Market Size – Retail Value – Growth Forecast 1800 2009 1600 2014 1400 1200 $ Millions 1000 800 600 400 200 0 DR CUBA JA HAI TI T& T GUAD BAH MART BDOS NA Source: EUROMONITOR
- 23. II. Consumer Trends Distribution of Consumer Ready Foods in the Caribbean 40% 60% Source: USDA Ret ail Food Service
- 24. II. Consumer Trends Breakdown of U.S. Exports to the Caribbean of Consumer- Oriented Products (2011) Pet Food 2% W ine/ Beer 3% Nut s 1% Juice 4% Cereals Dairy 3% Proc. F&V 12% 6% Egg & Prods. 3% Fr esh F&V 6% Ot her 13% Snack s 8% R. Meat s Poult ry 15% 24% Source: USDA
- 25. II. Consumer Trends U.S. Exports to the Caribbean of Consumer-Oriented Products – High Growth Categories 400 350 300 $ Millions 250 200 150 100 50 0 Poult ry Fruit & Veg Red Meat s Snack Foods 2007 2008 2009 2010 2011 Source: USDA
- 26. II. Consumer Trends Caribbean Consumers’ Demands/Needs Healthy Living and Eating Busier Lifestyles need Convenience Good Value/Economic Prices Specialty Foods
- 27. II. Consumer Trends Best Product Prospects Snack Foods – Healthy & Specialty Fresh & Frozen Vegetables & Fruit Fruit Juices & Drinks / Healthy Beverages / Energy Drinks Wine & Beer Frozen Foods / Convenience Foods Healthy / Natural Foods / Organic / Diabetic Products Deli Meats – Salami, Cold Cuts, Turkey Breasts… Bakery Products - Ready-made, Pre-prep, Ingredients High End Seafood – Scallops, Crab, Lobster, Salmon Pet Foods – Dog & Cat Foods
- 28. III. Market Segments Retail Market Trends More Direct Purchases by Chains and Large Independents Continued Demand for Private Labeling and Store Branding Continued Demand for Value/Economy Grocery Lines Added Service to the Yachting “Niche” Market – Phoned/Faxed in Orders for Yacht Provisions
- 29. III. Market Segments Retail Market Trends CONTINUED New / Expanded Stores and Improved Store Formats More In-store Bakeries and Delis with “Ready” Meal Services Expanded Frozen Food Sections Designated Sections for Healthy/Natural/Organic and Specialty Foods Introduction of Natural/Organic Products across Food Categories
- 30. III. Market Segments Retail Market Structure Buyer Profiles: Foreign Supplier • Importer/Distributor mostly unspecialized, Foodservice & Retail, Dry &/or Refrigerated Specialty Importers/Distributors Stores • Regional Conglomerates • Local chains / some with IGA affiliations Supermarket Chains Independents • International chains, e.g. PriceSmart, Cost-U-Less, Carrefour etc. Mom & Pops • Large and medium sized Convenience Stores Wholesalers Independent Stores Pharmacies Gas Marts • Moms & Pops, Convenience Stores etc.
- 31. III. Market Segments HRI / Food Service Market Trends Steady Growth in Caribbean Tourism since 2002 Approximately 14 million stop- over tourists & 13 million cruise passenger arrivals per year US Visitors Comprise Major Share just over 50% of Tourists in the Caribbean Significant Expansion in the # of Hotels across the Region
- 32. III. Market Segments HRI / Food Service Market Trends Fast Food Restaurants one of the Fastest Growing HRI Market Segments in recent years World Class Chef’s in the Caribbean Influence Demand for High Quality and Specialty Food Ingredients
- 33. III. Market Segments HRI / Food Service Market Structure Buyer Profiles: Foreign • Some major Importers / Suppliers Distributors focus on food service market although many supply both retail and foodservice customers • European Plan & All-Inclusive Importers Chains Restaurants Distributors Hotels • International and Regional Chains • Multi-Island Hotel Chains Institutions Miami / S. FL Buying Offices
- 34. IV. Market Entry Requirements & Strategies Import & Food Safety Requirements Import Documentation – Bill of Lading, Commercial Invoice, Insurance Certificate Duties & Taxes – Import Tariffs, Other Fees, Value- Added Taxes Health Registration / Certification Trademark Registration GMOs - Accepted
- 35. IV. Market Entry Requirements & Strategies Labeling Regulations 1. Company brand name 7. Product batch code 2. Product name 8. Expiration date 3. Country of origin 9. Preparation instructions 4. Ingredients list 10. Storage instructions 5. Net weight (Metric) after opening 6. Producer name and 11. Nutrition Facts address or Importer 12. UPC Code name and address
- 36. IV. Market Entry Requirements & Strategies What do Caribbean Food Buyers Want? Understanding from New Suppliers that initial orders may be small but potentially can grow in to big orders! Reliable Service and Communications Good Value and Competitive Pricing Good Quality Adequate Lead Time for Products with Expiry Dates Exclusive Importer/Distributor Relationships Marketing Support: POS Materials, Advertising & Promotion Funds, Free Stock for Promotions
- 37. IV. Market Entry Requirements & Strategies Export Market Options & Approach Important Questions: Options & Approach: What are your company’s Regional Coverage – Sell Export Objectives? directly to Large Markets and What are your company’s in-directly to small markets Resources? How much experience does Sell in-directly to all markets your company have in and transition to direct exports Exporting? as markets develops What is your company’s Export Strategy? Target Specific Market (s)
- 38. IV. Market Entry Requirements & Strategies The Role of US Export Wholesalers/Consolidators Consolidation is Key for the Caribbean • Majority of freight moving to the Region is consolidated in Florida • Bermuda sources from the NE and from Jacksonville • Consolidators’ Success Factors: Proximity to Markets, Wide Product Range & Services, Competitive Prices • Some consolidators carry product, some act as freight forwarders only • Many consolidators specialize but larger consolidators offer a full line of products • Parallel Trading is a common complaint among Caribbean based distributors
- 39. IV. Market Entry Requirements & Strategies Advantages of Selling to Consolidators Access to a wide market and large number of buyers through a single “customer” Expansion of product distribution over a greater number of small-scale buyers through consolidators Lower payment risk selling to consolidators vs. smaller-size regional buyers Consolidators have in-depth knowledge and are better equipped to sell to the region Consolidators’ own Private Label another opportunity
- 40. V. 2013 Activities Targeting Caribbean Buyers JUNE 2013 A Great opportunity to meet with Caribbean Buyers from most of the Caribbean Markets Look out for Registration details in early 2013!
- 41. V. 2013 Activities Targeting Caribbean Buyers October 2013 Miami, Florida A Well Favored Trade Show among Caribbean and other Regional Food & Beverage Buyers!
- 42. Thank You!
Notas do Editor
- 1. Population - Excluding Cuba and Puerto Rico 2. GDP/Capita - U.S.=$46,000 3. Tourist Arrivals - 17.8 million stop-overs and 15.7 million cruise passengers / US visitors represented 46% of stop-overs or 8.2 million 4. Languages etc. – 5 Major influences 5. U.S. Ag. Exports to Caribbean - up 19% from 2006 and reached Record export levels 6. Overall U.S. market share AVG 40% to over 90% on some islands
- The vast majority of freight moving to the Caribbean and Central America is consolidated in Florida, particularly in South Florida Bermuda sources mostly from the NE and to a lesser extent from Jacksonville The success of consolidators is their proximity to the Caribbean and Central American market, their ability to offer a full range of products with supporting services at competitive prices Some consolidators carry product, some act as freight forwarders only Many consolidators selling to the Caribbean and Central America focus on the major categories of meat, seafood, produce, dairy and specialty products, but larger consolidators offer a full line of products Parallel Trading is a common complaint from Caribbean and Central American based distributors acting as exclusive agents for US brands as their local competitors are frequently able to import the same brands from consolidators at cheaper prices
- US manufacturers have access to a broad market and large number of buyers through a single “customer” (i.e. the consolidator) who takes care of multi-market sales and shipping and multi-customer servicing Many Caribbean importers are too small to directly import full containers from manufacturers but US manufacturers can expand product distribution over a greater number of small-scale buyers through consolidators offering these small customers mixed container shipments from several manufacturers Similarly in Central America 90% of the Retail Sector that imports directly do so through consolidators because of the small quantities and variety required There is a lower payment risk selling to consolidators vs. smaller-size regional buyers Consolidators have in-depth knowledge of their markets and contacts, and are better equipped to introduce new products to the region successfully Some major consolidators sell their own Private Label which is an alternative approach for US manufacturers to increase sales without the added expenses of registering and promoting new brands in Caribbean and Central American markets