
Recomendados
Recomendados
Mais conteúdo relacionado
Mais procurados
Mais procurados (19)
Destaque
Semelhante a Social media's role in agriculture
Semelhante a Social media's role in agriculture (20)
Último
Último (20)
Social media's role in agriculture
- 1. THE EXPANSION OF SOCIAL MEDIA IN AGRICULTURE: A USER PROFILE OF TWITTER’S @AGCHAT, @FOLLOWFARMER AND @TRUFFLEMEDIA FOLLOWERS By MEGHAN MARIA CLINE Bachelor of Science in Agriculture University of Georgia Athens, Georgia 2009 Submitted to the Faculty of the Graduate College of the Oklahoma State University in partial fulfillment of the requirements for the Degree of MASTER OF SCIENCE July, 2011
- 2. THE EXPANSION OF SOCIAL MEDIA IN AGRICULTURE: A USER PROFILE OF TWITTER’S @AGCHAT, @FOLLOWFARMER AND @TRUFFLEMEDIA FOLLOWERS Thesis Approved: Dr. Dwayne Cartmell Thesis Adviser Dr. Cindy Blackwell Dr. Jeff Sallee Dr. Mark E. Payton Dean of the Graduate College ii
- 3. ACKNOWLEDGEMENTS First and foremost, I thank God for the blessings He has bestowed on my life. They are too abundant to count. Secondly, I thank my loving family for their continuous support and faith in me from 850 miles away. I know it wasn’t easy! To an impressive agricultural communicator and mentor, Mike Deering for his professional guidance and refusal to let me second-guess my abilities as an agricultural communicator. I owe huge gratitude to my thesis committee for their guidance. I thank Dwayne Cartmell, who not only served as my adviser and committee chair but also served as a mentor. I thank Cindy Blackwell for always providing humor and a positive attitude in any kind of situation and teaching the most rewarding classes in my college career. I thank Jeff Sallee for welcoming me into the 4-H family when I did not know a soul. I thank Darin Grimm and John Blue for their generous help in distributing the survey. This research would not be possible without their help. I thank the Oklahoma State 4-H staff for being my family away from home. When I needed anything, they were always there with comforting words and many smiles. iii
- 4. If it weren’t for my Georgia girls, I would’ve been lost. Thanks to Kyla Nabb for always having a positive attitude and being the best officemate a grad student could ask for, and thanks to Katie Smith for always making me laugh and being the “Positive Patty” throughout this thesis experience. You are an excellent friend, and I hope you stay that way. Finally, I thank my home for the past two years, the state of Oklahoma, for providing me with the most genuine friends anyone could ask for, especially Robin Morris and Natalie Volturo. Oklahoma hospitality isn’t Southern hospitality…it’s much better. iv
- 5. TABLE OF CONTENTS Chapter Page I. INTRODUCTION……………………………..………………………….……………1 Background and Setting……………………………..…………………………….1 Statement of Problem……………………………..……………………………….4 Purpose and Objectives……………………………..……………………………..4 Scope of Study……………………………..……………………………………...5 Basic Assumptions……………………………..………………………………….5 Limitations……………………………..………………………………………….6 Significance of Study……………………………..……………………………….6 Definition of Terms……………………………..…………………………………7 Chapter Summary……………………………..…………………………………..8 II. LITERATURE REVIEW…..…………………..………………………….…………10 Introduction……………………………..……………………………………….10 Theoretical Framework: Uses and Gratifications Theory……………………….10 Progression of Agricultural Communications…………………………………...13 Media Dependency and Consumer Perceptions……………………………..…..16 Computer-mediated Communication……………………………..……………..18 History of Social Networks……………………………..……………………….19 Why Social Media? ……………………………..………………………………24 History of Twitter……………………………..…………………………………25 @AgChat, @FollowFarmer and @TruffleMedia……………………….27 “Agvocacy” Through Social Media……………………………..………………28 Double-edged Sword of Social Media……………………………..……………31 Chapter Summary……………………………..………………………………...31 III. METHODOLOGY Introduction……………………………..………………………………………..33 Purpose and Objectives……………………………..……………………………33 Population and Sample…………………..………………………………………34 Institutional Review Board……………………………..………………………..35 Research Design……………………………..…………………………………..36 v
- 6. Chapter Page Instrument Design……………………………..………………………………...36 Validity and Reliability……………………………..…………………………...37 Data Collection……………………………..……………………………………39 Data Analysis……………………………..……………………………………...40 IV. FINDINGS……………………………..…………………………………………….41 Introduction……………………………..………………………………………..41 Purpose and Objectives……………………………..……………………………41 Scope of Study……………………………..…………………………………….42 Respondents……………………………..……………………………………….42 Findings……………………………..…………………………………………...42 Findings related to Objective One……………………………..………………...43 Findings related to Objective Two……………………………..………………..55 Findings related to Objective Three……………………………..………………56 Findings related to Objective Four………………………………………………74 V. DISCUSSION AND RECOMMENDATIONS………………………………………76 Introduction………………………………………………………………………76 Purpose and Objectives…………………………………………………………..77 Scope of Study…………………………………………………………………...77 Major Findings…………………………………………………………………...78 Findings related to Objective One……………………………………….78 Findings related to Objective Two………………………………………79 Findings related to Objective Three……………………………………..79 Findings related to Objective Four………………………………………81 Conclusions………………………………………………………………………81 Conclusions related to Objective One……………………………………81 Conclusions related to Objective Two…………………………………...82 Conclusions related to Objective Three………………………………….82 Conclusions related to Objective Four…………………………………...83 Discussion/Implications………………………………………………………….83 Recommendations for Practice…………………………………………………..85 Recommendations for Research…………………………………………………85 REFERENCES……………………………..……………………………………………87 APPENDICES……………………………..…………………………………………….95 vi
- 7. Appendix A – Institutional Review Board……………………………..………………..96 Appendix B – Panel of Experts……………………………..…………………………...98 Appendix C – Script……………………………..……………………………………..101 Appendix D – Direct Message……………………………..…………………………..103 Appendix E – Survey Instrument……………………………..………………………..105 vii
- 8. LIST OF TABLES Table Page 1: Respondents’ Year of Birth……………………………..……………………………44 2: Respondents’ State of Residence……………………………..………………………44 3: Respondents’ Gender ………………………………………………………………..45 4: Respondents’ Ethnicities……………………………………………………………...46 5: Respondents’ Levels of Completed Education……………………………..…………47 6: Respondents’ Total Household Income……………………………………………….48 7: Respondents’ Type of Residence……………………………..……………………….49 8: Respondents’ Agricultural Background and Activity……………………………..…..52 9: Respondents’ Agricultural Literacy…………………………………………………...53 10: Respondents’ Occupations……………………………..…………………………….54 11: Respondents’ Agricultural Occupations……………………………………………..55 12: Threats to Agriculture……………………………..…………………………………56 13: Respondents’ Access to Social Media……………………………..………………...58 14: Respondents’ Twitter Accounts Followed……………………………..……………59 15: Respondents’ Number of Twitter Followers……………………………..………….60 16: Criteria Used to Follow Twitter Users……………………………..………………..63 17: Agricultural Hashtags……………………………..…………………………………65 viii
- 9. Table Page 18: Preferred Social Media Site for Gathering/Disseminating Agricultural Information..68 19: Response to "Twitter is the most efficient way to gather the agricultural news I need." …………………………..…………………………………...68 20: Respondents’ Twitter Check-Ins…………………………….………………………69 21: Posting Agricultural Information to Twitter…………………………………………70 22: Why Respondents Use Twitter……………………………..………………………..72 23: Social Media Serves Utilized by Respondents……………………………..………..73 24: Top Twitter Users to Follow for Agricultural News……………………………..….75 ix
- 10. LIST OF FIGURES Figure Page 1: Gratifications Sought and Obtained from the Media………………………………..12 2: Factors that Consumers Employ to Gain Agricultural knowledge and Outlook…….17 3: Launch Dates of Major Social Network Sites……………………………..………....21 4: Percent of American Farms with Internet Access……………………………..……..30 5: Respondents’ Eating Habits……………………………..…………………………...50 6: How Many Hours Per Week Respondents Spend on Social Media Sites for Agricultural Purposes……………………………………………………………………64 7: Respondents’ Trustworthiness of Agricultural Info Tweeted………………………...66 8: Respondents’ Behavior when Logged Onto Twitter……………………………..…...67 x
- 11. CHAPTER I INTRODUCTION Background and Setting The term “agriculture” has sharply differing meanings to consumers and producers. Regardless of one’s perception of agriculture, there is no doubt that “agriculture affects everyone” (Whitaker & Dyer, 2000). According to the 2007 U.S. Census of Agriculture, there are more than 2.2 million farms in the United States (United States Department of Agriculture National Agricultural Statistics Service, 2007). While 20 percent of Americans live in rural areas, only one percent works in agriculture (Carpio, Wohgenant, & Boonsaeng, 2008). With such few Americans directly involved in agricultural production, consumers rely on the mass media for agricultural information (Terry, Dunsford, & Lacewell, 1996). According to Pawlick, agricultural news is frequently misrepresented to urban audiences because the common reporter is not familiar with farming (1996). Many controversial issues revolve around agriculture (Westwood-Money, 2005), and consumers’ opinions of the agriculture industry are extremely reliant on the agricultural literacy of communicators in the media (Saunders, 2002). McCombs (1997) stated that research shows the news media has a powerful sway on what issues are valuable to the public. Therefore, it is important for producers and agricultural communicators to 1
- 12. disseminate truthful information to the public. Though agriculture is essential to the American economy, environment, and culture, the media often disregards it (Stringer & Thomson, 1999). One way agricultural communicators are combating this problem is by using social media services. As defined by Boyd and Ellison (2007), social network sites are web-based services that allow individuals to (1) construct a public or semi-public profile within a bounded system, (2) articulate a list of other users with whom they share a connection, and (3) view and traverse their list of connections and those made by others within the system. (p. 1) Social media allow people who were formerly limited to the receiving end of communications to be more participatory (Anderson-Wilk, 2009). Thirty-seven percent of people who use the Internet are involved in participatory news via social media sites such as Twitter (Purcell, Rainie, Mitchell, Rosenstirl, & Olmstead, 2010). Social media allow the public to communicate, usually informally, with one another about virtually anything. Social media also aid in developing powerful, targeted interpersonal communication that can create publicity as well as large-scale mobilization (Anderson- Wilk, 2009). According to a 2010 Pew Internet Survey, more than half of the people who use social media sites and seek out news online say they receive their news from people they follow online (Purcell et al., 2010). Of all Internet users, 28 percent receive their news via online social networking (Purcell et al., 2010). Organizations that often attack agriculture have a large, growing presence in social media, with fans of the People for Ethical Treatment of Animals (PETA) Facebook 2
- 13. page skyrocketing 25-fold in just one year (Hest, 2010). Since many Americans are several generations removed from the farm and do not understand where their food originates (Barbassa, 2010), this has the potential to greatly influence consumer attitudes and behaviors. However, agriculturalists are combating the negative voices by joining the conversation and communicating via Twitter, a fast paced informational social media website that allows users to display information in real time, free of charge (Barbassa, 2010). Users share information in small posts called “tweets” consisting of a maximum of 140 characters of text that can include links to photos, videos, or other media (Twitter, 2011). Since its launch in 2006, Twitter has grown to more than 175 million registered users that post 95 million tweets each day (Twitter, 2011). Twitter is unique from other social media sites, as it does not require bi-‐directional affirmation (Boyd & Ellison, 2007). To follow a user on Twitter, they do not have to follow you. The relationship is one-directional but can, and often is bi- directional. With user profiles limited to a small photo and brief biography, Twitter is different from other social media sites in that it is focused on the written (typed) word. Of all Americans who access the Internet, 19 percent use Twitter or other ways to update their status (Purcell et al., 2010). According to Brown and Adler (2008), for communication to be more effective, there needs to be interactivity among participants that allow them to ask questions and converse with others. When people feel like they belong in the conversation rather than just receiving information, they are more likely to be connected to the material and use the information (Food and Agriculture Organization, 2006). Social media proves to be a 3
- 14. helpful tool for communicating with consumers who are unfamiliar with agriculture (Knutson, 2011). Statement of Problem With fewer and fewer agricultural workers every year in the United States, the agricultural literacy level of our nation suffers (Saunders, 2002). As Americans continue to move from rural to urban areas, their understanding of agriculture will steadily drop (Elliot, n.d.). To successfully communicate the many messages of agriculture to the public, agricultural communicators must not only distribute correct information, but they must also “agvocate”, or advocate for agricultural purposes (AgChat Foundation, 2011). Agricultural communicators, including farmers and ranchers, use social media to combat the detrimental and costly actions carried out by anti-agriculture organizations. To successfully “agvocate”, agriculturalists must first understand who is receiving the benefit of the information. The utilization of social media has altered the dynamics of how communicators, agricultural communicators included, connect with their audiences. Most Americans are several generations removed from the farm and do not understand how their food is produced (Barbassa, 2010). Therefore, an understanding of who and what organizations American consumers rely on for agricultural information is imperative to the agricultural communications industry. Purpose and Objectives 4
- 15. The purpose of this study was to identify @AgChat, @FollowFarmer and @TruffleMedia followers. The following objectives were developed to satisfy the purpose of this study: 1. Identify @AgChat, @FollowFarmer and @TruffleMedia followers’ background and professional experience related to agriculture. 2. Identify @AgChat, @FollowFarmer and @TruffleMedia followers’ perceptions of agricultural threats. 3. Determine where @AgChat, @FollowFarmer and @TruffleMedia followers receive agricultural news from and what other social media tools they use to keep up with agricultural news. 4. Determine the top five agriculturally-focused Twitter users that are followed by @AgChat, @FollowFarmer and @TruffleMedia followers. Scope of Study This study included registered Twitter users who follow @AgChat, @FollowFarmer and @TruffleMedia accounts. This population was selected because these three Twitter accounts focused on agriculture are among the most followed on Twitter. The sample size was of comparable proportion across the three Twitter accounts. The sample was sent a direct message with a survey link (N = 7,275) and asked to complete the survey. Basic Assumptions 5
- 16. The following statements will be assumed to be true throughout this study: 1. All participants have an interest in agriculture and/or food. 2. Participants provided honest answers to questions asked. 3. The instrument created truthful responses from participants. 4. All participants are interested in receiving and/or distributing agricultural knowledge from social media. Limitations The following limitations were considered in this study: 1. Data collection was restricted to people with Internet access. 2. Data collection was limited to people with a valid Twitter account who checked their direct messages between May 13, 2011, and June 9, 2011. 3. The sample used for this study does not reflect every Twitter user who receives and/or distributes agricultural info. Significance of Study Given that Facebook has more than 500 million active users (Facebook, 2011), and Twitter has more than 175 million users (Twitter, 2011), it is safe to say that social media are some of the newest and most popular forms of modern communication. All types of people use social media to communicate with one another (Van Dalsem, 2011). With the extensive use of social media, it is important to understand how people are satisfying their needs through Twitter (Chen, 2011) as well as the motives behind using social media. Agricultural communicators will benefit from this study because they will 6
- 17. be able to better communicate with other users by using the demographic information received from respondents. Definition of Terms Agricultural communications – “Encompasses all kinds of human communication in relation to agriculture, food, natural resources and rural interests” (Zumalt, n.d., p. 2). Agriculturalist – Someone concerned with the science or art of agriculture (Princeton University, 2011). Agvocacy – The act of advocating for agricultural purposes (AgChat Foundation, 2011). Blog – “A type of website that is usually arranged in chronological order from the most recent ‘post’ (or entry) at the top of the main page to the older entries towards the bottom” (Rowse, 2006, p. 1). Computer-mediated communication (CMC) – Communication that is carried out via computers (Nellis, 2004). CMC is a modern method of communication and can include e-mail, chat rooms, Twitter, etc. Consumer – A person who uses economic goods and services (Consumer, 2011). Direct message – A private message sent via Twitter to a follower of the account it is sent from (Twitter, 2011a). Disseminate – To spread information (Disseminate, 2011). 7
- 18. Hashtag – “A word with the # symbol in front of it, often used to define the topic of the Tweet and make the tweet easily searchable by other users” (Van Dalsem, 2011, p. 5). Medium – A channel of communication (Medium, 2011). RSS feed – A news feed service that allows Internet users to keep track of websites when they are updated (similar to an electronic magazine subscription), also known as Really Simple Syndication (“What is RSS?”, 2010). Social network sites – “Web-based services that allow individuals to (1) construct a public or semi-public profile within a bounded system, (2) articulate a list of other users with whom they share a connection, and (3) view and traverse their list of connections and those made by others within the system” (Boyd & Ellison, 2007, p. 1). Social network sites, social media services and social media can be used interchangeably. Tweet (noun) – A 140 character or less message that is posted to Twitter (Twitter, 2011a). Tweet (verb) – The act of posting a tweet to Twitter (Twitter, 2011a). Twitter – A social media website that allows users to exchange 140 characters of information (tweets) in real time (Twitter, 2011a). Chapter Summary With an increase in social media usage, agricultural communicators need to be able to identify and understand the audience with which they are communicating. Since a growing population is moving away from agriculture (Barbassa, 2010), it is imperative 8
- 19. for agriculturalists to communicate their message, both proactively and reactively, to consumers. Chapter one serves as an outline to research involving agriculture and social media. Along with a problem statement, purpose and objectives are included. This chapter emphasizes the importance of “agvocating” to consumers. 9
- 20. CHAPTER II LITERATURE REVIEW Introduction The purpose of this chapter is to review literature that focuses on the importance of social media in agricultural communications and understanding “agvocacy” users. This chapter also provides background information and gives context to research conducted. Specific areas covered in this chapter include theoretical framework, progression of agricultural communications, media dependency and consumer perceptions, computer- mediated communication, history of social networks, why social media, history of Twitter, “agvocacy” through social media, and double-edged sword of social media. Theoretical Framework: Uses and Gratifications Theory The original developers of the uses and gratifications theory, Katz, Blumer, and Gurevitch, placed emphasis on the individual and their reasons for choosing media (Carrier, 2004). The theory addresses how people satisfy needs and wants through their choice of media (Carrier, 2004). This theory does not view consumers of the media as a target for the media to hit; rather, consumers actively choose media messages with specific purposes in mind (Carrier, 2004). Contrary to theories about old media usage, the uses and gratifications theory assumes that audiences are active and freely elect which 10
- 21. mediums to take information in order to satisfy a need (Perry, 2004). In today’s society, consumers have the luxury of choosing from multiple news distributors and multiple formats to receive information. Though the media plays an important part in the composition of the uses and gratifications theory, the consumer plays an even more significant role: it regards the media as less powerful than the consumer of the media (Perry, 2004). Uses and gratifications theory research contends that humans have social and psychological needs and wants, and those needs and wants direct researchers to seek new methods in which the media can offer a solution (Perry, 2004). Chen (2011) suggested that if people regularly use Twitter out of all other social media sites, Twitter must be meeting their needs (whatever they may be). Carrier (2004) stated the uses and gratifications theory asserts that consumers of media choose which media messages and products interest them, and this interest causes members of an audience to have varied incentives toward gaining gratification (see Figure 1). For example, many people can follow the @AgChat Twitter account and participate in sessions, but all of those users do not seek @AgChat for the same reason. Some users might use the service because they find it exciting (intrinsic cultural or aesthetic enjoyment) and feel smart when answering questions (gaining a sense of security through knowledge), while others may use the service to gain a basic agricultural knowledge (learning, self-education) and because friends who share their same beliefs also use the service (reinforcement for personal values). Though Figure 1 illustrates multiple examples of gratifications satisfied by accessing media, there are countless more with new communications technologies. It is natural for people to gather different results 11
- 22. from one message since people seek media with different motives in mind (Carrier, 2004). Gratification Examples Information ·Finding out about relevant events and conditions in immediate surroundings, society, and the world ·Seeking advice on practical matters or opinions and decision choices ·Satisfying curiosity and general interest ·Learning, self-education ·Gaining a sense of security through knowledge Personal identity ·Finding reinforcement for personal values ·Finding models of behavior ·Identifying with valued others (in the media) ·Gaining insight into one’s self Integration and ·Gaining insight into circumstances of others: social empathy social interaction ·Identifying with others and gaining a sense of belonging ·Finding a basis for conversation and social interaction ·Having a substitute for real-life companionship ·Helping to carry out social roles ·Enabling one to connect with family, friends, and society Entertainment ·Escaping or being diverted from problems ·Relaxing ·Getting intrinsic cultural or aesthetic enjoyment ·Filling time ·Gaining emotional release ·Experiencing sexual arousal Figure 1. Gratifications Sought and Obtained from the Media (McQuail, 1983). 12
- 23. According to Perry (2004), four qualifications must be met in order for the uses and gratifications theory to explain how the media function as tools for consumers: (1) when media use is purposeful and intentional; (2) when the purposive media choices are driven by the user’s felt needs as the person weighs all possible options to meet those needs; (3) when individuals initiate the media selections they make as opposed to being sucked into an environment where media are forced upon them or when the user has little role in selecting content; and (4) when the individual understands and can articulate his or her reasons for choosing specific media content. (p. 218) In Perry (2004), Katz, Blumer, and Gurevitch stated that when these four conditions are present, the uses and gratifications theory can justify the following: “(1) how the media are used by consumers to satisfy their needs, (2) the motives for media choices and usage patterns, and (3) the media’s functions for individuals based on their personal needs, motives, and communication behaviors.” (p. 218) Progression of Agricultural Communications Before the start of American agricultural communications, farmers received information from Europe (History of agricultural communications, n.d.). The first American agricultural publication, Thomas Hariot’s Briefe and True Report of New Found Land of Virginia, was published in 1588, and in 1638, the first Colonial Almanac was published (History of agricultural communications, n.d.). In the late eighteenth century, American agricultural societies such as the Philadelphia Society for Promoting 13
- 24. Agriculture (Philadelphia Society for Promoting Agriculture, n.d.), where members established agricultural libraries as well as published their own agricultural works, were adopted from Europe (Boone, Meisenbach, & Tucker, 2000). The need to share agricultural information with rural audiences initiated the start of agricultural communications in America (Boone et al., 2000). Influential leaders such as George Washington, Thomas Jefferson, and Benjamin Franklin were fundamental in characterizing the agricultural communications field (Boone et al., 2000). Later in the nineteenth century, agricultural journalists worked for the Chicago Tribune and Des Moines Register (Anderson-Wilk, 2009). Agricultural journalism took off with dissemination of American Farmer on April 2, 1819, by the “Father of American Agriculture” John Stuart Skinner (History of agricultural communications, n.d.). Perhaps the most widespread development in agricultural communications was the establishment of The United States Department of Agriculture (USDA). The USDA was launched in 1862 to facilitate distribution of agricultural news and information to the public (Boone et al., 2000). Academia soon followed with the first agricultural journalism course taught at Iowa State University in 1905 and passage of the Smith-Lever Act of 1914, which established university extension services to disseminate agricultural information to the American population (History of agricultural communications, n.d.). The University of Wisconsin established the first department of agricultural communications in 1908 (History of agricultural communications, n.d.). The first broadcast of weather and crop reports was put on air via Morse code in 1915 (History of agricultural communications, n.d.). The radio was an integral part of agricultural communications by the 1920s (Boone et al., 2000) with Frank Mullin, the 14
- 25. first farm broadcaster, taking the air from Pittsburg, Pa. (History of agricultural communications, n.d.). Radio coverage included soil conservation by the 1930s (Boone et al., 2000). Agricultural communications took to television in 1951 in Memphis, Tenn. (History of agricultural communications, n.d.). By 1970, the average American farmer subscribed to seven periodicals (Boone et al., 2000). Also in 1970, the Agricultural Communicators of Tomorrow organization for agricultural communication professionals and students was established (History of agricultural communications, n.d.). The agricultural communications field had developed significantly by the year 2000 with more than 100 newspapers and more than 400 magazines in circulation, more than 1,000 AM stations and nearly 750 FM stations, and three television stations devoted solely to agriculture (History of agricultural communications, n.d.). In the 1980s, the agricultural communications industry declined along with the farming industry (Tucker, Whaley, & Cano, 2003). Farm publications were challenged by dwindling revenues since agricultural businesses cut back on advertising, causing several publications to go out of business (Tucker et al., 2003). As the American population became less involved in agriculture in the 20th century, agricultural newspaper coverage shifted spotlight from agricultural production to the effect of agriculture on the environment and consumer health (Boone et al., 2000). Today, agricultural communications has taken on new forms. Farmers and ranchers are participating in social media to communicate agricultural information to consumers by way of Twitter, Facebook, YouTube, LinkedIn, blogs, etc. (Karstens, 2010; Knutson, 2011). 15
- 26. Media Dependency and Consumer Perceptions For American agriculture to be a prominent force in the global agricultural marketplace, it is necessary for agriculturalists to understand who and where their consumers are and how to please them (Allen, 1993). It is also valuable to recognize the methods in which consumers obtain information and make decisions regarding agriculture (Elliot & Frick, 1995). It is imperative for agricultural communicators to maintain an open dialogue with consumers (Allen, 1993). However, a large portion of the American public is fundamentally illiterate in regards to science (Gregory & Miller, 1998) and has little to no understanding of how agriculture works (Allen, 1993). This poses a greater challenge for agricultural communicators. Consumers take salience cues from the media to determine the importance of news, meaning that the news’ importance is dependent on how much the media covers it (Wanta, Golan, & Lee, 2004). The amount of time an issue or event is covered by the media will persuade how consumers will think (McCombs, Shaw, & Weaver, 1997). Elliot and Frick (1995) performed a study in which they researched faculty members at land grant universities to determine levels of agricultural awareness. After completion of this study, Elliot and Frick built a conceptual framework explaining the factors that play a part in agricultural awareness (1995). The conceptual framework portrays three main factors that consumers employ to gain agricultural knowledge and outlook: (1) personal characteristics, (2) education, and (3) participation in agricultural activities (Elliot & Frick, 1995). These factors are illustrated in Figure 2. 16
- 27. Figure 2. Factors that Consumers Employ to Gain Agricultural Knowledge and Outlook (Elliot and Frick, 1995). Carrier (2004) described Walter Lippmann’s idea that the information from the media that is beyond consumers’ familiarity plays a significant role in defining consumer perceptions and actions. To demonstrate this concept, Lippmann illustrated a situation in which a group of French, German, and English people lived on an island just before World War I began (Carrier, 2004). The people lived peacefully and only received news via a British mail ship; once the mail ship brought word that the French and English had gone to war against Germany, the relations on the island were altered accordingly (Carrier, 2004). This situation parallels the control that the mass media has on consumer perceptions of agriculture. If someone has lived within the city limits his or her entire life 17
- 28. and has never come into contact with a farmer or rancher, the only perception they have of agriculturalists are the ones that are provided to them by mass media. This gives the media an enormous, and potentially devastating, power when it comes to consumer perceptions of agriculture. Carrier (2004) illustrated this point when she said that the media operates as our eyes to the world that is beyond our reach. American agriculturalists fear that American consumers believe the propaganda disseminated by animal rights advocates since most Americans are several generations removed from the farm, are not familiar with farmers and do not understand how their food is produced (Barbassa, 2010). Most of the agricultural information that consumers receive is from the Internet where farmers and ranchers are often left out of the conversation (Barbassa, 2010). Computer-Mediated Communication Though selection of media often results in negative consequences, it also brings about positive outcomes. According to Nellis (2004), the uses and gratifications theory research shows that consumers who participate in computer-mediated communication (CMC) have multiple constructive consequences such as socializing, sustaining relationships, playing games, and gaining emotional backing from online exchanges with other CMC users. According to Chen (2011), CMC sites, including Twitter, present the potential for satisfying the need to connect with others. CMC utilizes new communication technologies by means of a computer (Nellis, 2004). CMC encompasses many modern methods of communication such as e-mail, chat rooms, and even Twitter. Though CMC is used mainly for social communication, it also 18
- 29. fulfills the four roles of traditional mass media: information, explanation, entertainment, and transmission of culture (Nellis, 2004). With the advent of smart phones that allow users to connect to the Internet without having to carry around a computer, CMC has become easier and more convenient than ever. Many times, CMC is as synchronous as face-to-face interaction, depending on the method of communication (Nellis, 2004). Since smart phones allow users to connect to the Internet, CMC can be performed virtually anywhere with an Internet connection. Smartphone users can choose to enable notifications of communication, allowing them to reply or comment instantly. With new methods of communication come new expectations since new communication technologies result in unique characteristics to the dynamics of communication (Nellis, 2004). For example, online news formats differ greatly from traditional news print formats in that online versions may have more photos, videos, or interactive features (Nellis, 2004). Readers can usually post comments on the spot or discuss with other readers (Nellis, 2004). These characteristics, along with many more, are what separate old and new media formats. Social media falls into the category of new media. Its interactivity and instantaneous feedback options are what have allowed social media and other CMC methods to flourish with new technologies. As cited in Nellis (2004), Kiesler, Siegel, and McGuire claimed that the fast pace and effortlessness qualities of CMC have researchers questioning whether consumers have impractical expectations for instant feedback regardless of the direct nature of CMC. History of Social Networks 19
- 30. Social network sites permit users to (1) develop a profile, (2) maintain a list of users with which they communicate, and (3) view and search their contact list as well as others’ lists within the site (Boyd & Ellison, 2007). In 1997, the first social network site SixDegrees was created; it was the first of its kind to incorporate all three components of a social network site (Boyd & Ellison, 2007). Though many people were utilizing the Internet, most did not have a pool of online friends, and in 2000, SixDegrees shut down due to lack of interactivity (Boyd & Ellison, 2007). Between 1997 and 2001, many social network sites came and went with many being dating profile sites (Boyd & Ellison, 2007). In 2001, Ryze surfaced as a business network site (Boyd & Ellison, 2007). The founders of Ryze worked closely with the founders of Tribe.net, LinkedIn and Friendster with the idea that all four sites could work together without competing (Festa, 2003). Of the four, LinkedIn was the only social media site to succeed and now has more than 100 million professional members (LinkedIn, 2011). Figure 3 illustrates the timeline of social network site history. 20
- 31. Figure 3. Launch Dates of Major Social Network Sites (Boyd & Ellison, 2007). 21
- 32. Since 2003, many social network sites have been introduced to the online community. Such social network sites included: Couchsurfing, which united jet setters with people who spend much of their time on a couch, and MyChurch, which connected Christian church members (Boyd & Ellison, 2007). Not only were social network sites created, they also stemmed from already existing websites. Websites, such as Flickr and YouTube, which concentrated on sharing media, began to employ aspects of social network sites and became social network sites themselves (Boyd & Ellison, 2007). MySpace, one of the most notably famous social network sites, was introduced in 2003 to compete with Friendster (Boyd & Ellison, 2007). Once Friendster announced that its services would require a fee, former Friendster users switched to other social network sites such as MySpace and told other users to as well (Boyd & Ellison, 2007). MySpace capitalized on this opportunity and welcomed Friendster users, including Indie-rock bands that were expelled from Friendster (Boyd & Ellison, 2007). Other bands flocked to MySpace to promote themselves, and the “bands-and-fans” dynamic was advantageous for bands, fans, and MySpace (Boyd & Ellison, 2007). By 2004, the MySpace phenomenon had reached teenagers, and teenage users referred their friends, many of who where younger (Boyd & Ellison, 2007). Unlike Friendster, MySpace allowed minors to join (Boyd & Ellison, 2007). As MySpace grew more popular, three groups of users emerged: musicians, teenagers, and post-college users (Boyd & Ellison, 2007). The teenagers and post-college groups rarely interacted, except when they conversed over music (Boyd & Ellison, 2007). According to Boyd and Ellison, MySpace caught a large amount of media attention when it was purchased by News Corporation in 2005. As a 22
- 33. result, legal and safety concerns surfaced about sexual exchanges occurring between minors and adults (Boyd & Ellison, 2007). Needless to say, many MySpace users and the parents of users cancelled MySpace accounts because of the scare. Shortly after MySpace declined, Facebook was launched. In 2004, Facebook was introduced and was only available to Harvard University students (Yadav, 2006). However, it did not take Facebook long to open its doors to other college and university students. Though Facebook catered to college students, anyone with a college or university email address could join (Boyd & Ellison, 2007). In the next year, Facebook gradually enlarged to allow high school students, professionals and, eventually, anyone regardless of their occupational status (Boyd & Ellison, 2007). Until 2005, Facebook was the only social network site that allowed users to employ external applications to personalize profiles; also unique to Facebook was the choice for users to have their profiles completely public (Boyd & Ellison, 2007). Facebook continues to be a leading social network site. As of 2011, Facebook has more than 500 million active users, and half of those users log on to Facebook any given day (Facebook, 2011). Not only do social network sites appear on a computer, they are also portable. According to a 2010 Pew Internet Survey, 33 percent of cell phone users retrieve news on their cell phone (Purcell et al., 2010). The more Internet capable devices a person owns, the higher the likelihood they are to use Twitter (Purcell et al., 2010). Agriculturalists are also utilizing on-the-go social media applications to educate consumers about where their food originates (Barbassa, 2010). Webinars and trainings 23
- 34. are being held to educate thousands of agriculturalists about how to use social media when they are on the farm (Barbassa, 2010). Why Social Media? People visit social network sites for many reasons. These sites no longer serve as a place for meeting strangers; on much of successful social network sites, users are mostly communicating with other users who already belong to their extended social network (Boyd & Ellison, 2007). Many social media users search for offline friends or acquaintances online that they already know. Many social network sites allow users to control their privacy settings. However, the display of users’ connections is a fundamental part of social network sites (Boyd & Ellison, 2007). By searching “friends” or “followers” lists of fellow users, users can meet and communicate with other users who share similar interests or have similar profile characteristics. Twitter and Facebook help to facilitate this by suggesting “friends” or “followers” based on profile characteristics. According to Anderson-Wilk (2009), human beings are social creatures whose way of thinking and actions are swayed by others. Social media are beneficial tools in assisting directed interpersonal communications that have the capability of creating truthful agricultural awareness (Anderson-Wilk, 2009). In order for communication to be effective, it must be multidirectional: people should have the opportunity to interact, discuss, and ask questions (Brown & Adler, 2008). People are more likely to be engaged with information they are given when they feel like they are a part of the communication 24
- 35. process rather than strictly receivers of information (Food and Agriculture Organization, 2006). According to Nellis (2004), old media and new media operate on separate models of communication. Old mass media include television, newspapers, etc. Old mass media operates on the one-to-many model of communication where one source sends out a message to multiple people, and receivers cannot respond in the same way (Nellis, 2004). New communication media includes many social media platforms. Online communication has invalidated the old one-to-many model of communication, which allows the uses and gratifications theory to be more applicable to social media (Ko, 2000). New communication media operates on the many-to-many model of communication where people can send out messages to multiple people, and the receivers can respond in the same way (Nellis, 2004). Twitter is considered a new communication medium since it allows the many-to-many communication model of interactivity that old media does not. History of Twitter The social media site Twitter allows users to exchange information (tweets) in real time (Twitter, 2011). Twitter users establish a profile by registering and uploading an optional photo and a brief biography (Twitter, 2011). From there, users are ready to begin sharing information with millions of users. Each post, or tweet, is limited to 140 characters that may include virtually any information that a user wishes to share including website links, photos and videos (Twitter, 2011). Twitter limits tweets to 140 characters because the standard text messages length is 160 characters; the other 20 25
- 36. characters are reserved for Twitter handles (Twitter, 2011). If a user finds a tweet or a fellow Twitter user interesting, he or she may “follow” that user, and tweets from followed users show up on the Twitter homepage once the user is signed in (Twitter, 2011). Twitter can serve as a virtual interactive newspaper that only delivers content in which a specific user is interested in. Twitter allows users to interact with one another in multiple ways including mentions (@) and retweets. Twitter users may mention one another by username preceded by the “@” sign, and the username mentioned will be hyperlinked to the specific user’s profile, so the tweet will show up on the mentioned user’s Twitter homepage (Twitter, 2011). Twitter users may share existing information from other users’ tweets by “retweeting” posts so the user can share the same information with their followers (Twitter, 2011). Hashtags (# followed by a word or phrase) allows Twitter users to group related tweets into a specific category (Twitter, 2011a). For example, many tweets that involve agriculture have “#ag” listed somewhere within the tweet. Twitter users can search “#ag” and find every agriculturally-related tweet containing “#ag”. In 2009, Mike Haley (@farmerhaley), an Ohio farmer who raises grain and purebred Simmental cattle (M. Haley, personal communication, June 4, 2011) posted the tweet: “My Bday Wish: to get #moo to trend Today at 1:00 EST (10:00 AM PST) to show everyone's support of #family #dairy #farms” (Hest, 2010). In other words, Haley attempted to get #moo to be one of the leading topics listed (trending) on Twitter; he succeeded by keeping #moo on the trending list for more than seven hours (Hest, 2010). Though Haley said it did not raise the price of milk, it raised awareness (Hest, 2010). 26
- 37. @AgChat, @FollowFarmer and @TruffleMedia The three Twitter accounts that were used for this study were @AgChat, @FollowFarmer and @TruffleMedia. @AgChat is a scheduled regulated conversation carried out via Twitter every Tuesday and is open to anyone with a Twitter account (AgChat Foundation, 2011a). The goal of @AgChat is to maintain an open exchange of ideas concerning agriculture (AgChat Foundation, 2011a). For registered Twitter users to participate in @AgChat, they must go to http://www.tweetchat.com and enter “#AgChat”. This way, the #agchat hashtag is automatically is entered when tweeting during the conversations, allowing users to view the rapid conversation in real time, and their tweets will be archived (AgChat Foundation, 2011a). Any Twitter user can follow the @AgChat account regardless of if they participate in @AgChat sessions. At the time the survey was disseminated, the @AgChat Twitter account had more than 12,200 followers (D. Grimm, personal communication, April 16, 2011). @FollowFarmer is a Twitter account that compiles a list of agriculturalists who use Twitter. The @FollowFarmer account was created by Mike Haley (@farmerhaley), a fifth generation farmer who raises grain and purebred Simmental cattle (M. Haley, personal communication, June 4, 2011). Haley wanted to create a resource for Twitter users who wanted to connect to agriculturalists, so he began a list of quality agriculturally related Twitter accounts (M. Haley, personal communication, June 4, 2011). Darin Grimm (@kansfarmer), a fellow farmer who raises corn, soybeans, wheat and sunflowers and has a cattle feedlot, turned the list into an online searchable database (M. Haley, personal communication, June 4, 2011). Twitter users can send public messages to the 27
- 38. account with their interest to be added to the @FollowFarmer list. At the time the survey was disseminated, the @FollowFarmer Twitter account had over 2,700 followers (D. Grimm, personal communication, April 16, 2011). The @TruffleMedia Twitter account was created by John Blue, a communications professional who specializes in social media for the food, fuel, and fiber industry (Truffle Media Networks, 2011). Blue serves as the Chief of Community Creation for Truffle Media Networks, LLC, a digital platform that disseminates agriculture business-focused media. Truffle Media Networks began with a podcast series and is growing to integrate audio, video, and social media for agriculturalists (J. Blue, personal communication, June 4, 2011). Truffle Media, LLC produces multiple programs such as BeefCast, CropVillage, DairyCast, PoultryCast, SwineCast, and This Week In Ag (Truffle Media Networks, 2011). Truffle Media Networks, LLC has an active presence in social media including Twitter, Facebook, Google, Flickr, and LinkedIn (Truffle Media Networks, 2011). At the time the survey was disseminated, the @TruffleMedia Twitter account had over 2,500 followers (D. Grimm, personal communication, April 16, 2011). “Agvocacy” Through Social Media Since social media users do not have to be professional communicators, any agriculturalist can “agvocate” through social media by communicating to consumers directly without having to go through large agricultural organizations (Knutson, 2011). Social media allows for user-expert interaction as well as user-user interaction (Anderson-Wilk, 2009). Through social media, professional communicators can hone their skills by listening and responding to users’ questions and concerns (Anderson-Wilk, 28
- 39. 2009). When user-to-user communication is taking place, users can put information into their own words and make difficult concepts easier to understand (Anderson-Wilk, 2009). Not only are consumers using social media, but farmers are also taking advantage of the services. Farmers are using BlackBerrys and iPhones to access social media while on the tractor (Karstens, 2010). With the percentage of farms equipped with Internet access increasing (United States Department of Agriculture National Agricultural Statistics Service, 2007), it is convenient for agriculturalists to engage in “agvocacy” through social media. The percentage of farms with Internet access has increased from 50 percent to 57 percent from 2002 to 2007 (United States Department of Agriculture National Agricultural Statistics Service, 2007) (see Figure 4). Along with Twitter, farmers use Facebook, YouTube, LinkedIn, blogs, etc. to communicate agricultural information to consumers (Karstens, 2010; Knutson, 2011). Ree Drummond, also known as the Pioneer Woman, is a well-known American writer, social media user and “agvocate”. Drummond, who was raised on a golf course far away from agricultural activities, now writes, blogs, photographs, tweets, and Facebooks about her life as a wife of a rancher (Drummond, 2011). Though Drummond puts emphasis on dry humor in communications to her followers, she also includes large amounts of information about the agricultural activities that happen on her Oklahoma cattle ranch. Perhaps this is the reason why she has two books listed on the New York Times best seller list (The New York Times, 2011), has nearly 200,000 Twitter followers, and more than 270,000 Facebook “likes” (Drummond, 2011). Agriculturalists use social media for a variety of reasons. Some agriculturalists use social media for proactive communication while others reactively communicate. 29
- 40. Some farmers join Twitter to educate themselves and/or educate consumers on agricultural policy (Thorstensen, 2010) or communicate agriculture to consumers whose only link to agriculture is the food they eat (Knutson, 2011), while others use Twitter out of worry that anti-agricultural organizations will use social media to reach uneducated consumers (Hest, 2010; Barbassa, 2010). Farmers and ranchers typically are not the face of social media usage, but when the agriculture industry is attacked, they get involved via social media (Barbassa, 2010). Figure 4. Percent of American Farms with Internet Access (United States Department of Agriculture, 2007). 30
- 41. Double-Edged Sword of Social Media Though social media can be extremely useful tools, there are downsides that can and do hinder “agvocacy”. When there is user-to-user interaction, many times there is no scientific evidence to support many of the statements being made (Anderson-Wilk, 2009). People who utilize social media sites are more likely to pass along news links in their emails than Internet users who do not utilize social media (Purcell et al., 2010). If the news is truthful or positive regarding agriculture, this is beneficial to consumers’ perceptions of agriculture. However, organizations such as PETA and The Humane Society of the United States, the nation’s largest animal protection organization, are active users of social media (Knutson, 2011). This makes agricultural communicators’ jobs all the more difficult. Animal rights advocates utilize social media to offer negative publicity to the agricultural industry because these groups do not have the money to spend on advertisements (Barbassa, 2010). Not only must agricultural communicators professionally communicate correct information about the agricultural industry, they must now “agvocate” because of the anti-agriculture organizations voicing opinions. Chapter Summary This chapter provides a review of literature related to agricultural communications, specifically social media as it relates to agriculture. It supplies detailed information about Twitter’s @AgChat, @FollowFarmer and @TruffleMedia accounts and tracks the birth and development of agricultural communications to what it is today. 31
- 42. From the first American agricultural publication in 1588 (History of agricultural communications, n.d.) to current social media usage in agriculture by farmers and ranchers to communicate agricultural information to consumers (Karstens, 2010; Knutson, 2011), agricultural communications have come a long way since its inception. Though the theoretical framework of the uses and gratifications theory was developed far before the Internet came to being, its application is well suited for social media research. This chapter stresses the importance of truthful and open agricultural communication to consumers given that a large portion of the American public is fundamentally illiterate in regards to science (Gregory & Miller, 1998) and has little to no understanding of how agriculture works (Allen, 1993). Also included in this chapter are methods of social media, giving emphasis to Twitter, and the history of social networks since its launch in 1997. Motives for using social media are also discussed, including its multidirectional dynamic and users’ wants and needs. Social media is used in the “agvocacy” process not only by consumers but also by farmers and ranchers. Along with Twitter, farmers use Facebook, YouTube, LinkedIn, blogs, etc. to communicate agricultural information to consumers (Karstens, 2010; Knutson, 2011). 32
- 43. CHAPTER III METHODOLOGY Introduction The purpose of this chapter is to discuss the methods used to perform this study. Reiterated within the chapter are purpose, objectives and scope of the study. Also covered in the chapter are research and instrument design, validity and reliability of the instrument, and methods used to collect and analyze data. Purpose and Objectives The purpose of this study was to identify @AgChat, @FollowFarmer and @TruffleMedia followers. The following objectives were developed to satisfy the purpose of this study: 1. Identify @AgChat, @FollowFarmer and @TruffleMedia followers’ background and professional experience related to agriculture. 2. Identify @AgChat, @FollowFarmer and @TruffleMedia followers’ perceptions of agricultural threats. 3. Determine where @AgChat, @FollowFarmer and @TruffleMedia followers receive agricultural news from and what other social media tools they use to keep 33
- 44. up with agricultural news. 4. Determine the top five agriculturally-focused Twitter users that are followed by @AgChat, @FollowFarmer and @TruffleMedia followers. Population and Sample The population (N = 7,275) consisted of registered Twitter users who follow @AgChat, @TruffleMedia and @FollowFarmer accounts. @AgChat is a weekly, moderated chat carried out via Twitter with the simple goal of maintaining an open exchange of ideas concerning agriculture (AgChat Foundation, 2011a). At the time the survey was disseminated, the @AgChat Twitter account had more than 12,200 followers (D. Grimm, personal communication, April 16, 2011). @FollowFarmer is a Twitter account that compiles a list of agriculturalists who use Twitter. At the time the survey was disseminated, the @FollowFarmer Twitter account had over 2,700 followers (D. Grimm, personal communication, April 16, 2011). @TruffleMedia is a digital platform that disseminates agriculture business-focused media (J. Blue, personal communication, June 4, 2011). At the time the survey was disseminated, the @TruffleMedia Twitter account had over 2,500 followers (D. Grimm, personal communication, April 16, 2011). Administrators of the three accounts sent a private direct message to their followers with a link requesting they complete the survey. This population was selected because these three Twitter accounts focused on disseminating agricultural information and were among the most highly followed on Twitter based on the researcher’s perspective. Given that Twitter has a limit on the number of direct messages that can be sent from an account each day, the researcher decided to sample this population. 34
- 45. In 1970, Krejcie and Morgan established a formula for determining a necessary sample size for generalizability based on population size. Based on their table, 375 useable responses were needed to ensure a representative sample of the overall population (N = 7,275). To make certain there were enough responses to satisfy this number of useable responses, the researcher chose to oversample the population. The researcher anticipated a very low response rate given the nature of this study. As such, the researcher chose to focus on sampling from a similar number of participants in each of the three groups. The researcher sent direct messages (see Appendix D) to all followers of @TruffleMedia (n = 2,800) and @FollowFarmer (n = 1,945). Because there were a great deal more followers of @AgChat, the researcher chose a smaller sample from this group (n = 2,530). Those sampled through @AgChat were randomly selected. Multiple Twitter users who follow more than one of these accounts were sent only one message, eliminating the potential problem of duplicate responses. To disseminate the survey, the researcher decided to use direct messages instead of tweets. Tweets are messages that are posted for a Twitter user’s followers to view whereas direct messages are private messages sent via Twitter to a follower of the account it is sent from (Twitter, 2011a). Given that tweets can be “retweeted”, or reposted to that user’s followers (Twitter, 2011a), direct messages were the best way to assure that unintended audiences (Twitter users who do not follow @AgChat, @FollowFarmer or @TruffleMedia accounts) did not receive and complete the survey. Institutional Review Board 35
- 46. Oklahoma State University requires Institutional Review Board (IRB) approval for all research that engages human subjects. Before any data can be collected from human subjects, the researcher must have IRB approval. The Oklahoma State University Office of University Research Services and the Institutional Review Board perform this assessment to protect the rights and welfare of human subjects involved in biomedical and behavioral research. To fulfill this requirement, the study was submitted for review and received approval for execution. The IRB assigned number for this study is AG-11- 1128 (see Appendix A). Research Design This study was intended to identify the users of “agvocacy” efforts through social media. To fulfill this purpose and understand the @AgChat, @FollowFarmer and @TruffleMedia followers, this study called for participants that are active in “agvocacy.” Since this study focused on participants using social media, it was assumed all participants had Internet access. As such, the survey instrument was Web-based. A Web- based survey instrument allows the researcher to gather data through an electronic set of questions on the Web (Dillman, 2000). Electronic surveys are one of the most important advances in survey technology in the twentieth century given that they are less expensive and quicker than mail surveys (Dillman, 2000). Data collection began on May 13, 2011, and concluded on June 9, 2011. Instrument Design 36
- 47. An online survey instrument developed with Qualtrics survey software was used to collect data for this study. Qualtrics is an online survey generator that was purchased by Oklahoma State University’s College of Agricultural Sciences and Natural Resources department of agricultural education, communications, and leadership for research use within the department. The online instrument consisted of 38 questions divided into five pages (see Appendix E). Twelve questions determined participants’ demographic information regarding age, gender, ethnicity, education, income, eating habits, occupation, and agricultural background and knowledge. Ten questions asked participants about their general usage of social media, and thirteen questions asked participants about their usage of social media for receiving or distributing agricultural information. Two questions asked participants about their perceptions of threats to agriculture and “agvocacy”. One question asked which account the respondent was referred by. Also included in the instrument was an introductory page introducing the survey and thanking the respondent for their input (see Appendix C). The survey instrument was developed using existing instruments (Cartmell, 2001; Holt, 2007; Robertson, 2003), and questions were altered to solicit input from Twitter users who follow @AgChat, @FollowFarmer and @TruffleMedia. Validity and Reliability The instrument followed Creswell’s (2005) suggestions for designing survey instruments; researchers should 1) compose various types of questions, 2) use tactics for good question composition, and 3) execute a pilot test of the questions. 37
- 48. A panel of experts reviewed the instrument during the stages of development to make certain the content was appropriate for the objectives and that this study followed Creswell’s (2005) first two suggestions. The panel of experts were used to determine validity. According to Joppe (2000a), Validity determines whether the research truly measures that which it was intended to measure or how truthful the research results are. In other words, does the research instrument allow you to hit "the bull’s eye" of your research object? (p. 1) Two types of validity were explored in the survey instrument were content validity and face validity. According to Hayes, Richard, and Kubany (1995), “Content validity is the degree to which elements of an assessment instrument are relevant to and representative of the targeted construct for a particular assessment purpose” (p. 2). Face validity is concerned with the design of the instrument (Writing@CSU, 2011). The panel of experts who determined validity consisted of farmers, ranchers, agricultural communications professionals and faculty members of Oklahoma State University’s department of agricultural education, communications, and leadership (see Appendix B). Those who served on the panel of experts were selected because of their extensive knowledge of agriculture and/or communications. The panel of experts critiqued the instrument and provided feedback to improve the clarity of the instrument. Joppe (2000) defined reliability as The extent to which results are consistent over time and an accurate representation of the total population under study is referred to as reliability. In other words, if 38
- 49. the results of a study can be reproduced under a similar methodology, then the research instrument is considered to be reliable. (p. 1) The instrument was determined to be reliable by comparing means on selected items of the instrument for the first twenty respondents. Responses were found to be consistent. This method of determining reliability is a suitable method for handling non- response error (Briers, Linder, & Murphy, 2001). There were not enough items within the instrument to use Cronbach’s alpha. Data Collection This survey was administered to followers of Twitter accounts @AgChat, @FollowFarmer and @TruffleMedia. Administrators of the three accounts sent a direct message to their followers with a link requesting they complete the survey. The @AgChat account disseminated 2,530 direct messages; the @FollowFarmer account disseminated 1,945 direct messages; and the @TruffleMedia account disseminated 2,800 direct messages. Because the number of @AgChat followers was so large (approximately 12,200 followers), not all @AgChat followers received a direct message. The @AgChat followers who received a direct message were randomly sampled. The sample size was of comparable proportion across the three Twitter accounts. Multiple Twitter users who follow more than one of these accounts were sent only one message, eliminating the potential problem of duplicate responses. The survey took approximately 20 minutes to complete. All survey questions were optional, and participants were able to exit the survey at any time without penalty. 39
- 50. Data Analysis After participants completed the survey, the data was archived in a Qualtrics database and then transferred to a Statistical Package for Social Science file for further analysis. Quantitative data sets were analyzed using Statistical Package for Social Science 16.0 for Windows. Descriptive statistics, including frequency and percentages, were employed to analyze the data once the data collection period was complete. The first research objective was satisfied by identifying demographics of @AgChat, @FollowFarmer and @TruffleMedia followers. The second research objective was satisfied by determining where @AgChat, @FollowFarmer and @TruffleMedia receive agricultural news from and what other social media tools they use to keep up with agricultural news. The third research objective was satisfied by asking participants to rate their top/favorite Twitter users to follow for agricultural news. 40
- 51. CHAPTER IV FINDINGS Introduction The purpose of this chapter is to exhibit the findings of this study based on examination of the data collected. Purpose and Objectives The purpose of this study was to identify @AgChat, @FollowFarmer and @TruffleMedia followers. The following objectives were developed to satisfy the purpose of this study: 1. Identify @AgChat, @FollowFarmer and @TruffleMedia followers’ background and professional experience related to agriculture. 2. Identify @AgChat, @FollowFarmer and @TruffleMedia followers’ perceptions of agricultural threats. 3. Determine where @AgChat, @FollowFarmer and @TruffleMedia followers receive agricultural news from and what other social media tools they use to keep up with agricultural news. 41
- 52. 4. Determine the top five agriculturally-focused Twitter users that are followed by @AgChat, @FollowFarmer and @TruffleMedia followers. Scope of Study This study included registered Twitter users who follow @AgChat, @FollowFarmer and @TruffleMedia accounts. This population was selected because these three Twitter accounts focused on agriculture are among the most followed on Twitter. The sample size was of comparable proportion across the three Twitter accounts. The sample was sent a direct message with a survey link (N = 7,275) and asked to complete the survey. Respondents Data collection began on May 13, 2011, and concluded on June 9, 2011. The last direct message was distributed on June 1, 2011. Because Twitter imposes a 250 direct message daily limit on users, all direct messages could not be disseminated at once. In total, 7,275 Twitter users were sent a direct message containing the survey link requesting their participation. Of the sample contacted, 508 responded to the survey. However, 102 respondents began the survey without completing it rendering those unusable. Therefore, the useable sample for analyzing data was n = 406. Findings 42
- 53. Findings related to Objective One: Identify @AgChat, @FollowFarmer and @TruffleMedia followers’ background and professional experience related to agriculture. Twitter users who participated in the survey were asked a range of questions related to demographics. Questions consisted of age, location, gender, education, ethnicity, income, type of residence, eating habits, agricultural experiences and knowledge, and occupation. Respondents were asked to provide the year they were born. Of the respondents, 0.5% (n = 2) were born between 1930 and 1939; 3.0% (n = 12) were born between 1940 and 1949; 15.3% (n = 62) were born between 1950 and 1959; 20.2% (n = 82) were born between 1960 and 1969; 22.4% (n = 91) were born between 1970 and 1979; 27.1% (n = 110) were born between 1980 and 1989; and 3.0% (n = 12) were born between 1990 and 1992. Thirty-five (8.6%) respondents did not answer the question (n = 35) (see Table 1). Respondents were asked to name the state in which they live. California residents consisted of 6.6% of the population (n = 27); Ohio residents consisted of 5.2% of the population (n = 21); Minnesota residents consisted of 4.9% of the population (n = 20); Wisconsin residents consisted of 4.7% of the population (n = 19); and Iowa residents consisted of 4.2% of the population (n = 17). Fifty respondents were from foreign countries (12.3%, n = 50) (see Table 2). 43
- 54. Table 1 Respondents’ Year of Birth Age of Respondents No. of Respondents Percentage (%) 1930-1939 2 0.5 1940-1949 12 3.0 1950-1959 62 15.3 1960-1969 82 20.2 1970-1979 91 22.4 1980-1989 110 27.1 1990-1992 12 3.0 Unanswered 35 8.6 Table 2 Respondents’ State of Residence State of Residence No. of Respondents Percentage (%) California 27 6.7 Ohio 21 5.2 Minnesota 20 4.9 Wisconsin 19 4.7 Iowa 17 4.2 International 50 12.3 44
- 55. More females than males responded to the survey. Of the respondents, 54.4% (n = 221) were female, and 44.1% (n = 179) were male. Six respondents (1.5%) did not answer the question (n = 6) (see Table 3). Table 3 Respondents’ Gender Gender No. of Respondents Percentage (%) Male 179 44.1 Female 221 54.4 Unanswered 6 1.5 The majority of respondents identified themselves as Caucasian. Of the respondents, 92.4% (n = 375) identified themselves as Caucasian; 2.5% (n = 10) identified themselves as Hispanic; 1.2% (n = 5) identified themselves as Asian or Pacific Islander; 1.0% (n = 4) identified themselves as African-American; and 1.0% (n = 4) identified themselves as American Indian or Alaskan Native. Eight respondents (2.0%) did not answer the question (n = 8) (see Table 4). 45
- 56. Table 4 Respondents’ Ethnicities Ethnicity No. of Respondents Percentage (%) Caucasian 375 92.4 Hispanic 10 2.5 Asian or Pacific Islander 5 1.2 African-American 4 1.0 American Indian or Alaskan Native 4 1.0 Unanswered 8 2.0 Respondents were asked to indicate the highest level of education completed. Of the respondents, 43.3% (n = 176) completed a bachelor’s degree; 18.7% (n = 76) completed a master’s degree; 10.6% (n = 43) completed some graduate work but no degree; 8.9% (n =36) completed a doctorate, law, or medical degree; 6.7% (n = 27) completed high school or equivalent; 5.7% (n = 23) completed an associates degree; 5.2% (n = 21) completed vocational or technical school; and 0.2% (n = 1) did not complete high school. Three respondents (0.7%) did not answer the question (n = 3) (see Table 5). 46
- 57. Table 5 Respondents’ Levels of Completed Education State of Residence No. of Respondents Percentage (%) Did not complete high school 1 0.2 High school or equivalent 27 6.7 Vocational or technical school 21 5.2 Associates degree 23 5.7 Bachelor’s degree 176 43.3 Some graduate work 43 10.6 Master’s degree 76 18.7 Doctorate, law or medical degree 36 8.9 Unanswered 3 0.7 Respondents were asked their total household income. Of the respondents, 16.7% (n = 68) identified earning between $100,000 and $149,999 yearly; 9.9% (n = 40) identified earning more than $150,000 yearly; 8.9% (n = 36) identified earning between $50,000 and $59,999 yearly; 8.6% (n = 35) identified earning between $40,000 and $49,999 yearly; 8.1% (n = 33) identified earning between $90,000 and $99,999 yearly; 7.6% (n = 31) identified earning between $30,000 and $39,999 yearly; 5.2% (n = 21) identified earning between $70,000 and $79,999 yearly; 4.7% (n = 19) identified earning between $80,000 and $89,999 yearly; 4.2% (n = 17) identified earning between $60,000 and $69,999 yearly; 2.5% (n = 10) identified earning between $20,000 and $29,999 47
- 58. yearly; 2.5% (n = 10) identified earning less than $10,000 yearly; 2.0% (n = 8) identified earning between $10,000 and $19,999 yearly; and 17.2% (n = 70) selected “I prefer not to answer”. Eight respondents (2.0%) did not answer the question (n = 8) (see Table 6). Table 6 Respondents’ Total Household Income Total Household Income No. of Respondents Percentage (%) Less than $10,000 10 2.5 $10,000 - $19,999 8 2.0 $20,000 - $29,999 10 2.5 $30,000 - $39,999 31 7.6 $40,000 - $49,999 35 8.6 $50,000 - $59,999 36 8.9 $60,000 - $69,999 17 4.2 $70,000 - $79,999 21 5.2 $80,000 - $89,999 19 4.7 $90,000 - $99,999 33 8.1 $100,000 - $149,999 68 16.7 More than $150,000 40 9.9 I prefer not to answer. 70 17.2 Unanswered 8 2.0 48
- 59. Respondents were asked the type of residence in which they live to help identify their background and proximity to agriculture. Of the respondents, 29.8% (n = 121) identified living in town with no garden or livestock; 29.8% (n = 121) identified living at a rural residence on a working farm; 21.7% (n = 88) identified living in town with a garden and/or livestock; 14.0% (n = 57) identified living at a rural residence with a garden and/or livestock but not farming; and 4.4% (n = 18) identified living at a rural residence with no crops or livestock. One respondent (0.2%) did not answer the question (n = 1) (see Table 7). Table 7 Respondents’ Type of Residence Type of Residence No. of Respondents Percentage (%) In town residence – 121 29.8 no garden or livestock In town residence – 88 21.7 with garden or livestock Rural residence – 18 4.4 with no crops or livestock Rural residence – 57 14.0 with a garden and/or livestock but not farming Rural residence – 121 29.8 on a working farm Unanswered 1 0.2 49
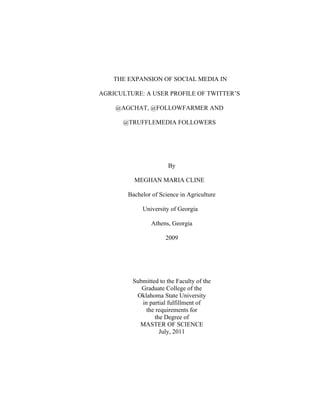
- 60. Respondents were asked about their eating habits. Nearly all respondents were omnivores. Of the respondents, 96.3% (n = 391) identified themselves as omnivores (eat meat, dairy, and plant products); 1.7% (n = 7) identified themselves as pescetarians (vegetarian, except eat fish); 1.5% (n = 6) identified themselves as lacto ovos (eat dairy and eggs, but no meat products); 0.5% (n = 2) identified themselves as vegetarians (eat no meat products); and 0% (n = 0) identified themselves as vegans (eat no meat or animal products) (see Figure 5). Figure 5. Respondents’ Eating Habits To better understand respondents’ agricultural background, respondents were given a list of agricultural activities and were asked to select all choices that apply. Of the 50
- 61. respondents, 65.3% (n = 265) indicated they work or have worked on a farm; 59.1% (n = 240) indicated they live or have lived on a farm; 56.2% (n = 228) indicated they work or have worked for an agricultural business; 47.5% (n = 193) indicated they have participated in 4-H; 46.1% (n = 187) indicated they were enrolled in a college agriculture course; 36.5% (n = 148) indicated they own or have owned a farm; 30.8% (n = 125) indicated they were enrolled in a high school agriculture course; 29.6% (n = 120) indicated they participated in FFA; 25.6% (n = 104) indicated they own or have owned an agricultural business; 18.5% (n = 75) indicated they work or have worked in Extension; and 7.6% (n = 31) indicated that none of the choices were applicable. Fifty-five respondents (13.5%) provided a variety of “other” agricultural activities that can be categorized into the following: respondents who work for an agricultural organization, 3.4% (n = 14); agricultural communicators, 2.7% (n = 11); respondents who appreciate agriculture but never participated in agricultural activities, 2.2% (n = 9); agricultural students, graduates, or researchers, 2.0% (n = 8); gardeners, 1.0% (n = 4); agricultural educators, 1.0% (n = 4); and respondents involved in agricultural organizations, 1.0% (n = 4). (see Table 8). To gain a sense of respondents’ agricultural literacy, respondents were asked to rate their level of knowledge about the agriculture industry. The majority of respondents indicated they had a somewhat high to high knowledge level of the agriculture industry. The mean for this question was 3.94 with a standard deviation of 0.972. Of the respondents, 8.2% (n = 155) indicated they have a somewhat high knowledge level of agriculture; 32.5% (n = 132) indicated they have a high knowledge level of agriculture; 21.7% (n = 88) indicated they have an average knowledge level of agriculture; 5.7% (n = 51
- 62. 23) indicated they have a somewhat low knowledge level of agriculture; and 2.0% (n = 8) indicated they have a low knowledge level of agriculture (see Table 9). Table 8 Respondents’ Agricultural Background and Activity Agricultural Background No. of Respondents Percentage (%) Work(ed) on a farm 265 65.3 Live(d) on a farm 240 59.1 Work(ed) for an agricultural business 228 56.2 Participated in 4-H 193 47.5 Enrolled in a college agriculture course 187 46.1 Own(ed) a farm 148 36.5 Enrolled in high school agriculture course 125 30.8 Participated in FFA 120 29.6 Own(ed) an agricultural business 104 25.6 Work(ed) in Extension 75 18.5 Other 55 13.5 52
- 63. Table 9 Respondents’ Agricultural Literacy Agricultural Knowledge Level No. of Respondents Percentage (%) Low knowledge level 8 2.0 Somewhat low knowledge level 23 5.7 Average knowledge level 88 21.7 Somewhat high knowledge level 155 38.2 High knowledge level 132 32.5 Respondents were asked to provide their occupation. Occupations were categorized into ten categories. One hundred twenty-three respondents indicated they work in communications/marketing (30.3%, n = 123). Eighty-nine respondents indicated they work as a farmer/rancher (21.9%, n = 89). Thirty-seven respondents indicated they work in academia/education/research (9.1%, n = 37). Twenty-five respondents identified themselves as students (6.2%, n = 25). Fifteen respondents identified themselves as consultants (3.7%, n = 15). Twelve respondents indicated they work in sales (3.0%, n = 12). Ten respondents indicated they work in an administrative/corporate position (2.5%, n = 10). Nine respondents indicated they work in political positions (2.2%, n = 9). Five respondents identified themselves as retired/unemployed (1.2%, n = 5). Four respondents indicated they work in public affairs (1.0%, n = 4) (see Table 10). 53
- 64. Table 10 Respondents’ Occupations Occupations No. of Respondents Percentage (%) Order Communications/marketing 123 30.3 1 Farmer/rancher 89 21.9 2 Academia/education/research 37 9.1 3 Student 25 6.2 4 Consultant 15 3.7 5 Sales position 12 3.0 6 Administrative/corporate 10 2.5 7 Political position 9 2.2 8 Retired/unemployed 5 1.2 9 Public affairs 4 1.0 10 Respondents were asked if they work for an agricultural business and were asked to select all choices that apply. Of the respondents, 18.2% (n = 74) indicated they work(ed) for an agricultural communication firm; 12.6% (n = 51) indicated they work(ed) on a dairy; 27.8% (n = 113) indicated they work(ed) on a livestock operation; 7.6% (n = 31) indicated they work(ed) on an organic farm; 31.3% (n = 127) indicated they work(ed) for an agribusiness; 6.9% (n = 28) indicated they work(ed) on a corporate farm; 30.0% (n = 122) indicated they work(ed) on a farm with crops; 24.4% (n = 99) indicated they work(ed) on some “other” type of agricultural operation; and 19.5% (n = 79) indicated 54
- 65. they do not work for an agricultural business. Respondents provided a variety of “other” agricultural businesses that can be categorized into the following: general agriculture, 8.1% (n = 33); academia/research, 4.9% (n = 20); government, 3.2% (n = 13); crops, 2.5% (n = 10); agricultural communications, 2.0% (n = 8); agricultural associations, 1.7% (n = 7); livestock/equine, 1.2% (n = 5); and co-ops/family farms, 0.7% (n = 3). This survey questions allowed respondents to select all that apply (see Table 11). Table 11 Respondents’ Agricultural Occupations Agricultural Occupations No. of Respondents Percentage (%) Agricultural communication firm 74 18.2 Dairy 51 12.6 Livestock operation 113 27.8 Organic farm 31 7.6 Agribusiness 127 31.3 Corporate farm 28 6.9 Farm with crops 122 30.0 Other 99 24.4 Does not work for an agricultural business 79 19.5 Findings related to Objective Two: Identify @AgChat, @FollowFarmer and @TruffleMedia followers’ perceptions of agricultural threats. 55