EVA and WACC Analysis of Six Product Lines
•
1 gostou•969 visualizações

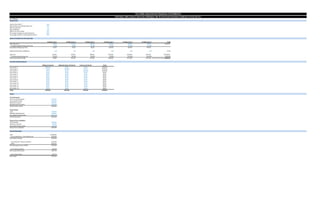
This document contains financial information for a company including income statements, balance sheets, sales and cost data by product line. It then provides a tree analysis summarizing the company's cost of capital calculation and drivers of economic value added (EVA), showing the return on net assets (RONA) of 20.25% exceeds the weighted average cost of capital (WACC) of 9.72%, resulting in positive EVA of $84.24.

Recomendados
Mais conteúdo relacionado
Semelhante a EVA and WACC Analysis of Six Product Lines
Semelhante a EVA and WACC Analysis of Six Product Lines (20)
Mais de Deb Sahoo, MBA(Finance), MS(EE), BTech(EE),
Mais de Deb Sahoo, MBA(Finance), MS(EE), BTech(EE), (20)
Último
Último (20)
EVA and WACC Analysis of Six Product Lines
- 1. ($ in Millions) Market Data Income Taxe Rate, T 40% Rate of Return of a Market Index, Rm 12% Risk-Free Rate, Rf 7% Beta Coefficient 1.10 Before-Tax Cost of Debt 8% Percentage of Equity in Capital Structure 60% Percentage of Debt in Total Capital Structure 40% Sales & Variable Cost of Goods Sold Product Line 1 Product Line 2 Product Line 3 Product Line 4 Product Line 5 Product Line 6 Total Unit sales price $9.00 $15.00 $20.00 $30.00 $49.00 $59.00 $182.00 Variable manufactoring cost per unit $5.00 $8.00 $14.00 $10.00 $20.00 $20.00 Contribution Margin per Unit $4.00 $7.00 $6.00 $20.00 $29.00 $39.00 Expected Unit Sales in (Millions) 2.00 3.00 4.00 5.00 6.00 7.00 27.00 Sales in $ $18.00 $45.00 $80.00 $150.00 $294.00 $413.00 $1,000.00 Variable manufactoring cost $10.00 $24.00 $56.00 $50.00 $120.00 $140.00 $400.00 Total Contribution Margin $8.00 $21.00 $24.00 $100.00 $174.00 $273.00 $600.00 Fixed Overhead Expenses Selling Overhead Administration Overhead Factory Overhead Total Cost Center 1 $200.00 $0.00 $0.00 $200.00 Cost Center 2 $0.00 $100.00 $0.00 $100.00 Cost Center 3 $0.00 $0.00 $100.00 $100.00 Cost Center 4 $0.00 $0.00 $0.00 $0.00 Cost Center 5 $0.00 $0.00 $0.00 $0.00 Cost Center 6 $0.00 $0.00 $0.00 $0.00 Cost Center 7 $0.00 $0.00 $0.00 $0.00 Cost Center 8 $0.00 $0.00 $0.00 $0.00 Cost Center 9 $0.00 $0.00 $0.00 $0.00 Cost Center 10 $0.00 $0.00 $0.00 $0.00 Cost Center 11 $0.00 $0.00 $0.00 $0.00 Cost Center 12 $0.00 $0.00 $0.00 $0.00 Cost Center 13 $0.00 $0.00 $0.00 $0.00 Total $200.00 $100.00 $100.00 $400.00 Assets Current Assets: Cash & Cash Equivalent $100.00 Accounts Receivable $100.00 Material Inventory $100.00 Finished Good Inventory $100.00 Total Current Assets $400.00 Fixed Assets: Land $100.00 Building and Equipment $700.00 Accumulted Deprreciation ($200.00) Total Fixed Assets $600.00 Interest Free Liabilities: Trade liability $100.00 Advances received $50.00 Accrual for Income Taxes $50.00 Interest Free Liabilities $200.00 Income Statement Sales $1,000.00 Less Variable Cost : Cost of goods sold $350.00 Contribution Margin $650.00 Less Fixed Cost: Factory overhead $120.00 SG&A $260.00 Net operating income (=EBIT) $270.00 Less: Interest expense $25.60 Net income before taxes $244.40 Less: Income taxes $97.76 Net income $146.64 EVA TREE ANALYSIS OF FINANCIAL STATEMENTS | Deb Sahoo | MBA, Finance, University of Michigan | MS, EE, University of Southern California | B-Tech, EE, IIT |
- 2. COST OF CAPITAL TREE Rate of Return of a Market Index 12.00% Market Risk Premium 5.00% Company Risk Premium Risk-Free Rate 5.50% 7.00% Cost of equity Beta Coefficient 13.00% 1.10 Weighted Cost of Equity Risk-Free Rate 7.80% 7.00% Percentage of Equity in Capital Structure 60.00% WACC Before-Tax Cost of Debt 9.72% 8.00% After-Tax Cost of Debt Before-Tax Operating Profit in % 4.80% 100.00% Weighted Cost of Debt After-Tax Operating Profit in % 1.92% 60.00% % of Total Capital Supplied by Debt Income Taxe Rate 40.00% 40.00% - + x x x + x x EVA VALUE DRIVER TREE Sales $1,000.00 Contribution $650.00 EBIT Variable Cost of Goods Sold $270.00 $350.00 NOPAT Overhead (Fixed Cost) $162.00 $380.00 Profit Margin (1-Rate of Income Tax) 16.2% 0.6 RONA Sales 20.3% $1,000.00 Fixed Assets Operating Profit Total Net Asset Turnover Assets $600.00 $162.00 1.25 $1,000.00 EVA Net Assets Net Assets $84.24 $800.00 $800.00 Current Assets Cost of Capital Interest Free Liabilities $400.00 $77.76 $200.00 WACC 9.7% - - + x - : : x x x - Before interest
- 3. RONA 20.25 % Operating Profit - Cost of Capital = EVA = $84.24 WACC 9.72 % Operating Profit = $162 Cost of Capital= $77.76 0.00% 5.00% 10.00% 15.00% 20.00% 25.00% $0.00 $100.00 $200.00 $300.00 $400.00 $500.00 $600.00 $700.00 $800.00 $900.00 WACC/RONA Net Assets EVA-Chart Operating Profit Cost of Capital