Country Profile Infographic - Turkey - The Learning Curve (Pearson)
•
1 like•2,250 views

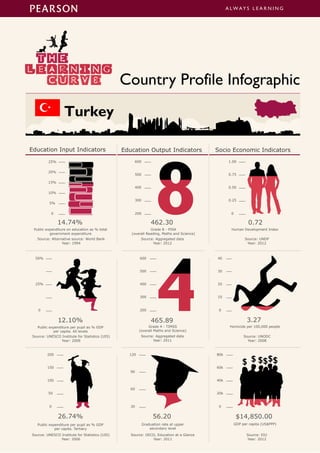
Country Profile Infographic - Turkey - The Learning Curve (Pearson, The Economist Intelligence Unit) Education Input Indicators Education Output Indicators Socio Economic Indicators #learningcurve

Recommended
Recommended
More Related Content
What's hot
What's hot (18)
Similar to Country Profile Infographic - Turkey - The Learning Curve (Pearson)
Similar to Country Profile Infographic - Turkey - The Learning Curve (Pearson) (20)
More from Melih ÖZCANLI
More from Melih ÖZCANLI (20)
Recently uploaded
Recently uploaded (20)
Country Profile Infographic - Turkey - The Learning Curve (Pearson)
- 1. Education Input Indicators Education Output Indicators Socio Economic Indicators Country Profile Infographic 50% 0 25% Public expenditure per pupil as % GDP per capita. All levels Grade 4 - TIMSS (overall Maths and Science) Homicide per 100,000 people 3.27 40 30 0 10 20 $14,850.00 Source: EIU Year: 2012 Source: OECD, Education at a Glance Year: 2011 56.2026.74% Source: UNESCO Institute for Statistics (UIS) Year: 2006 12.10% 465.89 600 500 200 300 400 Source: Alternative source: World Bank Year: 1994 Source: Aggregated data Year: 2012 Source: UNDP Year: 2012 0.72 Human Development IndexGrade 8 - PISA (overall Reading, Maths and Science) 462.30 600 500 200 300 400 0.75 0 0.25 0.50 1.00 0 5% 10% 15% 20% 14.74% Public expenditure on education as % total government expenditure 25% 80k 60k 0 20k 40k 120 30 90 60 Public expenditure per pupil as % GDP per capita. Tertiary Graduation rate at upper secondary level GDP per capita (US$PPP) 200 150 0 50 100 Source: UNESCO Institute for Statistics (UIS) Year: 2006 Source: Aggregated data Year: 2011 Source: UNODC Year: 2008
- 2. 100k 75k 0 25k 50k Overall productivity of labour (GDP at US$PPP per worker) 25% 20% 0 5% 10% 15% Recorded unemployment (%) Labour force. Tertiary attainment (%)Unemployment of those with tertiary level education over total unemployment Teacher salary at primary, lower and upper secondary levels over the avg. gross wage Pupil-teacher ratio. Primary 20 15 0 5 10 3.0 2.0 0 1.0 50 30 40 0 10 20 Education Input Indicators Education Output Indicators Socio Economic Indicators 100% 75% 0 25% 50% 50 60 70 40 10 20 30 Real GDP growth per head (% per annum) School life expectancy (Primary to tertiary) 2016128 20% 10% -20% -10% 0 14.41 years Source: UNESCO Institute for Statistics (UIS) Year: 2011 Source: OECD, Education at a Glance Year: 2011 Source: EIU Year: 2012 22.60 1.20% 21.00 Source: Alternative source: Eurostat Year: 2011 Source: EIU Year: 2012 Source: EIU Year: 2012 $39,140.00 9.20% 3.30 Source: Aggregated data Year: 1999 Source: EIU based on ILO and EIU data Year: 2012 Source: ILO Year: 2012 0.97 18.30% Graduation rate at tertiary level