Michael Durante Western Reserve Blackwall Partners Canadian Banks
•
1 gostou•387 visualizações

Michael Durante Western Reserve Blackwall Partners Canadian Banks

Recomendados
Mais conteúdo relacionado
Mais procurados
Mais procurados (8)
Destaque
Destaque (20)
Semelhante a Michael Durante Western Reserve Blackwall Partners Canadian Banks
Semelhante a Michael Durante Western Reserve Blackwall Partners Canadian Banks (20)
Mais de Michael Durante
Mais de Michael Durante (20)
Último
Último (20)
Michael Durante Western Reserve Blackwall Partners Canadian Banks
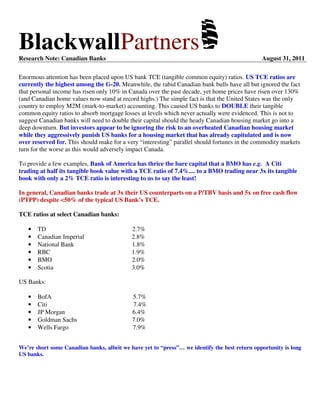
- 1. BlackwallPartnersResearch Note: Canadian Banks August 31, 2011 Enormous attention has been placed upon US bank TCE (tangible common equity) ratios. US TCE ratios are currently the highest among the G-20. Meanwhile, the rabid Canadian bank bulls have all but ignored the fact that personal income has risen only 10% in Canada over the past decade, yet home prices have risen over 130% (and Canadian home values now stand at record highs.) The simple fact is that the United States was the only country to employ M2M (mark-to-market) accounting. This caused US banks to DOUBLE their tangible common equity ratios to absorb mortgage losses at levels which never actually were evidenced. This is not to suggest Canadian banks will need to double their capital should the heady Canadian housing market go into a deep downturn. But investors appear to be ignoring the risk to an overheated Canadian housing market while they aggressively punish US banks for a housing market that has already capitulated and is now over reserved for. This should make for a very “interesting” parallel should fortunes in the commodity markets turn for the worse as this would adversely impact Canada. To provide a few examples, Bank of America has thrice the bare capital that a BMO has e.g. A Citi trading at half its tangible book value with a TCE ratio of 7.4%.... to a BMO trading near 3x its tangible book with only a 2% TCE ratio is interesting to us to say the least! In general, Canadian banks trade at 3x their US counterparts on a P/TBV basis and 5x on free cash flow (PTPP) despite <50% of the typical US Bank’s TCE. TCE ratios at select Canadian banks: • TD 2.7% • Canadian Imperial 2.8% • National Bank 1.8% • RBC 1.9% • BMO 2.0% • Scotia 3.0% US Banks: • BofA 5.7% • Citi 7.4% • JP Morgan 6.4% • Goldman Sachs 7.0% • Wells Fargo 7.9% We’re short some Canadian banks, albeit we have yet to “press”… we identify the best return opportunity is long US banks.
- 2. 2 Some recent headlines and stats to chew on for now… Toronto Wary of Condo Correction Aug 23, 2010 MONICA GUTSCHI online.wsj.com Bank of Canada Governor Mark Carney has warned that the "ample pipeline of developments…and heavy investor demand reinforces the possibility of an overshoot in the condo market" in Toronto and other cities like Vancouver. Above, condo construction projects stands in this photo taken with a tilt-shift lens in Toronto in July. TORONTO—A condominium-building boom is lifting Canada's largest city into the same stratosphere as London, Sydney, Vancouver and Miami, but deepening the worries about a potential tumble. Vancouver housing affordability ‘rapidly eroding’: RBC Aug 22, 2011 Steve ladurantaye theglobeandmail.com Most Canadian cities offer “reasonably affordable” housing, according to Royal Bank of Canada's quarterly survey into affordability, but Vancouver is at risk of a downturn. For the second quarter in a row affordability slipped across the country as prices rose and mortgage rates moved marginally higher. Bank of Canada Review released: Flaherty now under pressure to adjust down payment rules Aug 19, 2011 Ben Rabidoux theeconomicanalyst.com
- 3. 3 2009Q4 2010Q4 2011Q1 2011Q2 2009Q4 2010Q4 2011Q1 2011Q2 Large-Cap Banks Bank of America Corporation BAC 7.81 8.6 8.64 8.23 4.66 6 6.1 5.87 Bank of New York Mellon Corporation BK 10.53 11.75 12.36 12.56 3.75 3.86 3.91 3.61 BB&T Corporation BBT 8.5 9.07 9.32 9.58 5.97 6.59 6.72 6.88 Capital One Financial Corporation COF 10.62 8.78 8.4 9.35 7.79 6.69 7.16 7.78 Citigroup Inc. C 9.6 10.75 11.34 11.62 6.66 7.02 7.29 7.52 Comerica Incorporated CMA 8.18 10.13 10.35 10.53 8 10.54 10.44 10.91 Fifth Third Bancorp FITB 6.99 7.48 8.99 9.2 6.64 7.3 8.6 8.96 Huntington Bancshares Incorporated HBAN 6.76 9.29 9.75 9.92 5.74 7.42 7.68 8.1 JPMorgan Chase & Co. JPM 8.79 9.77 10.03 10.11 5.33 5.63 5.63 5.62 KeyCorp KEY 7.5 9.34 10.74 11.14 7.56 8.19 9.16 9.67 M&T Bank Corporation MTB 5.66 6.51 6.78 6.66 5.09 6.16 6.42 6.2 Northern Trust Corporation NTRS 12.81 13.03 12.99 12.3 7.16 7.65 7.02 6.71 PNC Financial Services Group, Inc. PNC 6 9.8 10.31 10.5 4.84 8.05 8.58 8.89 Regions Financial Corporation RF 7.15 7.85 7.92 7.95 6.03 5.86 5.81 6.01 State Street Corporation STT 15.59 18.07 17.46 16.88 5.36 6.3 6.31 6.02 SunTrust Banks, Inc. STI 7.67 8.08 9.05 9.22 6.57 6.97 7.59 7.78 U.S. Bancorp USB 6.8 7.82 8.18 8.4 5.1 5.8 6.07 6.32 Wells Fargo & Company WFC 6.46 8.3 8.93 9.15 5.49 6.79 7.28 7.46 Mid-Cap Banks Associated Banc-Corp ASBC 7.85 12.26 12.65 12.61 5.79 8.12 8.42 8.49 Bank of Hawaii Corporation BOH NA 18.28 18.41 NA 6.98 7.48 7.46 7.4 BankUnited, Inc. BKU 40.42 41.3 44.04 NA 9.33 10.97 12.74 13.06 BOK Financial Corporation BOKF 10.75 12.55 12.84 13.15 7.99 9.21 9.54 9.71 Cathay General Bancorp CATY 9 10.7 10.66 11.06 6.41 8.09 8.4 8.76 City National Corporation CYN 8.91 10.29 10.69 10.45 6.15 6.87 6.91 6.97 Commerce Bancshares, Inc. CBSH 13.01 14.38 14.75 15.1 9.71 10.27 10.24 10.27 Cullen/Frost Bankers, Inc. CFR 10.73 12.71 13.11 13.27 8.56 8.9 8.94 9.12 East West Bancorp, Inc. EWBC 10.25 13.69 13.9 13.47 5.78 7.96 8.01 8.09 F.N.B. Corporation FNB 8.47 8.43 8.03 8.85 5.84 6.01 5.77 6.51 First Citizens BancShares, Inc. FCNCA NA 12.83 13.32 13.35 7.9 7.83 7.97 8.13 First Horizon National Corporation FHN 9.88 11.53 11.73 11.86 7.75 8.93 8.91 8.93 First Republic Bank FRC NA 13.77 14.16 13.9 6.5 8.81 8.79 9.11 FirstMerit Corporation FMER 11.82 NA 11.68 NA 8.89 7.59 7.5 7.79 Fulton Financial Corporation FULT 7.63 10.16 10.6 NA 6.3 8.47 8.84 9.13 Hancock Holding Company HBHC 11.99 15.34 17.04 NA 8.81 9.69 11.94 8.11 IBERIABANK Corporation IBKC NA 16.72 16.63 NA 7.43 10.65 10.85 10.15 Marshall & Ilsley Corporation 7.47 6.68 6.4 NA 8.12 7.86 7.84 NA Popular, Inc. BPOP 6.39 10.95 11.58 11.53 5.4 8.01 8.02 8.38 Prosperity Bancshares, Inc. PRSP 10.4 11.52 12.02 12.74 5.53 5.86 6.03 6.46 Signature Bank SBNY NA 14.21 13.87 14.2 8.79 8.09 8.02 8.08 SVB Financial Group SIVB 14.79 13.1 12.86 NA 8.78 7.27 7.05 7.42 Synovus Financial Corp. SNV 6.66 8.63 8.47 8.41 5.74 6.73 6.66 6.63 TCF Financial Corporation TCB 7.65 9.71 11.47 11.79 5.76 7.2 8.37 8.58 Trustmark Corporation TRMK 11.63 12.87 13.32 13.55 8.67 9.11 9.27 9.43 UMB Financial Corporation UMBF 13.11 11.3 11.57 NA 7.29 6.26 5.97 6.66 Valley National Bancorp VLY 8.99 9.25 9.32 9.4 6.75 6.97 6.96 6.94 Webster Financial Corporation WBS 7.83 9.92 10.53 10.79 5.64 6.82 7.1 7.28 Westamerica Bancorporation WABC 12.84 13.87 14.12 NA 7.22 8.15 8.28 8.39 Zions Bancorporation ZION 6.73 8.95 9.32 9.36 6.12 6.99 7.01 6.95 Tier 1 Common Capital Tangilbe Comm Equity / Tangible Assets
- 4. 4 2009Q4 2010Q4 2011Q1 2011Q2 2009Q4 2010Q4 2011Q1 2011Q2 Small-Cap Banks BancorpSouth, Inc. BXS 9.65 9.07 9.09 9.26 7.63 7 6.95 7.32 Bank of the Ozarks, Inc. OZRK 11.07 13.43 14.18 NA 9.53 9.57 9.84 9.28 Boston Private Financial Holdings, Inc. BPFH 7.78 7.84 6.79 NA 5.04 5.16 5.4 NA National Penn Bancshares, Inc. NPBC 8.26 11.12 13.22 14 6.64 8.27 9.91 10.25 F.N.B. Corporation FNB 8.47 8.43 8.03 8.85 5.84 6.01 5.77 6.51 First Commonwealth Financial Corporation FCF 8.5 10.95 11.29 NA 7.51 10.35 10.49 10.81 First Financial Bancorp. FFBC 13.57 17.9 19.9 NA 7.78 10.36 10.42 11.13 First Midwest Bancorp, Inc. FMBI 7.56 9.81 9.97 10.21 6.32 8.09 8.36 8.49 International Bancshares Corporation IBOC 11.9 13.47 13.97 NA 7.83 8.17 8.18 9.16 MB Financial, Inc. MBFI 8.76 10.9 11.01 11.47 6.04 7.33 7.59 7.63 Old National Bancorp ONB 12.16 13.4 12.49 NA 8.25 9.69 9.12 9.52 Pacific Capital Bancorp PCBC 3.19 14.82 15.71 NA 2.43 9.21 9.81 10.72 PacWest Bancorp PACW 11.36 9.44 10.1 NA 8.95 7.44 7.8 8.47 PrivateBancorp, Inc. PVTB 7.86 7.69 7.97 8.34 7.42 7.1 7.17 7.58 Sterling Bancshares, Inc. 9.41 13 12.88 NA 7.48 8.77 9.06 9.16 Susquehanna Bancshares, Inc. SUSQ 6.03 9.58 9.67 9.65 4.97 7.23 7.36 7.44 Texas Capital Bancshares, Inc. TCBI 8.68 8.71 9.28 NA 8.29 8.06 8.85 8.12 Umpqua Holdings Corporation UMPQ 9.78 13.23 13.16 NA 8.27 8.74 8.93 9.23 United Bankshares, Inc. UBSI 8.24 NA NA NA 5.94 6.99 7.06 7.19 Western Alliance Bancorporation WAL 8.18 8.49 8.52 8.4 7.09 7.02 6.78 6.89 Wintrust Financial Corporation WTFC 5.76 9.89 10.11 9.78 4.71 7.99 8.04 7.88 Large-Cap Thrifts Astoria Financial Corporation AF NA NA NA NA 5.1 5.9 6.16 6.46 First Niagara Financial Group, Inc. FNFG 17.26 12.76 12.56 11.41 10.54 8.27 8.2 7.44 Hudson City Bancorp, Inc. HCBK 20.39 21.71 18.54 NA 8.62 8.77 8.75 9.17 New York Community Bancorp, Inc. NYB 12.47 12.05 12.07 12.29 7.13 7.79 7.87 8.03 People's United Financial, Inc. PBCT NA 17 17.2 17 18.16 14.12 13.94 13.89 TFS Financial Corporation (MHC) TFSL 17.41 20.07 20.33 NA 16.25 15.72 16.03 16.16 Large-Cap Broker/Dealer Charles Schwab Corporation SCHW NA NA NA NA 6.04 6.03 6.21 6.3 E*TRADE Financial Corporation ETFC NA NA NA NA 3.2 4.05 4.76 5.76 Goldman Sachs Group, Inc. GS NA NA NA NA 6.84 7.04 6.91 6.88 Morgan Stanley MS NA NA NA NA 3.29 4.56 4.53 5.73 TD Ameritrade Holding Corporation AMTD NA NA NA NA 0.25 3.97 4.84 5.42 Tier 1 Common Capital Tangilbe Comm Equity / Tangible Assets Regards, Michael P. Durante Managing Partner Blackwall Partners LLC