
Recomendados
Mais conteúdo relacionado
Mais procurados
Mais procurados (17)
Destaque
Destaque (18)
Semelhante a Ch2.6 Graphing Inequalities
Semelhante a Ch2.6 Graphing Inequalities (20)
Mais de mdicken
Mais de mdicken (20)
Último
Último (20)
Ch2.6 Graphing Inequalities
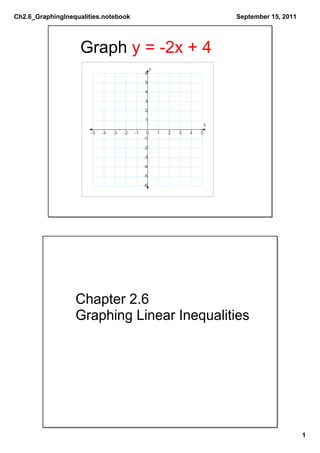
- 1. Ch2.6_GraphingInequalities.notebook September 15, 2011 Graph y = 2x + 4 y 6 5 4 3 2 1 x 5 4 3 2 1 0 1 2 3 4 5 1 2 3 4 5 6 Chapter 2.6 Graphing Linear Inequalities 1
- 2. Ch2.6_GraphingInequalities.notebook September 15, 2011 Graph y = 2x + 4 y 6 5 4 3 2 1 x 5 4 3 2 1 0 1 2 3 4 5 1 2 3 4 5 6 When graphing inequalities, we have to shade above or below the line 2
- 3. Ch2.6_GraphingInequalities.notebook September 15, 2011 Graph y ≤ 2x + 4 y 6 5 4 3 2 1 x 5 4 3 2 1 0 1 2 3 4 5 1 2 3 4 5 6 Graph y < 2x + 4 y 6 5 4 3 2 1 x 5 4 3 2 1 0 1 2 3 4 5 1 2 3 4 5 6 3
- 4. Ch2.6_GraphingInequalities.notebook September 15, 2011 General Rules y = ... Solid line, no shading y < ... Dotted line, shaded BELOW y ≤ ... Solid Line, shaded BELOW y > ... Dotted Line, shaded ABOVE y ≥ ... Solid line, shaded ABOVE Steps for Graphing • Begin by plotting points • Determine if a solid or dotted line is used • Graph the line • Shade above or below the line (depending on inequality) 4
- 5. Ch2.6_GraphingInequalities.notebook September 15, 2011 Graph y ≥ 3x y 6 5 Solid or Dotted line? 4 3 2 Shade above 1 x or below? 5 4 3 2 1 0 1 2 3 4 5 1 2 3 4 5 6 Graph y = x 2 y 6 5 Solid or Dotted line? 4 3 2 Shade above 1 x or below? 5 4 3 2 1 0 1 2 3 4 5 1 2 3 4 5 6 5
- 6. Ch2.6_GraphingInequalities.notebook September 15, 2011 Graph y < 4 2x y 6 5 Solid or Dotted line? 4 3 2 Shade above 1 x or below? 5 4 3 2 1 0 1 2 3 4 5 1 2 3 4 5 6 Graph y + 3 ≤ 2(x 2) y 6 5 Solid or Dotted line? 4 3 2 Shade above 1 x or below? 5 4 3 2 1 0 1 2 3 4 5 1 2 3 4 5 6 6
- 7. Ch2.6_GraphingInequalities.notebook September 15, 2011 Worksheet Side A only 7