
Recommended
More Related Content
Recently uploaded
Recently uploaded (20)
Featured
Featured (20)
Fourth Quarter 2010 US Industrial Statistics
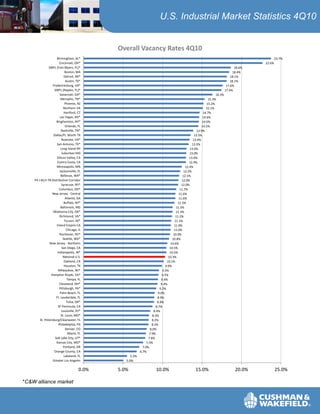
- 1. U.S. Industrial Market Statistics 4Q10 Overall Vacancy Rates 4Q10 Birmingham, AL* 23.7% Cincinnati, OH* 22.6% SWFL (Fort Myers, FL)* 18.6% Boston, MA 18.4% Detroit, MI* 18.1% Austin, TX* 18.1% Fredericksburg, VA* 17.6% SWFL (Naples, FL)* 17.4% Savannah, GA* 16.3% Memphis, TN* 15.3% Phoenix, AZ 15.2% Northern VA 15.1% Hartford, CT 14.7% Las Vegas, NV* 14.6% Binghamton, NY* 14.6% Orlando, FL 14.5% Nashville, TN* 13.9% Dallas/Ft. Worth TX 13.5% Roanoke, VA* 13.4% San Antonio, TX* 13.3% Long Island NY 13.0% Suburban MD 13.0% Silicon Valley, CA 13.0% Contra Costa, CA 12.9% Minneapolis, MN 12.4% Jacksonville, FL 12.2% Bellevue, WA* 12.1% PA I-81/I-78 Distribution Corridor 12.0% Syracuse, NY* 12.0% Columbus, OH* 11.7% New Jersey - Central 11.6% Atlanta, GA 11.6% Buffalo, NY* 11.5% Baltimore, MD 11.3% Oklahoma City, OK* 11.3% Richmond, VA* 11.2% Tucson, AZ* 11.1% Inland Empire CA 11.0% Chicago, IL 11.0% Rochester, NY* 10.9% Seattle, WA* 10.8% New Jersey - Northern 10.6% San Diego, CA 10.5% Indianapolis, IN* 10.5% National U.S. 10.3% Oakland, CA 10.1% Houston, TX 9.9% Milwaukee, WI* 9.5% Hampton Roads, VA* 9.5% Tampa, FL 9.4% Cleveland, OH* 9.4% Pittsburgh, PA* 9.2% Palm Beach, FL 9.0% Ft. Lauderdale, FL 8.9% Tulsa, OK* 8.9% SF Peninsula, CA 8.7% Louisville, KY* 8.4% St. Louis, MO* 8.3% St. Petersburg/Clearwater, FL 8.2% Philadelphia, PA 8.2% Denver, CO 8.0% Miami, FL 7.9% Salt Lake City, UT* 7.8% Kansas City, MO* 7.5% Portland, OR 7.0% Orange County, CA 6.7% Lakeland, FL 5.5% Greater Los Angeles 5.0% 0.0% 5.0% 10.0% 15.0% 20.0% 25.0% *C&W alliance market
- 2. U.S. Industrial Market Statistics 4Q10 Direct Net Asking Rental Rates 4Q10 Memphis, TN* $2.53 Cincinnati, OH* $2.84 Columbus, OH* $3.28 Indianapolis, IN* $3.43 Louisville, KY* $3.47 Syracuse, NY* $3.50 Cleveland, OH* $3.74 St. Louis, MO* $3.78 Atlanta, GA $3.81 Savannah, GA* $3.89 PA I-81/I-78 Distribution Corridor $3.92 Jacksonville, FL $4.00 Milwaukee, WI* $4.05 Dallas/Ft. Worth TX $4.07 Chicago, IL $4.09 Inland Empire CA $4.15 Lakeland, FL $4.16 Nashville, TN* $4.18 Birmingham, AL* $4.23 Oklahoma City, OK* $4.25 Richmond, VA* $4.26 Binghamton, NY* $4.26 Buffalo, NY* $4.32 Detroit, MI* $4.63 Tucson, AZ* $4.65 Tulsa, OK* $4.68 Houston, TX $4.69 Hartford, CT $4.83 Baltimore, MD $4.96 Roanoke, VA* $5.01 Philadelphia, PA $5.10 Seattle, WA* $5.18 Rochester, NY* $5.25 Minneapolis, MN $5.30 Oakland, CA $5.33 SWFL (Fort Myers, FL)* $5.34 Denver, CO $5.36 Miami, FL $5.37 New Jerey - Central $5.45 Hampton Roads, VA* $5.48 Tampa, FL $5.49 National U.S. $5.51 Salt Lake City, UT* $5.53 San Antonio, TX* $5.56 Portland, OR $5.57 Orlando, FL $5.60 St. Petersburg/Clearwater, FL $5.90 Boston, MA $6.08 Greater Los Angeles $6.10 New Jersey - Northern $6.19 Kansas City, MO* $6.37 Long Island NY $6.46 SWFL (Naples, FL)* $6.57 Austin, TX* $6.72 Las Vegas, NV* $6.84 Phoenix, AZ $6.84 Palm Beach, FL $6.89 Pittsburgh, PA* $7.01 Ft. Lauderdale, FL $7.10 Orange County, CA $7.37 Fredericksburg, VA* $7.89 Contra Costa, CA $9.00 Suburban MD $9.62 Northern VA $9.91 San Diego, CA $10.08 Bellevue, WA $10.32 Silicon Valley, CA $10.86 San Francisco Peninsula, CA $13.93 $0.00 $2.00 $4.00 $6.00 $8.00 $10.00 $12.00 $14.00 $16.00 (psf/yr) Asking rents include all industrial property types, weighted calculation for vacant spaces available on a direct basis
- 3. U.S. Industrial Market Statistics 4Q10 2010 Leasing Activity Binghamton, NY* 0.1 Roanoke, VA* 0.1 Buffalo, NY* 0.3 Fredericksburg, VA* 0.4 Lakeland, FL 0.6 Hartford, CT 0.7 Contra Costa, CA 0.7 St. Petersburg/Clearwater, FL 0.7 Savannah, GA* 0.8 Syracuse, NY* 0.9 Palm Beach, FL 1.0 Suburban MD 1.0 Tucson, AZ* 1.0 Northern VA 1.5 San Antonio, TX* 1.7 Bellevue, WA* 1.9 Tampa, FL 2.2 Hampton Roads, VA* 2.3 Milwaukee, WI* 2.5 Richmond, VA* 2.7 San Francisco Peninsula, CA 2.7 Jacksonville, FL 2.8 Columbus, OH* 2.8 Pittsburgh, PA* 2.8 Long Island NY 3.1 Orlando, FL 3.1 Louisville, KY* 3.2 Cleveland, OH* 3.3 Cincinnati, OH* 3.3 Ft. Lauderdale, FL 3.7 Kansas City, MO* 3.8 Salt Lake City, UT* 3.9 Boston, MA 4.1 Portland, OR 4.3 Nashville, TN* 4.5 Miami, FL 5.1 Seattle, WA* 5.1 New Jersey - Northern 5.5 Philadelphia, PA 5.6 St. Louis, MO* 6.1 Oakland, CA 6.5 Baltimore, MD 6.6 Memphis, TN* 6.8 New Jersey - Central 7.3 Indianapolis, IN* 7.6 PA I-81/I-78 Distribution Corridor 7.8 Phoenix, AZ 8.9 Las Vegas, NV* 9.1 San Diego, CA 10.2 Denver, CO 10.3 Silicon Valley, CA 11.0 Orange County, CA 13.1 Houston, TX 14.7 Atlanta, GA 15.2 Dallas/Ft. Worth TX 19.0 Inland Empire CA 24.7 Chicago, IL 27.4 Greater Los Angeles 37.7 0.0 5.0 10.0 15.0 20.0 25.0 30.0 35.0 40.0 Million Square Feet
- 4. U.S. Industrial Market Statistics 4Q10 2010 Construction Completions Richmond, VA* 0.04 Oklahoma City, OK* 0.06 Tucson, AZ* 0.08 Kansas City, MO* 0.08 Silicon Valley, CA 0.09 Syracuse, NY* 0.09 Long Island NY 0.1 Ft. Lauderdale, FL 0.1 Hampton Roads, VA* 0.1 St. Louis, MO* 0.1 Miami, FL 0.2 Hartford, CT 0.2 Orlando, FL 0.2 San Diego, CA 0.2 Detroit, MI* 0.2 Jacksonville, FL 0.2 Pittsburgh, PA* 0.3 Indianapolis, IN* 0.3 Baltimore, MD 0.3 Denver, CO 0.3 Milwaukee, WI* 0.4 Seattle, WA* 0.4 New Jersey - Northern 0.4 Philadelphia, PA 0.5 Orange County, CA 0.5 Portland, OR 0.5 Greater Los Angeles 0.5 Savannah, GA* 0.6 Salt Lake City, UT* 0.6 Louisville, KY* 0.8 Cleveland, OH* 0.9 Nashville, TN* 0.9 Dallas/Ft. Worth TX 1.0 Houston, TX 1.1 Phoenix, AZ 1.2 Chicago, IL 1.5 Inland Empire CA 1.6 PA I-81/I-78 Distribution Corridor 2.2 Atlanta, GA 3.0 0.0 0.5 1.0 1.5 2.0 2.5 3.0 3.5 Million Square Feet If a market is not listed in the graph, then no activity was reported in 2010.
- 5. U.S. Industrial Market Statistics 4Q10 Projects Under Construction Fredericksburg, VA* 0.02 St. Petersburg/Clearwater, FL 0.03 San Antonio, TX* 0.06 Oklahoma City, OK* 0.07 Hampton Roads, VA* 0.07 Suburban MD 0.08 Tampa, FL 0.09 Savannah, GA* 0.1 Northern VA 0.1 Contra Costa, CA 0.1 Pittsburgh, PA* 0.2 San Diego, CA 0.2 Tulsa, OK* 0.2 St. Louis, MO* 0.2 Jacksonville, FL 0.3 Phoenix, AZ 0.3 Cleveland, OH* 0.3 Louisville, KY* 0.3 Detroit, MI* 0.3 Long Island NY 0.3 New Jersey - Northern 0.4 Lakeland, FL 0.4 PA I-81/I-78 Distribution Corridor 0.5 Houston, TX 0.6 Denver, CO 0.6 Milwaukee, WI* 0.7 New Jersey - Central 0.7 Salt Lake City, UT* 0.9 Silicon Valley, CA 0.9 Philadelphia, PA 1.0 Las Vegas, NV* 1.0 Kansas City, MO* 1.1 Atlanta, GA 1.3 Greater Los Angeles 1.4 Indianapolis, IN* 1.6 Dallas/Ft. Worth TX 1.6 Nashville, TN* 2.1 Inland Empire CA 2.4 Chicago, IL 2.9 0.0 0.3 0.5 0.8 1.0 1.3 1.5 1.8 2.0 2.3 2.5 2.8 3.0 Million Square Feet If a market is not listed in the graph, then no activity was reported in 2010.