
Recomendados
Recomendados
Mais conteúdo relacionado
Mais procurados
Mais procurados (20)
Destaque
Destaque (6)
Semelhante a Arc Sight Info Documents 7 2009
Semelhante a Arc Sight Info Documents 7 2009 (20)
Arc Sight Info Documents 7 2009
- 1. ArcSight Ranked as Top "In Use" Vendor for Event Log Management System and Securit... Page 1 of 2 Print Back to story ArcSight Ranked as Top "In Use" Vendor for Event Log Management System and Security Information Event Management According To TheInfoPro's Information Security Study Press Release Source: ArcSight, Inc. On Tuesday July 28, 2009, 8:00 am EDT CUPERTINO, Calif.--(BUSINESS WIRE)--ArcSight, Inc. (NASDAQ:ARST - News), a leading global provider of security and compliance management solutions that intelligently identify and mitigate cyber threat and risk for businesses and government agencies, today announced it was named top “in use” vendor for both event log management system and security information event management (SIEM) product categories among Fortune 1000 (F1000) security professionals in TheInfoPro’s™ Information Security Study: Technology Roadmap (Wave 11, Q2 2009). TheInfoPro’s Information Security Study: Technology Roadmap (Wave 11, Q2 2009) is based on interviews with 246 information security professionals at F1000 and MSE organizations in North America and Europe that were completed in May 2009. The study provides detailed plans about usage patterns for 43 information security technologies that fall under the following categories: network access, network malware protection, network communication content protection, identity management, vulnerability management, access management, data protection and outsourced security services. Log management solutions ranked among the top of both the study’s Fortune 1000 (F1000) and Midsize Enterprise (MSE) Security Management Solutions Heat Indices, which gauges the immediacy of user need and planned spending. Other findings of note from TheInfoPro’s Information Security Study: Vendor Performance Report (Wave 11, Q2 2009) include: 100 percent of the current ArcSight customers who took part in the study indicated that they have no plans to switch to a competitor. 50 percent of participants that rated ArcSight plan to spend more money on its products in 2010 than they did in 2009. ArcSight received the highest possible ratings in the areas of “delivery as promised” and “brand / reputation,” and solid customer ratings in the areas of “technical innovation,” “features / functions” and “product quality.” “We’re happy that TheInfoPro’s Information Security Study recognizes again how important ArcSight’s compliance and security management solutions are to the industry and more importantly, our customers,” said Tom Reilly, president and CEO of ArcSight. “In the current economic environment, we are seeing a barrage of sophisticated cyber attacks. We’re working closely with our customers to give them real-time awareness of cyber threats and risks that occur within and outside the organization.” “Each year, respondents to our Information Security Study continue to give ArcSight high results in the “delivering as promised” and “brand reputation” categories for their SIEM and event log management solutions,” said Bill Trussell, Managing Director of Information Security Research at TheInfoPro. “Our interviewees indicate that organizations are choosing the ArcSight brand to give them the tools they need to protect their business from cyber threat and risk.” About TheInfoPro TheInfoPro is the only independent research network for the Information Technology (IT) industry. Through a peer network of over 1800 of the world’s largest buyers and users of IT, including Citigroup, FedEx, McGraw-Hill, MasterCard, Pfizer, Vodafone, PepsiCo, JPMorgan Chase, and Harvard University, TheInfoPro delivers detailed budget, vendor performance and technology roadmap data without spin or bias. Known as the “voice of the customer,” TheInfoPro helps IT professionals, technology providers, and institutional investors make sound decisions on technologies, vendor relationships and investments. TheInfoPro was founded in 2002 by alumni of Gartner, Giga, EMC, and Bell Labs. To learn more, visit www.theinfopro.net or call 1-212-672-0010. About ArcSight ArcSight (NASDAQ: ARST - News) is a leading global provider of security and compliance management solutions that protect businesses and government agencies. ArcSight identifies, assesses, and mitigates both internal and external cyber threats and risks across the organization for activities associated with critical assets and processes. With the market-leading ArcSight SIEM platform, organizations can proactively safeguard their assets, comply with corporate and regulatory policy and control the risks associated with cyber-theft, cyber-fraud, cyber-warfare and cyber-espionage. For more information, visit www.arcsight.com. Forward Looking Statements This news release contains forward-looking statements, including without limitation those regarding findings from TheInfoPro’s Information Security Study that 100 percent of the current ArcSight customers who took part in the study indicated that they have no plans to switch to a competitor and that 50 percent of respondents who rated ArcSight plan to spend more money on its products in 2010 than they did in 2009. These forward-looking statements are subject to material risks and uncertainties that may cause actual results to differ substantially from expectations. Investors should consider important risk factors, which include: the risk that demand for our compliance and security management solutions may not increase and may decrease; the risk that competitors may be perceived by customers to be better positioned to help handle compliance violations and security threats and protect their businesses from major risk; and other risks detailed under the caption “Risk Factors” in the ArcSight Annual Report on Form 10-K filed with the Securities and Exchange Commission, or the SEC, on July 9, 2009 and the company’s other filings with the SEC. You can obtain copies of the company’s Annual Report on Form 10-K and its other SEC filings on the SEC’s website at www.sec.gov. © 2009 ArcSight, Inc. All rights reserved. ArcSight and the ArcSight logo are trademarks of ArcSight, Inc. http://finance.yahoo.com/news/ArcSight-Ranked-as-Top-In-Use-bw-2757755562.html/pri... 7/28/2009
- 2. June 19, 2009 Scott Zeller • szeller@needhamco.com • 617-457-0903 Infrastructure Software / Software ArcSight, Inc. (ARST) – Buy ARST: Reiterate BUY, raise target from $19 to $21 after positive investor meetings We hosted ArcSight management on Thursday for investor meetings; investor interest was quite strong. We found discussions to be positive, Price Target Change with the questions noticeably shifting away from a focus on earnings and margins, and focusing more often on drivers for revenue growth. Our view Market D ata is investors are weighing the fundamentals of demand for ARST products Price (06/18/09) $17.48 vs. ability to scale the company, and also the timing of such revenue 12-Month Price Target $21.00 growth (near-term vs. long-term). Our impression is investors view last week’s quarterly guidance as conservative, yet appropriate – as evidence, 52-Week range $18.72-4.74 we point to the flattish recent performance of shares, despite conservative Shares Out. (MM) 34.4 guidance below consensus for F1Q. We believe near-term (FY10) revenue Market cap (MM) $601.6 growth is likely to be driven by continued growth in the public sector and Avg. daily volume (000) 562.7 enterprise appliances; longer-term growth (FY11, beyond) is likely to be driven by utilities/power grid/infrastructure, as well as certain just-initiated Financial Data government agency projects, called out by management as important Total Debt/Cap. 0.0% contributors, yet still too early for FY10 contribution. On the earnings Price/LTM Rev. 4.4x picture, we believe the company has moderated expectations for margins Tangible BVPS $2.02 with last week’s comments about FY10 being an investment year for the Net Cash Per Share $2.63 company; investors may find this passable, so long as the revenue growth remains robust. Reiterate BUY, upping target from $19 to $21, no change to our above-consensus estimates, which are likely conservative. • Focus on revenue growth – near-term vs. long term. A nuance we had ArcSight, Inc. participates in the security not previously understood is that although government is the biggest revenue software market, where it is a leader in the vertical at ARST, several government projects were started in the most recent two quarters, and have “seeded” large projects for the future; we were event management market. ArcSight products encouraged by this because it suggests FY11 revenue strength, and at the help customers manage IT performance alerts same time explains why currently 70% of revs come from existing customers. by collecting, correlating and prioritizing risk • Customer “lifecycle” revenue growth grabs attention. We believe items. management’s emphasis on how an initial $300k deal grows over a few years to be 3x original investment (or greater) caught investor attention and is a positive of the ARST long term growth story. • Reiterate BUY, raise target from $19 to $21, no change to our above- consensus estimates, which are likely conservative. Our $21 target is 3.0x EV/FY11 revenue, and 30x our FY11 $0.70 EPS estimate. We chose to up our target from 2.7x up to 3.0x EV/FY11 revenue, based on similar valuations for revenue growth comps, including RVBD (now 3.1x EV/revs) and VMW (now 5.2x EV/revs). ArcSight, Inc. Price 06/18/09 FY FY FY 20 04/30/09 A 04/30/10 E 04/30/11 E 18 Old New Old New 16 14 Rev. (MM) $136.2 $159.2 $159.2 $189.0 $189.0 12 Growth 34.1% 16.9% 16.9% 18.7% 18.7% 10 8 Op. Mar. 13.8% 18.2% 20.8% 6 EPS: 1Q 0.01 0.08 0.08 0.15 0.15 Jun Jul Aug Sep Oct Nov Dec Jan Feb Mar Apr May Jun 4 EPS: 2Q 0.11 0.13 0.13 0.17 0.17 Volume (000) EPS: 3Q 0.21 0.16 0.16 0.19 0.19 3,500 3,000 2,500 EPS: 4Q 0.18 0.17 0.17 0.20 0.20 2,000 1,500 EPS: Year 0.51 0.54 0.54 0.70 0.70 1,000 500 0 Growth nm 7.1% 7.1% 29.9% 29.9% Jun Jul Aug Sep Oct Nov Dec Jan Feb Mar Apr May Jun P/E Ratio 18.0x 32.3x 32.3x 24.9x 24.9x Note: Pro forma earnings estimates displayed above do not include one-time items or any stock compensation expenses. Disclosures applicable to this security: B, G. Disclosure explanation on the inside back cover of this report.
- 3. Summary We hosted ArcSight management on Thursday for investor meetings; investor interest was quite strong. We found discussions to be positive, with the questions noticeably shifting away from a focus on earnings and margins, and focusing more often on drivers for revenue growth. Our view is investors are weighing the fundamentals of demand for ARST products vs. ability to scale the company, and also the timing of such revenue growth (near-term vs. long-term). Our impression is investors view last week’s quarterly guidance as conservative, yet appropriate – as evidence, we point to the flattish recent performance of shares, despite conservative guidance below consensus for F1Q. We believe near-term (FY10) revenue growth is likely to be driven by continued growth in the public sector and enterprise appliances; longer-term growth (FY11, beyond) is likely to be driven by utilities/power grid/infrastructure, as well as certain just-initiated government agency projects, called out by management as important contributors, yet still too early for FY10 contribution. On the earnings picture, we believe the company has moderated expectations for margins with last week’s comments about FY10 being an investment year for the company; investors may find this passable, so long as the revenue growth remains robust. Reiterate BUY, upping target from $19 to $21, no change to our above-consensus estimates, which are likely conservative Focus on revenue growth – near-term vs. long term. A nuance we had not previously understood is that although government is the biggest revenue vertical at ARST, several government projects were started in the most recent two quarters, and have “seeded” large projects for the future; we were encouraged by this point because it points to FY11 revenue strength, and also answers how revenue from existing customers has climbed to 70% range in recent two quarters (customer wins healthy, yet some newer gov’t wins generating moderate/early revenue). Margin story consistent with recent call – this year is an investment year. As described on last week’s earnings call, FY10 is an infrastructure growth year for ARST as it focuses on international revenue growth and domestic channel partner programs; this is baked in shares, as FY10 EPS growth now sub 5%. Focus is on revenue growth. Customer “lifecycle” revenue growth caught attention. We believe management’s emphasis on how an initial $300k deal grows over a few years to be 3x original investment (or greater) caught investor attention and is a positive of the ARST long term growth story. Follow on purchases include: additional endpoint tracking, new geographies, and additional appliances. Field info encouraging. Our view is fundamental demand for ARST’s compliance security software remains solid; we base this view on field discussions with several private company competitors to ARST. As CEO Tom Reilly has said, (paraphrase) “audit occurs during a down economy as well as a good economy”, and ARST software supports compliance and audit, making it less discretionary in IT budgets. Reiterate BUY, raise target from $19 to $21, no change to our above- consensus estimates, which are likely conservative. Our $21 target is 3.0x EV/FY11 revenue, and 30x our FY11 $0.70 EPS estimate. We chose to up our target from 2.7x up to 3.0x EV/FY11 revenue, based on similar valuations for revenue growth comps, including RVBD (now 3.1x EV/revs) and VMW (now 5.2x EV/revs) Risk statement: Buyers of ARST shares face risks including but not limited to: a continued challenging IT spending environment, competition from larger better 2 An Investment Analysis by Needham & Company, LLC
- 4. capitalized participants in the network equipment and enterprise software markets; the challenge of growing international revenues. An Investment Analysis by Needham & Company, LLC 3
- 5. Income Statement: Arc Sight, Inc. (ARST) FY 2009 FY 2010 FY 2011 F1Q F2Q F3Q F4Q F1Q F2Q F3Q F4Q F1Q F2Q F3Q F4Q FY08 July 08 Oct 08 Jan 09 Apr 09 (A) FY09 July 09 (E) Oct 09 Jan 10 Apr 10 FY10 July 10 Oct 10 Jan 11 Apr 11 FY11 Products 63.765 15.802 19.169 21.775 23.870 80.616 19.000 22.000 23.000 25.000 89.000 20.000 24.000 26.000 28.000 98.000 Maintenance 27.607 8.568 9.530 10.004 10.419 38.521 11.000 12.000 13.000 14.000 50.000 15.000 16.000 17.000 18.000 66.000 Services 10.173 3.293 4.136 4.613 4.989 17.031 4.500 4.800 5.200 5.700 20.200 5.500 6.000 6.500 7.000 25.000 TOTAL REVENUE $101.545 $27.663 $32.835 $36.392 $39.278 $136.168 $34.500 $38.800 $41.200 $44.700 $159.200 $40.500 $46.000 $49.500 $53.000 $189.000 cost of product 4.767 1.655 1.844 2.637 2.459 8.595 2.100 2.300 2.400 2.500 9.300 2.200 2.500 2.500 2.700 9.900 gross mgn product 93% 90% 90% 88% 90% 89% 89% 90% 90% 90% 90% 89% 90% 90% 90% 90% cost of maintenance 5.585 1.585 1.609 1.581 1.870 6.645 1.900 2.000 2.200 2.400 8.500 2.500 2.700 2.900 2.100 10.200 gross mgn maint 80% 82% 83% 84% 82% 83% 83% 83% 83% 83% 83% 83% 83% 83% 88% 85% cost of services 5.685 2.010 2.348 2.553 2.822 9.733 2.500 2.700 2.900 3.200 11.300 3.000 3.300 3.600 3.900 13.800 gross mgn svcs 44% 39% 43% 45% 43% 43% 44% 44% 44% 44% 44% 45% 45% 45% 44% 45% Total Cost of Revenue 16.037 5.250 5.801 6.771 7.151 24.973 6.500 7.000 7.500 8.100 29.100 7.700 8.500 9.000 8.700 33.900 Cost of Sales as % of Revenue 16% 19% 18% 19% 18% 18% 19% 18% 18% 18% 18% 19% 18% 18% 16% 18% Gross Profit 85.508 22.413 27.034 29.621 32.127 111.195 28.000 31.800 33.700 36.600 130.100 32.800 37.500 40.500 44.300 155.100 GROSS MGN 84.2% 81.0% 82.3% 81.4% 81.8% 81.7% 81.2% 82.0% 81.8% 81.9% 81.7% 81.0% 81.5% 81.8% 83.6% 82.1% OPEX R&D 18.406 4.976 5.089 4.879 6.251 21.195 5.500 6.000 6.000 6.500 24.000 6.000 7.000 7.000 8.000 28.000 S&M 50.768 14.117 13.605 11.832 14.276 53.830 13.500 14.000 14.500 16.000 58.000 14.000 16.000 17.000 18.000 65.000 G&A 12.758 4.115 4.503 4.157 5.495 18.270 5.000 5.000 5.000 5.000 20.000 5.000 5.500 6.000 7.000 23.500 Other (e.g., amortization) (0.573) (0.211) (0.238) (0.210) (0.211) (0.870) (0.200) (0.200) (0.200) (0.200) (0.800) (0.200) (0.200) (0.200) (0.200) (0.800) Total OPEX 81.359 22.997 22.959 20.658 25.811 92.425 23.800 24.800 25.300 27.300 101.200 24.800 28.300 29.800 32.800 115.700 Loss/Profit From Operations 4.149 (0.584) 4.075 8.963 6.316 18.770 4.200 7.000 8.400 9.300 28.900 8.000 9.200 10.700 11.500 39.400 OPERATING MGN 4.1% -2.1% 12.4% 24.6% 16.1% 13.8% 12.2% 18.0% 20.4% 20.8% 18.2% 19.8% 20.0% 21.6% 21.7% 20.8% Other Income & Interest expense 0.472 0.305 0.300 0.157 (0.068) 0.694 0.000 0.000 0.200 0.200 0.400 0.200 0.200 0.200 0.200 0.800 Pretax Income 4.621 (0.279) 4.375 9.120 6.248 19.464 4.200 7.000 8.600 9.500 29.300 8.200 9.400 10.900 11.700 40.200 Taxes 1.131 (0.563) 0.795 2.183 0.149 2.564 1.428 2.380 2.924 3.230 9.962 2.788 3.196 3.706 3.978 13.668 Tax Rate 24% NM 18% 24% 2% 13% 34% 34% 34% 34% 34% 34% 34% 34% 34% 34% Net Income 3.490 0.284 3.580 6.937 6.099 16.900 2.772 4.620 5.676 6.270 19.338 5.412 6.204 7.194 7.722 26.532 Diluted Shares Outstanding 25.936 33.114 32.780 33.494 34.416 33.451 35.000 35.500 36.000 36.500 35.750 37.000 37.500 38.000 38.500 37.750 EPS $0.12 $0.01 $0.11 $0.21 $0.18 $0.51 $0.08 $0.13 $0.16 $0.17 $0.54 $0.15 $0.17 $0.19 $0.20 $0.70 Total Revenue Y/Y 45% 39% 33% 32% 34% 34% 25% 18% 13% 14% 17% 17% 19% 20% 19% 19% Total Revenue Q/Q NA -6% 19% 11% 8% NA -12% 12% 6% 8% NA -9% 14% 8% 7% NA EPS Y/Y #VALUE! 321% 7% 30% R&D as % of revenue 18% 18% 15% 13% 16% 16% 16% 15% 15% 15% 15% 15% 15% 14% 15% 15% S&M as % of revenue 50% 51% 41% 33% 36% 40% 39% 36% 35% 36% 36% 35% 35% 34% 34% 34% G&A as % of revenue 13% 15% 14% 11% 14% 13% 14% 13% 12% 11% 13% 12% 12% 12% 13% 12% CY08 Revenue $126.266 CY09 Revenue $153.778 CY10 Revenue $180.700 EPS $0.34 EPS $0.54 EPS $0.67 4 An Investment Analysis by Needham & Company, LLC
- 6. Balance Sheet: Arc Sight, Inc. (ARST) note: figures are cumulative FY 2008 FY 2009 F1Q F2Q F3Q F4Q F1Q F2Q F3Q F4Q FY06 FY07 July 07 Oct 07 Jan 08 Apr 08 FY08 July 08 Oct 08 Jan 09 Apr 09 (A) FY09 Assets Current Assets Cash and cash equivalents 16.443 16.917 21.231 71.946 71.946 74.172 75.678 82.891 90.467 90.467 Accounts Receivable, net 12.247 15.554 9.399 26.658 26.658 17.323 23.192 22.223 34.184 34.184 Capitalized software licenses, current 0.000 0.249 1.998 1.900 1.900 0.000 Other prepaid expenses, current assets 1.277 2.207 2.786 3.665 3.665 5.886 4.152 3.176 3.861 3.861 Other 0.000 0.000 0.000 0.000 Total Current Assets 29.967 34.927 0 0 35.414 104.169 104.169 97.381 103.022 108.29 128.512 128.512 Restricted Cash 0.000 0.842 0.842 0.842 0.842 0.000 Income taxes receivable 1.020 0.761 0.738 0.391 0.391 0.000 Property and equipment, net 1.925 2.753 4.915 4.834 4.834 5.479 5.226 4.749 4.416 4.416 Goodwill 0.000 5.746 5.746 5.746 5.746 5.746 5.746 5.746 5.746 5.746 Acquired intangible assets, net 0.000 2.734 2.304 2.161 2.161 1.950 1.740 1.530 1.319 1.319 Capitalized software licenses, non-current 0.000 0.394 0.589 0.144 0.144 0.000 Other 0.014 0.833 3.863 0.292 0.292 1.422 1.411 1.391 1.168 1.168 TOTAL ASSETS 32.926 48.990 0.000 0.000 54.411 118.579 118.579 111.978 117.145 121.706 141.161 141.161 Liabilities and Stockholders' Equity Current Liabilities Accounts payable 0.647 2.846 0.834 3.115 3.115 2.548 3.349 1.230 1.432 1.432 Accrued compensation and benefits 3.384 6.678 6.154 11.864 11.864 5.591 6.529 7.757 11.671 11.671 Obligations for software licenses 0.000 0.551 2.427 2.222 2.222 0.000 Other accrued liabilities 2.845 3.869 3.590 3.745 3.745 6.435 6.110 6.485 4.700 4.700 Deferred revenues, current 17.714 24.794 28.678 36.512 36.512 35.613 34.777 33.524 36.160 36.160 Other 0.000 0.000 0.000 0.000 Total Current Liabilities 24.590 38.738 0.000 0.000 41.683 57.458 57.458 50.187 50.765 48.996 53.963 53.963 Deferred revenues, non-current 6.903 4.794 2.734 4.754 4.754 5.152 4.685 3.970 8.888 8.888 Other 0.000 0.328 1.709 1.598 1.598 1.643 1.626 1.687 1.637 1.637 TOTAL LIABILITIES 31.493 43.860 0.000 0.000 46.126 63.810 63.810 56.982 57.076 54.653 64.488 64.488 TOTAL STOCKHOLDERS EQUITY 1.433 5.130 0.000 0.000 8.285 54.769 54.769 54.996 60.069 67.053 76.673 76.673 Convertible preferred stock 26.758 26.758 26.758 0.000 0.000 0.000 Common stock 0.000 0.000 0.000 0.000 0.000 0.000 Additional paid-in capital 19.383 23.479 27.391 101.574 101.574 103.087 106.518 108.531 113.781 113.781 Deferred stock based compensation (0.396) (0.554) (0.169) (0.053) (0.053) (0.009) (0.002) 0.000 Accumulated other comprehensive income (0.003) 0.013 (0.048) (0.045) (0.045) (0.045) (0.255) (0.349) (0.314) (0.314) Accumulated deficit (44.309) (44.566) (45.647) (46.707) (46.707) (48.037) (46.192) (41.129) (36.794) (36.794) TOTAL LIABILITIES & STOCKHOLDERS' EQUIT 32.926 48.990 0.000 0.000 54.411 118.579 118.579 111.978 117.145 121.706 141.161 141.161 An Investment Analysis by Needham & Company, LLC 5
- 7. ArcSight, Inc. ($ in MM, except per share data) Annual Quarterly Fiscal Year Ending April 30 FY FY Ending Ending Ending Ending 4/30/2008 4/30/2009 7/31/2008 10/31/2008 1/31/2009 4/30/2009 BALANCE SHEET ASSETS Cash & Short-term Investments 71.9 90.5 74.2 75.7 82.9 90.5 Receivables 26.7 34.2 17.3 23.2 22.2 34.2 Inventory 0.0 0.0 0.0 0.0 0.0 0.0 Other Current Assets 5.6 3.9 5.9 4.2 3.2 3.9 Current Assets 104.2 128.5 97.4 103.0 108.3 128.5 Property and Equipment 4.8 4.4 5.5 5.2 4.7 4.4 Goodwill and Intangibles 7.9 7.1 7.7 7.5 7.3 7.1 Long-term Marketable Securities 0.8 0.0 0.0 0.0 0.0 0.0 Other Assets 0.8 1.2 1.4 1.4 1.4 1.2 Total Assets 118.6 141.2 112.0 117.1 121.7 141.2 LIABILITIES AND SHAREHOLDERS' EQUITY Current Liabilities 57.5 54.0 50.2 50.8 49.0 54.0 Short-term Debt 0.0 0.0 0.0 0.0 0.0 0.0 Long-term Debt 0.0 0.0 0.0 0.0 0.0 0.0 Shareholders' Equity 54.8 76.7 55.0 60.1 67.1 76.7 Total Liabilities + Shareholders' Equity 118.6 141.2 112.0 117.1 121.7 141.2 INCOME STATEMENT Revenue 101.5 136.2 27.7 32.8 36.4 39.3 Gross Profit 85.5 111.2 22.4 27.0 29.6 32.1 Operating Income 4.1 18.8 (0.6) 4.1 9.0 6.3 Pretax Income 4.6 19.5 (0.3) 4.4 9.1 6.2 Net Income 3.5 16.9 0.3 3.6 6.9 6.1 Shares Outstanding 25.9 33.5 33.1 32.8 33.5 34.4 CASH FLOW STATEMENT Depreciation and Amortization 2.5 0.0 0.8 1.6 2.5 0.0 Cash Flow from Operations 13.5 0.0 3.8 4.5 12.3 0.0 Capital Expenditures (4.0) 0.0 (1.2) (1.6) (1.8) 0.0 CASH MANAGEMENT* DSOs 75.9 81.5 71.5 55.5 56.2 64.6 Inventory Days 0.0 0.0 0.0 0.0 0.0 0.0 Days Payable 67.8 33.2 48.5 45.7 30.4 16.8 Cash Conversion Cycle 8.0 48.3 23.0 9.8 25.7 47.9 PROFITABILITY Gross Margin 84.2% 81.7% 81.0% 82.3% 81.4% 81.8% Operating Margin 4.1% 13.8% (2.1%) 12.4% 24.6% 16.1% Net Margin 3.4% 12.4% 1.0% 10.9% 19.1% 15.5% Return on Assets* 4.2% 13.0% 1.0% 12.5% 23.2% 18.6% Return on Equity* 11.7% 25.7% 2.1% 24.9% 43.7% 33.9% Total D ebt/Capital 0.0% 0.0% 0.0% 0.0% 0.0% 0.0% PER SHARE DATA Tangible Book Value 1.81 2.08 1.43 1.60 1.78 2.02 Cash 2.81 2.70 2.24 2.31 2.47 2.63 Net Cash 2.81 2.70 2.24 2.31 2.47 2.63 EPS (Pro Forma) 0.12 0.51 0.01 0.11 0.21 0.18 EPS (Pro Forma Including Option Expenses) EPS (GAAP) 6 An Investment Analysis by Needham & Company, LLC
- 8. ANALYST CERTIFICATION I, Scott Zeller, hereby certify that the views expressed in this research report accurately reflect my personal views about the subject company (ies) and its (their) securities. I also certify that I have not been, am not, and will not be receiving direct or indirect compensation in exchange for expressing the specific recommendation(s) in this report. Price, Rating, and Price Target History: ArcSight, Inc. (ARST/NASDAQ) as of 6-18-09 9/29/08 12/10/08 1/13/09 3/6/09 3/26/09 6/12/09 6/18/09 B : $11.0 B : $8.0 B : $11.0 B : $13.0 B : $14.0 B : $19.0 B : $21.0 22 20 18 16 14 12 10 8 6 4 Dec 07 Mar 08 Jun 08 Sep 08 Dec 08 Mar 09 Jun 09 Source: Factset (Prices) / Needham (ratings and target price) Disclosures applicable to this security: B, G. An Investment Analysis by Needham & Company, LLC 7
- 9. 445 Park Avenue, New York, NY 10022 (212) 371-8300 % of companies under coverage % for which investment banking services with this rating have been provided for in the past 12 months Strong Buy 4 0 Buy 47 6 Hold 42 4 Under Perform <1 0 Rating Suspended 4 0 Restricted <1 33 Under Review <1 50 Needham & Company, LLC. (the Firm) employs a rating system based on the following (Effective July 1, 2003): Strong Buy: A security, which at the time the rating is instituted, indicates an expectation of a total return of at least 25% over the next 12 months. Buy: A security, which at the time the rating is instituted, indicates an expectation of a total return between 10% and 25% over the next 12 months. Hold: A security, which at the time the rating is instituted, indicates an expectation of a total return of +/- 10% over the next 12 months. Underperform: A security, which at the time the rating is instituted, indicates an expectation that the price will depreciate by more than 10% over the next 12 months. Under Review: Stocks may be placed UR by the analyst, indicating that the stock rating and/or price target are subject to possible change in the near term, usually in response to an event that may effect the investment case or valuation. Rating Suspended: Needham & Company, LLC has suspended the rating and/or price target, if any, for this stock, because there is not a sufficient fundamental basis for determining a rating or price target. The previous rating and price target, if any, are no longer in effect and should not be relied upon. Restricted: Needham & Company, LLC policy and/or applicable law and regulations preclude certain types of communications, including an investment recommendation, during the course of Needham & Company, LLC’s engagement in an investment banking transaction and in certain other circumstances. For disclosure purposes (in accordance with FINRA requirements), we note that our Strong Buy and Buy ratings most closely correspond to a “Buy” recommendation. When combined, 51% of companies under coverage would have a “Buy” rating and 5% have had investment banking services provided within the past 12 months; Hold mostly correspond to a “Hold/ Neutral” recommendation; while our Underperform rating closely corresponds to the Sell recommendation required by the FINRA. Our rating system attempts to incorporate industry, company and/or overall market risk and volatility. Consequently, at any given point in time, our investment rating on a stock and its implied price appreciation may not correspond to the stated 12-month price target. For valuation methods used to determine our price targets and risks related to our price targets, please contact your Needham & Company, LLC salesperson for a copy of the most recent research report on the company you are interested in. To review our Rating system prior to July 1, 2003, please refer to the following link: http://www.needhamco.com/Research_Disclosure.asp. Stock price charts and rating histories for companies under coverage and discussed in this report are available at http://www.needhamco.com/. You may also request this information by writing to: Needham & Co. LLC, 445 Park Ave., 3rd Floor (Attn: Compliance/Research), NY, NY 10022 ANALYST CERTIFICATION By issuing this research report, each Needham & Company, LLC analyst and associate whose name appears within this report hereby certifies that (i) the recommendations and opinions expressed in the research report accurately reflect the research analyst’s and associate’s personal views about any and all of the subject securities or issuers discussed herein and (ii) no part of the research analyst's or associate’s compensation was, is or will be directly or indirectly related to the specific recommendations or views expressed by the research analyst or associate in the research report. The following disclosures (as listed by letter on the cover page) apply to the securities discussed in this research report: “A” The research analyst and/or research associate (or household member) has a financial interest in the securities of the covered company (i.e., a long position consisting of common stock). “B” The research analyst and research associate have received compensation based upon various factors, including quality of research, investor client feedback, and the Firm’s overall revenues, which includes investment banking revenues. “C” The Firm has managed or co-managed a public offering of securities for the subject company in the past 12 months. “D” The Firm and/or its affiliate have received compensation for investment banking services from the subject company in the past 12 months. “E” The Firm and/or its affiliate expect to receive or intend to seek compensation for investment banking services from the subject company in the next three months. “F” The analyst or a member of the analyst's household serves as officer, director or advisory board member of the covered company. “G” The Firm, at the time of publication, makes a market in the subject company. “H” The Firm, and/or its affiliates beneficially own 1% or more of any class of common equity securities of the subject company. “I” The analyst has received compensation from the subject company in the last 12 months. “J” The subject company currently is or during the 12-month period preceding the date of distribution of this research report was a client of the Firm and received investment banking services. “J1” The subject company currently is or during the 12-month period preceding the date of distribution of this research report was a client of the Firm and received non-investment banking securities related services. “J2” The subject company currently is or during the 12-month period preceding the date of distribution of this research report was a client of the Firm and received non-securities related services. “K” Our affiliate has received compensation for products and services other than investment banking services from the subject company in the past 12 months. This report is for informational purposes only and does not constitute a solicitation or an offer to buy or sell any securities mentioned herein. Information contained in this report has been obtained from sources believed to be reliable, but Needham & Company, LLC. makes no representation as to its accuracy or completeness, except with respect to the Disclosure Section of the report. Any opinions expressed herein reflect our judgment as of the date of the materials and are subject to change without notice. The securities discussed in this report may not be suitable for all investors and are not intended as recommendations of particular securities, financial instruments or strategies to particular clients. Investors must make their own investment decisions based on their financial situations and investment objectives. The value of income from your investment may vary because of changes in interest rates, changes in the financial and operational conditions of the companies and other factors. Investors should be aware that the market price of securities discussed in this report may be volatile. Due to industry, company and overall market risk and volatility, at the securities current price, our investment rating may not correspond to the stated price target. Additional information regarding the securities mentioned in this report is available upon request. © Copyright 2009, Needham & Company, LLC., Member FINRA, SIPC. 8 An Investment Analysis by Needham & Company, LLC
- 10. Research Publication Date: 29 May 2009 ID Number: G00167782 Magic Quadrant for Security Information and Event Management Mark Nicolett, Kelly M. Kavanagh Broad adoption of SIEM technology is driven by compliance and security needs. New use cases in areas such as application activity monitoring are emerging. © 2009 Gartner, Inc. and/or its Affiliates. All Rights Reserved. Reproduction and distribution of this publication in any form without prior written permission is forbidden. The information contained herein has been obtained from sources believed to be reliable. Gartner disclaims all warranties as to the accuracy, completeness or adequacy of such information. Although Gartner's research may discuss legal issues related to the information technology business, Gartner does not provide legal advice or services and its research should not be construed or used as such. Gartner shall have no liability for errors, omissions or inadequacies in the information contained herein or for interpretations thereof. The opinions expressed herein are subject to change without notice.
- 11. WHAT YOU NEED TO KNOW Security information and event management (SIEM) technology provides real-time monitoring and historical reporting of security events from networks, systems and applications. SIEM deployments are often funded to address regulatory compliance reporting requirements, but organizations should also use SIEM to improve security operations, threat management and incident response capabilities. SIEM technology can be deployed to support three primary use cases: compliance reporting/log management, threat management, or a SIEM deployment that covers both use cases. Most organizations require a general SIEM deployment that implements capabilities in all three areas, but there is variation in use case priority and capability requirements. The SIEM market is composed of vendors with products that can provide at least basic support for all three use cases, but there is wide variation in the architectural approach and the relative level of support for security event management (SEM), security information management (SIM), user activity monitoring and compliance reporting. (For an evaluation of 11 SIEM products with the largest installed bases with respect to these use cases, see "Critical Capabilities for Security Information and Event Management Technology.") Security managers considering SIEM deployments should first define the requirements for compliance reporting, log management, user and resource access monitoring, external threat monitoring, and security incident response. This may require the inclusion of other groups in the requirements definition effort, including audit/compliance, IT operations, application owners and line-of-business managers. Organizations should also describe their network and system deployment topology, so that prospective SIEM vendors can propose a solution to a company- specific deployment scenario. The 2009 Magic Quadrant for SIEM evaluates technology providers with respect to the most- common technology selection scenario — an SIEM project that is funded to solve a compliance reporting issue, but with secondary requirements for effective threat monitoring and SEM. There are numerous variations in SIEM product architecture and deployment options, and wide variation in capabilities for log management, SEM and user monitoring. Organizations may need to evaluate SIEM products from vendors in every quadrant to best meet specific functional and operational requirements. Product selection decisions should be driven by organization-specific requirements in areas such as the relative importance of SIM and SEM capabilities; the ease and speed of deployment; the IT organization's support capabilities; and integration with established network, security and infrastructure management applications. Publication Date: 29 May 2009/ID Number: G00167782 Page 2 of 22 © 2009 Gartner, Inc. and/or its Affiliates. All Rights Reserved.
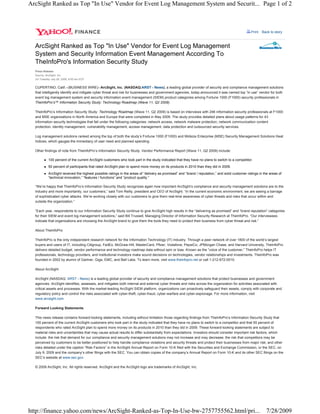
- 12. MAGIC QUADRANT Figure 1. Magic Quadrant for Security Information and Event Management Source: Gartner (May 2009) Market Overview The SIEM market grew about 30% in 2008, with total revenue at approximately $1 billion. Demand for SIEM remains strong (there is still a growing number of funded projects), but we are seeing a more tactical focus, with Phase 1 deployments that are narrower in scope. Despite a difficult environment, we still expect healthy revenue growth for 2009 in this segment. The current economic situation constrains external funding for SIEM vendors and raises viability concerns for some privately funded vendors that: • Are not yet cash-flow positive and will not receive further funding • Have current investors that need to pull their money out During 2008, High Tower ceased operations (its assets were acquired by netForensics), and a few smaller, privately held SIEM vendors pared back staffing and channel expansion initiatives to control costs. SIEM Vendor Landscape Publication Date: 29 May 2009/ID Number: G00167782 Page 3 of 22 © 2009 Gartner, Inc. and/or its Affiliates. All Rights Reserved.
- 13. Twenty-one vendors meet Gartner's inclusion requirements for the 2009 SIEM Magic Quadrant. Nine are point-solution vendors, and 12 are vendors that sell additional security or operations products and services. Because SIEM technology is now deployed by a broad set of enterprises, vendors are responding with a shift in sales and product strategy. Larger vendors are working to integrate their SIEM technology with related products or service portfolios, so that they can sell SIEM to existing customers. Vendors of all sizes are developing sales channels that can reach the midsize market in North America, and are developing a presence in Europe, the Middle East and Africa, as well as the Asia/Pacific region, as SIEM deployments increase in these regions. Some SIEM technology purchase decisions are noncompetitive, because the technology is sold by a large vendor in combination with related security, network or operations management technology. CA, IBM and Novell have integrated their SIEM products with related identity and access management (IAM) offerings, and are selling their SIEM solutions as part of an IAM- related deal. NetIQ has integrated its SIEM technology with its security configuration management and file integrity monitoring technologies. Symantec sells SIEM to large enterprises that use its endpoint security products, and has integrated its SIEM and IT governance, risk and compliance management offerings. Cisco positions its Monitoring, Analysis and Response System (MARS) as a centralized monitoring and automation platform for its self-defending network, and the majority of Cisco MARS sales are part of an equipment acquisition. In addition to the 21 vendors evaluated, a number of other companies' solutions have SIEM capabilities but do not fully meet our inclusion criteria. However, these vendors sometimes compete with the SIEM vendors in this Magic Quadrant. Splunk provides event collection, log management and search technology that is sometimes used by customers to investigate security incidents, to gain some of the capabilities provided by SIEM technology, or to complement their SIEM investments. Splunk has released predefined reports for security and compliance use cases. In April 2009, Splunk announced Splunk Enterprise Security Suite — a collection of security applications consisting of packaged searches, correlations, reports, dashboards, visualization and analysis that support security use cases, including compliance reporting, event monitoring, incident response, log management, user and system access reporting, and forensics. Splunk is not included in this evaluation because Enterprise Security Suite was released after our evaluation, and the monitoring Splunk provides is not in real time. Four vendors are not included in the Magic Quadrant because of their regional or vertical market focus and/or SIEM revenue level: • S21sec provides an SIEM solution, endpoint protection technology and managed security services to Spain and Latin America, and is planning to expand to additional geographies. • Tango/04 provides SIEM, operations monitoring and business process monitoring solutions with customer concentrations in Europe and Latin America. • Tier-3 is an Australian-based company that provides SIEM technology to the Asia/Pacific region. It is increasing its visibility in Europe. • FairWarning provides user activity and resource access monitoring at the application layer for the healthcare vertical market. A few vendors sell solutions that are based on licensed SIEM technology. Q1 Labs licenses its technology to vendors that implement the Q1 Labs technology on their own appliances and add specific integrations with their respective management infrastructures. The Enterasys Security Information and Event Manager appliance (also known as Dragon Security Command Console) Publication Date: 29 May 2009/ID Number: G00167782 Page 4 of 22 © 2009 Gartner, Inc. and/or its Affiliates. All Rights Reserved.
- 14. has been using the Q1 Labs technology since 2005, and delivers workflow integrations with Enterasys Network Access Control and NetSight Automated Security Manager for Distributed Intrusion Prevention. The Juniper Networks Security Threat Response Manager is an appliance solution that was released early in 2008 that uses the QRadar technology, and is also integrated with Juniper's policy management subsystem. Nortel has discontinued the QRadar for Nortel appliance. HP has an appliance-based offering that uses technology licensed from SenSage, and is building up an initial installed base. Although the HP Compliance Log Warehouse (CLW) solution is targeted at the broad compliance and SEM market, HP is also using the technology to enable SEM capabilities across its portfolio. HP has made CLW a core element of its Secure Advantage program, and has completed integrations with its ProCurve line of network and security devices, encryption, and software configuration management technologies. In April 2009, HP released an updated version of the CLW product that uses SenSage v.4, which provides major user interface and SEM improvements. Customer Requirements — Compliance, Log Management, Security and Fraud Detection Although compliance drives SIEM project funding, most organizations also want to improve external and internal threat-monitoring capabilities. As a consequence, there are requirements for user activity and resource access monitoring for host systems, and real-time event management for network security. Adoption of SIEM technology by a broad set of companies has fostered demand for products that provide predefined compliance reporting and security monitoring functions, and ease of deployment and support. The primary driver of the North American SIEM market continues to be regulatory compliance. More than 80% of SIEM deployment projects are funded to close a compliance gap. European and Asia/Pacific SIEM deployments have been focused primarily on external threat monitoring, but compliance is becoming a strong driver in these regions as well. Log management functions have become a more important customer requirement because of the following factors: • Payment Card Industry Data Security Standards (PCI DSS) requirement for log management • The usefulness of detailed and historical log data analysis for breach investigation and general forensics • The ability to employ log management in front of a SEM-focused deployment to enable more-selective forwarding of events to correlation engines (thereby, reducing the load on the event manager and improving its scalability) Application layer monitoring for fraud detection or internal threat management continues to evolve as a use case for SIEM technology. SIEM technology is being deployed alongside fraud detection and application monitoring point solutions to broaden their scope. These projects have been undertaken by large companies in industry vertical markets, such as financial services and telecommunications, as an internally justified security measure. A number of SIEM vendors are beginning to position their technologies as "platforms" that can provide security, operations and application analytics. An optimal SIEM solution will: • Support the real-time collection and analysis of log data from host systems, security devices and network devices • Support long-term storage and reporting Publication Date: 29 May 2009/ID Number: G00167782 Page 5 of 22 © 2009 Gartner, Inc. and/or its Affiliates. All Rights Reserved.
- 15. • Not require extensive customization • Be easy to deploy and maintain Ease of deployment, ease of support and log management functions are weighted more heavily than advanced event management functions or the ability to heavily customize an SIEM deployment. SIM as a Service Most managed security service providers have service offerings for SIM, in addition to their long- standing SEM services. These new services include the collection, analysis, reporting and storage of log data from servers, user directories, applications and databases. SIM services typically forgo real-time monitoring and alerting, and focus on compliance-oriented reporting on exceptions, reviews and documentation, with the ability to store and archive logs for later investigation and for data retention requirements. These offerings are being driven by clients that need to meet compliance requirements and are seeking an alternative to buying and implementing an SIEM product. We do not include an evaluation of the service delivery capabilities of managed security service providers (MSSPs) in this Magic Quadrant. Market Definition/Description The SIEM market is defined by the customer's need to analyze security event data in real time for internal and external threat management, and to collect, store, analyze and report on log data for regulatory compliance and forensics. SIEM products provide SIM and SEM: • SIM provides log management — the collection, reporting and analysis of log data (primarily from host systems and applications, and secondarily from network and security devices) — to support regulatory compliance reporting, internal threat management and resource access monitoring. SIM supports the privileged user and resource access monitoring activities of the IT security organization, and the reporting needs of the internal audit and compliance organizations. • SEM processes log and event data from security devices, network devices, systems and applications in real time, to provide security monitoring, event correlation and incident response. SEM supports the external and internal threat monitoring activities of the IT security organization, and improves incident management capabilities. Inclusion and Exclusion Criteria The following criteria must be met for vendors to be included in the SIEM Magic Quadrant: • The product must provide SIM and SEM capabilities. • The product must support data capture from heterogeneous data sources. • The vendor must appear on the SIEM product evaluation lists of end-user organizations. • The vendor must supply production reference accounts for SIEM deployments. • The solution must be delivered to the customer environment as a product. Vendors are excluded if: • The vendor provides SIEM functions that are oriented exclusively to data from its own products. Publication Date: 29 May 2009/ID Number: G00167782 Page 6 of 22 © 2009 Gartner, Inc. and/or its Affiliates. All Rights Reserved.
- 16. • The vendor positions its product as a SIEM offering, but the product does not appear in competitive shortlists of end-user organizations. • The vendor has less than $4 million in SIEM product revenue. • The solution is delivered exclusively as a managed service. Added No vendors were added to this update of the SIEM Magic Quadrant. Dropped High Tower ceased operations in 2008 and has been dropped from this update of the SIEM Magic Quadrant. Exaprotect was acquired by LogLogic in May 2009 and has been dropped from this update of the SIEM Magic Quadrant. Evaluation Criteria Ability to Execute • Product/service evaluates product function in areas such as SIM, SEM, log management, incident management, workflow and remediation support, and reporting capabilities. • Viability includes an assessment of the organization's financial health, the financial and practical success of the overall company, and the likelihood of the business unit to continue to invest in the product. • Sales execution/pricing evaluates the technology provider's success in the SIEM market and its capabilities in presales activities. This includes SIEM revenue and the installed base, pricing, presales support and the overall effectiveness of the sales channel. The level of interest from Gartner clients is also considered. • Market responsiveness and track record evaluates the match of the SIEM offering to the functional requirements stated by buyers at acquisition time, and the vendor's track record in delivering new functions when they are needed by the market. Also considered is how the vendor differentiates its offerings from those of its major competitors. • Customer experience is an evaluation of product function or service within production environments. The evaluation includes ease of deployment, operation, administration, stability, scalability and vendor support capabilities. This criterion is assessed by conducting qualitative interviews of vendor-provided reference customers. It uses feedback from Gartner clients that are using or have completed competitive evaluations of the SIEM offering. • Operations is an evaluation of the organization's service, support, and sales capabilities. Table 1. Ability to Execute Evaluation Criteria Evaluation Criteria Weighting Product/Service High Publication Date: 29 May 2009/ID Number: G00167782 Page 7 of 22 © 2009 Gartner, Inc. and/or its Affiliates. All Rights Reserved.
- 17. Evaluation Criteria Weighting Overall Viability (Business Unit, Financial, Strategy, High Organization) Sales Execution/Pricing High Market Responsiveness and Track Record High Marketing Execution No Rating Customer Experience High Operations High Source: Gartner (May 2009) Completeness of Vision • Market understanding evaluates the ability of the technology provider to understand buyers' needs and translate those needs into products and services. SIEM vendors that show the highest degree of market understanding are adapting to customer requirements in areas such as log management, simplified implementation and support, and compliance reporting, while also meeting SEM requirements. • Sales strategy evaluates the vendor's use of direct and indirect sales, marketing, service, and communications affiliates to extend the scope and depth of market reach. • An offering (product) strategy is the vendor's approach to product development and delivery that emphasizes functionality and feature set as they map to current requirements for SIM and SEM. Development plans during the next 12 to 18 months are also evaluated. • Innovation evaluates the vendor's development and delivery of SIEM technology that is differentiated from the competition in a way that uniquely solves critical customer requirements. Product capabilities and customer use in areas such as application layer monitoring, fraud detection and identity-oriented monitoring are evaluated, in addition to other capabilities that are product-specific, and are needed and deployed by customers. Table 2. Completeness of Vision Evaluation Criteria Evaluation Criteria Weighting Market Understanding High Marketing Strategy Standard Sales Strategy Standard Offering (Product) Strategy High Business Model No Rating Vertical/Industry Strategy No Rating Innovation High Geographic Strategy No Rating Source: Gartner (May 2009) Publication Date: 29 May 2009/ID Number: G00167782 Page 8 of 22 © 2009 Gartner, Inc. and/or its Affiliates. All Rights Reserved.
- 18. Leaders The SIEM Leaders quadrant is composed of vendors that have been the most successful in building an installed base and revenue stream within the SIEM market, have a relatively high viability rating (due to SIEM revenue or SIEM revenue in combination with revenue from other sources), and provide products that are a good functional match to general market requirements. Challengers The Challengers quadrant is composed of vendors that have a large revenue stream (typically because the vendor has multiple product and/or service lines), at least a modest-sized SIEM customer base, and products that meet a subset of the general market requirements. Many of the larger vendors in the Challengers quadrant position their SIEM solutions as an extension of related security and operations technologies. Visionaries The Visionaries quadrant is composed primarily of smaller vendors that provide SIEM technology that is a good match to general market requirements. Niche Players The Niche Players quadrant is composed primarily of smaller vendors that provide SIEM technology that is a good match to a specific SIEM use case or a subset of SIEM market requirements. Vendor Strengths and Cautions ArcSight ArcSight is the most successful and visible SIEM point solution vendor with very broad function. ArcSight has the largest installed base of its point solution competitors. It provides Enterprise Security Manager (ESM) software, which is oriented to large-scale, SEM-focused deployments, and a line of log management and collector appliances that can be implemented stand-alone or in combination with ESM. In April 2009, ArcSight announced general availability of ArcSight Express, an appliance-based offering for ESM designed for the midmarket with preconfigured monitoring and reporting, and simplified data management. Version 3 of the ArcSight Logger appliance line (released in November 2008) provides reporting and collection performance improvements. Strengths • ArcSight provides the broadest SIEM function set. • It has recently introduced an appliance that provides a simpler deployment option for SEM. • ArcSight continues to be the most visible SIEM point solution vendor in competitive evaluations. Cautions • ArcSight's ESM software is oriented to environments that need capabilities that support a security operations center, and it requires substantial end-user expertise in areas such as database tuning. Publication Date: 29 May 2009/ID Number: G00167782 Page 9 of 22 © 2009 Gartner, Inc. and/or its Affiliates. All Rights Reserved.
- 19. CA CA has been successful in selling its security information management (SIM) solution as an audit enhancement to its identity and access management (IAM) customers, but has not been competitive in use cases that require SEM. During 2008, CA sold two SIEM products: CA Audit (which CA has successfully sold to its IAM customers) provides basic log data collection and analysis for host systems; Security Command Center (SCC) provides SEM functions. On 20 April 2009, CA announced general availability of CA Enterprise Log Manager, a software appliance that provides log management, compliance reporting and analytics for applications, hosts, network devices and security devices. The product integrates with CA's IAM portfolio and is intended as a replacement for CA Audit. SCC is not widely deployed and requires extensive customization. Strengths • CA's SIM solutions are tightly integrated with the IAM technology provided by CA and are most commonly deployed for user activity monitoring on host systems. • CA's SIM solutions are especially well-suited for organizations that have already implemented other CA IAM or system management products. • Enterprise Log Manager provides simplified deployment options and better log management for use cases that require a combination of compliance reporting and general log management. Cautions • Organizations that require SEM capabilities should also evaluate SEM alternatives from other vendors. Cisco Cisco provides a widely sold solution that is primarily oriented to network security. Cisco has built the largest SIEM customer base for its Cisco Security Monitoring, Analysis, and Response System (MARS) appliance by positioning it as a component of its self-defending network strategy, and selling it to its network-focused buyers. The technology provides a combination of SEM, SIM and network behavior analysis (NBA) capabilities, and provides effective out-of-the-box network security monitoring and host activity monitoring for the platforms that it supports. Cisco has not done much to expand network device source support beyond its own devices, and MARS is limited in host platform, security device and application support. Cisco continues to have a large effect on all other SIEM vendors because of its SIEM technology presence in such a large number of customer sites. Strengths • The MARS SIEM appliance provides "out of the box" network SEM capabilities and is integrated with Cisco Security Manager. • MARS should also be considered by organizations that want to gain some NBA capabilities from their SIEM deployments. Cautions • Although MARS supports basic compliance monitoring for servers, it is not optimal for SIM deployments that require highly customized audit/reporting functions. Publication Date: 29 May 2009/ID Number: G00167782 Page 10 of 22 © 2009 Gartner, Inc. and/or its Affiliates. All Rights Reserved.
- 20. • Larger enterprises with heterogeneous network device data source requirements, and those that require consolidated correlation or reporting across multiple appliances will find MARS insufficient for their specific needs. eIQnetworks eIQnetworks is building an installed base in the enterprise SIEM market with its SecureVue software and appliance. The company licenses SEM technology to MSSPs and also to network security vendors that use it to build SEM capabilities for their product sets. eIQnetworks' SecureVue offering is unique in that it provides broad capabilities that include SEM, SIM, security configuration policy compliance, operational performance functions and some NBA capabilities in a single product. eIQ has been able to win competitive evaluations against other SIEM vendors, especially when the customer has a need for capabilities in these adjacent areas. Strengths • The SecureVue offering provides network SEM and compliance-oriented SIM capabilities that are easy to deploy. • SecureVue provides a broad function set that includes SIEM, performance, security asset and configuration policy compliance capabilities. Cautions • eIQnetworks is establishing a market presence for enterprise SIEM and needs to develop broader sales capabilities. • SecureVue capabilities are broad in areas that are not part of the typical SIEM problem set, and eIQnetworks needs to continue to find prospects that value expanded functions in competitive evaluations. • SecureVue does not yet have IAM integration beyond active directory and general Lightweight Directory Access Protocol support. IBM IBM's overall SIEM strategy is further integration with its IAM, security and service management technologies; leverage of ISS-managed services; and development of appliance-based offerings. IBM has three SIEM offerings. IBM Tivoli Compliance Insight Manager (TCIM) is SIM-focused and primarily oriented to user activity monitoring and compliance reporting. Tivoli Security Operations Manager (TSOM) is SEM-focused and primarily oriented to external threat management. Tivoli Security Information and Event Manager (TSIEM) is a loosely integrated bundle of TSOM and TCIM that enables select event sharing and common reporting from TCIM. Further integration is planned. Strengths • TSIEM integrates with a wide set of IBM and third-party IAM technologies and applications. • TSIEM provides strong reporting capabilities for compliance and user activity monitoring. • IBM is expanding the integration of its SIEM offerings with its operations management technologies. Publication Date: 29 May 2009/ID Number: G00167782 Page 11 of 22 © 2009 Gartner, Inc. and/or its Affiliates. All Rights Reserved.
- 21. Cautions • Although TSIEM provides basic integration between TSOM and TCIM, organizations that need real-time event monitoring of host log events still need to deploy two technologies. • Although TSIEM implements a log management tier via software, a log management appliance is not yet available from IBM. Intellitactics Intellitactics has rearchitected its SIEM offerings and now provides both software and appliance- based solutions for security event management compliance and log management. Intellitactics Security Manager (ISM) is a software offering that is highly customizable and optimal for large- scale SEM-focused deployments. The SAFE line of appliances provides data collection, log management and basic SEM. The new appliances address current market requirements for simplification and rapid deployment. Strengths • The current Intellitactics SIEM product line provides user interface improvements, and expanded, predefined functionality that reduces deployment and support labor when compared with previous releases. • Intellitactics provides solutions for large-scale deployments that require customization and solutions for midsize companies that require predefined function and simplified deployment. Cautions • Intellitactics must continue its effort to develop sales channels that are effective in reaching a critical mass of midsize companies. LogLogic LogLogic has expanded from its position as the major log management provider, into direct competition with the broader SIEM providers. LogLogic has expanded its functional capabilities to include SEM, database activity monitoring and network security configuration management. In May 2009, LogLogic closed the acquisition of Exaprotect, which provided SEM and network security configuration management technology. Prior to the acquisition, LogLogic had released its Security Event Manager appliance, which used technology licensed from Exaprotect. In addition, LogLogic has released Database Security Manager, which provides database activity monitoring and security management. This solution uses agent technology in combination with a specialized appliance. LogLogic has also released the Compliance Manager appliance, which provides compliance dashboards and workflow. Strengths • LogLogic has augmented its log management functions with taxonomy-based event correlation and management through the acquisition of Exaprotect. • LogLogic provides the capability to monitor and shield Oracle, SQL Server and Sybase DBMS through the use of specialized agent technology. Publication Date: 29 May 2009/ID Number: G00167782 Page 12 of 22 © 2009 Gartner, Inc. and/or its Affiliates. All Rights Reserved.
- 22. Cautions • LogLogic needs to continue efforts to extend SEM knowledge to its sales force, sales channels and presales support. LogRhythm LogRhythm's SIEM technology provides SEM and log management capabilities, as well as compliance and security operations reporting. During the past 18 months, the company has expanded beyond its primary installed base of midsize organizations to include larger enterprises. The technology can be delivered in several formats. The Dashboard, Event Manager and Log Manager formats are available as software images, as an all-in-one appliance or as separate appliances for each function. LogRhythm supports agent-based and agentless collection for many host, network and application sources, and the agent also provides basic file integrity monitoring. Strengths • LogRhythm's appliances provide a combination of log management and SEM functions that are most appropriate for midsize organizations that require both functions but have limited support capabilities. Cautions • Although LogRhythm is growing rapidly, the company is still among the group of smaller vendors in the market and needs to continue to develop its sales channels to maintain its growth. netForensics netForensics is a SIEM point solution vendor that has a mix of end-user and MSSP customers. Its SIEM solution is composed of three components: (1) nFX SIM One software provides full-function SEM that has traditionally competed with point solutions from vendors such as ArcSight, Intellitactics and Novell. (2) nFX Log One provides log management. (3) nFX Data One provides network and agent-based database activity monitoring. nFX log One and nFX Data One are available as software or an appliance and can be deployed stand-alone or loosely coupled with other nFX components. In January 2009, netForensics acquired the assets of High Tower and will position the Cinixi appliance as a combined log management and event management solution for the midmarket. Strengths • The netForensics nFX SIM One software is best-suited for deployments where real-time monitoring is required, flexible reporting is needed, and modest resources exist for customization and support. • The nFX Log One and nFX Data One appliance components broaden supported use cases to those that require basic log management and database activity monitoring capabilities. Cautions • netForensics needs to broaden its presence on competitive evaluations. Publication Date: 29 May 2009/ID Number: G00167782 Page 13 of 22 © 2009 Gartner, Inc. and/or its Affiliates. All Rights Reserved.
- 23. NetIQ NetIQ is a business unit of Attachmate. It has a portfolio of security and operations technologies, with a moderately sized SIEM customer base. NetIQ provides operations and security management software products that are integrated but typically deployed individually over time. NetIQ sells its security management products into its operations management installed base, but also to new accounts. The NetIQ Security Manager SIEM product has a large installed base that is primarily oriented to SIM, user activity monitoring and compliance reporting. The technology can be used for network and security device sources, but it is not widely deployed for this use case, because NetIQ does not typically sell to the network security buying center. The core offering is designed to process a filtered subset of log data, but integrated log data collection and archiving capabilities can be used to collect and analyze all log data from every source. Strengths • NetIQ Security Manager is most appropriate for deployments that are focused primarily on host log analysis for user and resource access monitoring and regulatory compliance reporting. • Security Manager is tightly integrated with the Change Guardian product line that provides monitoring and change detection for active directory and file integrity monitoring for host systems. Cautions • NetIQ is not optimized for deployments that are primarily focused on event management for network and security devices. NitroSecurity NitroSecurity is expanding into the SIEM market from its core intrusion detection system (IDS)/intrusion prevention system (IPS) business. The vendor sells SIEM technology into its IDS/IPS installed base and is also selling both solutions to new customers. The NitroView line of SIEM appliances uses the high-speed event storage and query technology from its IDS/IPS products. NitroView Receiver provides log collection and event correlation. NitroView ESM provides cross-source correlation and a consolidated back store to support high- speed search and reporting. During 2008, NitroSecurity acquired Rippletech and integrated its database activity monitoring technology with NitroView. Early in 2009, NitroSecurity also acquired Chronicle and is working to enable its network data analysis capabilities with its real-time monitoring. Strengths • NitroView provides a mix of SIM and SEM, and its repository can sustain high real-time event insert rates, while supporting high-performance report generation and analytics. • Database activity monitoring (network monitor and agent-based) is available as an integrated option. Cautions • NitroView's embedded incident management support is limited. Publication Date: 29 May 2009/ID Number: G00167782 Page 14 of 22 © 2009 Gartner, Inc. and/or its Affiliates. All Rights Reserved.
- 24. Novell Novell's Sentinel software offering is integrated with Novell's IAM solutions, and Novell is actively selling Sentinel as a complementary monitoring and automated remediation technology to its IAM customers. Novell's Compliance Management Platform is an integrated bundle of IAM and SIEM technology. Sentinel is designed for large-scale deployments that require broad and flexible SEM capabilities, but it is complex to deploy and, therefore, is not a good match to Novell's strategy of selling SIEM to its IAM customers. Late in 2008, Novell released the Novell Identity Audit package, which provides basic log management and reporting for Novell's IAM products. At the time of this evaluation, Novell was planning the release of two enhancements: (1) the Sentinel 6.1 Rapid Deployment option — intended to provide simplified deployment and support (2Q09 release); and (2) Sentinel Log Manager — a log management tier for Sentinel (release planned later in 2009). Strengths • Sentinel is most appropriate for large-scale SEM-focused deployments where selective collection and analysis of event data are acceptable. • Sentinel is based on a message bus architecture that provides flexibility and scaling for large deployments. • The Identity Audit solution is well-suited to organizations that use Novell IAM products and need broader audit capabilities. Cautions • Organizations that require log management functions will need to wait for Novell's Sentinel Log Manager release or will need to augment their SEM deployment with third- party log management technology. • While the Sentinel 6.1 Rapid Deployment release is intended to provide simplified deployment and support, it was not generally available at the time we conducted our evaluation, and we had not yet spoken to production references. OpenService OpenService provides event management software that covers system management and security management use cases. The technology is scalable, easy to deploy and differentiated in its approach to correlation. Despite its differentiated technology and some very large referenceable customers, OpenService was slow to adapt to the shift in demand to a compliance focus, and has suffered from ineffective sales and marketing. In 2008, the company received additional funding and has a new management team in place. OpenService's InfoCenter is composed of the InfoCenter console, ThreatCenter (risk-based correlation/analysis), LogCenter (log storage), NerveCenter (availability and performance monitoring) and Event Collectors. Strengths • OpenService is a good choice for organizations that are looking for an out-of-the-box SEM solution with modest server-side resource requirements. • OpenService has improved InfoCenter's reporting and user interface features. • Risk-based correlation evaluates events with respect to threats, vulnerabilities and asset attributes, and is an alternative to rule-based approaches. Publication Date: 29 May 2009/ID Number: G00167782 Page 15 of 22 © 2009 Gartner, Inc. and/or its Affiliates. All Rights Reserved.
- 25. Cautions • Open Service still has limited visibility among Gartner customers in competitive evaluations and must develop broader sales channel partnerships. • OpenService needs to strengthen its direct sales and marketing capabilities. Prism Microsystems Prism Microsystems EventTracker software is targeted primarily at midsize commercial enterprises and government organizations with security and operations event management and compliance reporting requirements. Prism continues to improve the event management and compliance reporting capabilities of EventTracker, and the software now supports scalability through virtualization and through hierarchical or multisite deployment. EventTracker includes specific monitoring support for virtual environments. The EventTracker agent also provides support for file integrity monitoring. Strengths • EventTracker software is suited for midsize businesses that require one product that provides log management, SEM, compliance reporting and operations monitoring. • Prism's EventTracker is easy to deploy and maintain, especially in Windows environments, where EventTracker supports centralized agent deployment and management. • Knowledge Packs provide EventTracker with prebuilt correlation, alerting and reporting for specific compliance regimes or operations requirements. Cautions • EventTracker is not well-suited for implementations that require security operations center capabilities or integration with configuration/asset management databases. • Some Windows vulnerability assessment functions are provided in EventTracker, but the product does not integrate vulnerability assessment data from other vulnerability assessment products. • EventTracker does not have integration capability with IAM products. Q1 Labs Q1 Labs' QRadar appliance line provides a combination of SIEM, log management and NBA. The company is growing rapidly through direct sales to large customers, through the use of channel partners, and by licensing the technology to network and security vendors. While Q1 Labs competes in the overall SIEM market, the company also positions QRadar specifically as a competitive alternative to Cisco MARS, and licenses the technology to some Cisco competitors (such as Juniper Networks and Enterasys). The QRadar technology provides an integrated view of the threat environment using NetFlow and direct network traffic monitoring, in combination with host activity monitoring and reporting from log data. QRadar Simple Log and Information Management (SLIM) is a log management appliance that can be upgraded to full SIEM capabilities. The vendor has actively pursued deployments that require user-oriented monitoring and deployments that are compliance-focused. Publication Date: 29 May 2009/ID Number: G00167782 Page 16 of 22 © 2009 Gartner, Inc. and/or its Affiliates. All Rights Reserved.