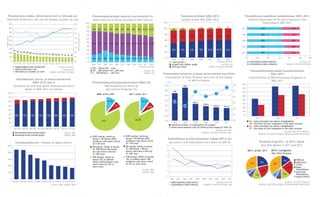
1. Piimatootmine kokku, lehma kohta (tuh t), lehmade arv Piimatoodang karjades vastavalt suurusklassile (%) Toorpiima kvaliteet 2006–2012 Piimatööstuse osatähtsus toidutööstuses 2001–2011
Total Milk Production, per cow (th tonnes), number of cows Milk Production in Herds According to Herd Size (%) Quality of Raw Milk 2006–2012 Relative Importance of the Dairy Industry in the
900 8,0 100% 120% Food Industry 2001-2011
800
90% 1,6% 1,9% 1,1% 1%
7,0 20% 20% 21% 23% 26% 27% 26% 28% 29% 30,4% 33,9% 100% 3% 3% 2011 67% 33%
4%
80%
700
6,0
80% 68% 32%
lehma kohta/per cow
70% 2008
600 45% 43% 42% 42% 36,5% 38,2% 38%
kokku/total
5,0 60%
500 60% 2006 65% 35%
4,0 50%
400 51% 57% 49% 52% 54% 54% 56% 55,2% 55,4% 54,7% 52,4%
40% 40% 2003 72% 28%
3,0
300 56%
211 185 30% 49% 54% 54% 61,2% 60,3% 61%
172 168 159 2,0 20%
200 138 131 129 2001 70% 30%
116 117 117 113 108 103 100 97 96 96 96 20%
100 1,0 0%
10% 19% 23% 30% 25% 20% 19% 18% 16,8% 15,9% 14,9% 13,7% 0% 20% 40% 60% 80% 100% 120%
2006 2007 2008 2009 2010 2011 2012*
0 0,0 0% *prognoos/forecast toidutööstus/food industry
I sort/grade 1 Allikas: ESA
94 95 96 97 96 99 00 01 02 03 04 05 06 07 08 9 10 11 12* 1994 1997 2000 2003 2006 2007 2008 2009 2010 2011 2012* kõrgem sort/higher grade ALLIKAS: ESA piimatööstus/dairy industry Source: Statistics Estonia
kogutoodang/total production *prognoos/forecast *prognoos/forecast eliit sort/elite SOURCE: STATISTICS ESTONIA
601...lehma/601...cows
lehma kohta/per cow ALLIKAS: ESA
lehmade arv/number of cows SOURCE: STATISTICS ESTONIA
101...600 lehma/101...600 cows ALLIKAS: JKK Piimatöötlemisettevõtete kontsentratsioon
1...100 lehma/1...100 cows SOURCE: ARC Piimatoodete tarbimine ja piima isevarustamise tase Eestis 2001–2011
Consumption of Dairy Products and Level of Self-Supply Contcentration of Milk Processing Companies in
Kvoodikasutus (tarne- ja otseturustuskvoot) of Milk in Estonia 2001–2011
2004–2012 (tuh t) Piimatoodang põllumajandustootjate lõikes (%) tuh t %
170 80%
Utilisation of Total Milk Quota (Delivery and Direct Milk Production in Terms of 460 455
167,7 70%
Sales) in 2004–2012 (th tonnes) Agricultural Producers (%) 450
444 164,2 165
800 60%
2009. a/Year 2009 2011. a/Year 2011 162,6
440 50%
700 160,3 160
430 40%
600 1o,5% 1o,3% 155,9 422,7 155
30%
418,6
500 7% 420 152,2 415,7 414,4
6,9% 20%
150
400 410 10%
300 145
85% 93% 93% 93% 92% 88% 90% 94% 400 0%
200 2001 2009 2011
81% 82,8% 390 140
2006 2007 2008 2009 2010 2011
C4 – nelja ettevõtte osa sektori müügikäibest
100
C4 – the share of four companies in the sales revenue
tarbimine (tuhat t)/consumption (th tonnes)
0 C2 – kahe ettevõtte osa sektori müügikäibest
piima isevarustatuse tase (%)/level of self-supply of milk (%)
2004-2005 2005-2006 2006-2007 2007-2008 2008-2009 2009-2010 2010-2011 2011-2012 C2 – the share of two companies in the sales revenue
ALLIKAD: ESA, PõM
ALLIKAD: ESA, EESTI PIIMALIIT
kasutamata kvoot/unused quota ALLIKAS: PRIA SOURCES: STATISTICS ESTONIA, MoA
SOURCES: STATISTICS ESTONIA, ESTONIAN DAIRY ASSOCIATION
kasutatud kvoot/utilised quota SOURCE: ARIB
3093 tootjat, kellel on
4202 tootjat, kellel on
karjas 1-50 lehma/4202 karjas 1-50 lehma/3093 Toidutööstuse ja põllumajanduse osakaal SKP-st (%)
producers who have a herd producers who have a herd Toorpiima turg 2011. ja 2012. aastal
Kvoodiomanike arv / Number of Quota Owners of 1-50 cows of 1-50 cows Agriculture and Food Industry as a Share of GDP (%)
2500 98 tootjat, kellel on karjas 6 Raw Milk Market in 2011 and 2012
98 tootjat, kellel on karjas
51-100 lehma/98 produc- 51-100 lehma / 98 pro-
ers who have a herd of ducers who have a herd of 5 2011. a/Year 2011 2012. a prognoos/
2000 Year 2012 forecast
51-100 cows 51-100 cows
4
209 tootjat, kellel on 198 tootjat, kellel on karjas
1500 karjas 101 ja rohkem 101 ja rohkem lehm/198 TERE AS
producers who have a herd 3 15%
lehma/209 producers who 22% Valio Eesti
have a herd of 101 or of 101 or more cows 31% 36%
1000
E-Piim
more cows 2
22% Maag
ALLIKAS: PRIA Piimatööstus
1 5% 23%
500 SOURCE: ARIB Saaremaa
7% 6% 13% Piimatööstus
14%
0 8,4% teised/others
0 1995 1996 1999 2001 2003 2005 2007 2009 2010 2011
2004-2005 2005-2006 2006-2007 2007-2008 2008-2009 2009-2010 2010-2011 2011-2012 2012-2013 põllumajandus/agriculture ALLIKAD: ESA, PõM ALLIKAD: ESA, EESTI PIIMALIIT
ALLIKAS: PRIA SOURCE: ARIB toidutööstus/food industry SOURCES: STATISTICS ESTONI, MoA SOURCES: STATISTICS ESTONIA, ESTONIAN DAIRY ASSOCIATION
2. Piimatoodete osakaal ekspordis Piimatoodete import (mln eurot) Piimatoodete ekspordi struktuur
Percentage of Dairy Products in Export Import of Dairy Products (mln Euro) Structure of Dairy Product Export
36 60 180
2011
17
2.2 160
50
36 140
2010
17
2.7 40
120
38
2008 17 30 100
2.6
80
37 20
2006 18 60
2.7
10
40
0% 10% 20% 30% 40%
piimatoodete osakaal toiduainete ekspordis %/percentage of 0 20
dairy products in food products export % 1995 1996 1997 1998 1999 2000 2001 2002 2003 2004 2005 2006 2007 2008 2009 2010 2011 2012*
piimatoodete osakaal põllumajandussaaduste ekspordis % *prognoos/forecast 0
percentage of dairy products in agricultural products export % EL-15/EU-15 2003 2004 2005 2006 2007 2008 2009 2010 2011
piimatoodete osakaal töötleva tööstuse ekspordis/percentage EL-12, liitunud aastail 2004–2007/EU-12, admitted in 2004–2007
Venemaa/Russia muud tooted ka hinnanguline eksport /other products
of dairy products in processing industry export % including estmiated export
muud 3-ndad riigid/other third countries
ALLIKAD: ESA, PõM SOURCES: Statistics Estonia, MoA fermenteeritud tooted/fermented products
ALLIKAD: ESA, EESTI PIIMALIIT
SOURCES: STATISTICS ESTONIA, ESTONIAN DAIRY ASSOCIATION
juust ja kohupiim/cheese and cottage cheese
Piimatoodete tarbimine elaniku kohta 2009. aastal piimapulber/powdered milk
lõssipulber/loess powder
Consumption of Dairy Products per resident in 2009 või jm piimarasvad/butter and other milk fats
kg Piimatoodete eksport (mln eurot) kondenseerimata piimatooted/non-condensed dairy products
160
Export of Dairy Products (mln Euro) ALLIKAS: PõM
140
200 SOURCE: MoA
120
180
100 160 Piimatoodete tootmine 2003–2012*, tuh t.
Eesti
80 140 Production of Dairy Products 2003-2012*, th tonnes
60 120
joogi- või/ juust/ kohu- lõssi- piima- Jogurt,
40 100 piim/ but- cheese piim/ pul- pul- hapupiima-
piimatootmine
20 80 drink- ter cot- ber/ ber/ joogid/
ing tage loess pow- Yoghurt,
0 60 milk cheese pow- dered sour milk
Eesti
Iirimaa
Soome
Inglismaa
Rootsi
Ungari
Poola
Leedu
Läti
Taani
Hispaania
Austria
EU-27
Tšehhi
Holland
Prantsusmaa
Saksamaa
Belgia
Itaalia
Slovakkia
Kreeka
40 der milk based drinks
arvudes
20 2003 76,2 9,4 14,1 10,2 11,1 6 28,2
0 2004 73 11,6 12,9 10,4 11,4 8,2 29,8
joogipiim/drinking milk ALLIKAS: RAHVUSVAHELINE 1995 1996 1997 1998 1999 2000 2001 2002 2003 2004 2005 2006 2007 2008 2009 2010 2011 2012*
või/butter PIIMANDUSFÖDERATSIOON *prognoos/forecast
2005 76,5 7,5 15,8 12,3 13 6 33,0
juust/cheese SOURCE: International Dairy Federation EL-15/EU-15 2006 82,8 6,7 18,2 14,6 6,5 5,5 35,2
EL-12, liitunud aastail 2004–2007/EU-12, admitted in
Estonian Dairying
2007 82,7 6,8 16 15,8 3,9 2,1 36,1
Põllumajandussaaduste väliskaubandusbilanss (mln eurot) 2004–2007
Venemaa/Russia ALLIKAS: PõM 2008 81,9 7,3 21,1 14,0 4,8 4,8 39,3
Foreign Trade balance of Agricultural Products (mln Euro) muud 3-ndad riigid/other third countries SOURCE: MoA
2009 88,7 7,7 23 14,1 6,8 4,4 37,5
200
100
Piimatöötlemisettevõtted 2012
2010
2011
94
89,3
6,0
6,5
22
22,8
16
17,8
4,2
4,1
1,5
1,1
42
41,9
in Figures
Milk Processing Companies in 2012
2012* 86,5 4,2 24 17,4 0,8 1,3 42
0
Toorpiima Talumeie- Piimatoodete Paken- Jääti- Tea- *prognoos/forecast Väljaandja: Eesti Piimaliit
-100 töötlevad reid/ väike- valmistajad/ dajad/ sevalm- dusasu- Allikas ESA, Eesti Piimaliit J. Vilmsi 53A, Tallinn 10147, Eesti
ettevõtted/ tootjad/ Makers of Packag- istajad/ tused/ SOURCES: STATISTICS ESTONIA, ESTONIAN DAIRY ASSOCIATION
Companies Farm dair- dairy prod- ers Ice cream Scientif- Tel: +372 600 9234
-200
processing ies/small ucts makers ic insti- Faks: +372 600 9355
-300
raw milk producers tutions tiina.saron@piimaliit.ee
9 (15 töötle- 11 5 1 3 2 www.piimaliit.ee
-400 misüksust)/
1995 1996 1997 1998 1999 2000 2001 2002 2003 2004 2005 2006 2007 2008 2009 2010 2011 2012*
15 process- Publisher: Estonian Dairy Association
*prognoos/forecast
ing units J. Vilmsi 53A
Põllumajandussaadused/agricultural products ALLIKAS: PõM
piimatooted/dairy products SOURCE: MoA Allikas: VTA Source: VFD 10147, Tallinn, Estonia