Learning from the worst behaved icelands financial crisis and nordic comparison mixa sigurjonsson
•
1 gostou•3,939 visualizações

Iceland Nordic Scandinavia comparison financial history crash bubble

Recomendados
Recomendados
Mais conteúdo relacionado
Mais procurados
Mais procurados (20)
Destaque
Semelhante a Learning from the worst behaved icelands financial crisis and nordic comparison mixa sigurjonsson
Semelhante a Learning from the worst behaved icelands financial crisis and nordic comparison mixa sigurjonsson (20)
Mais de Mar Wolfgang Mixa
Mais de Mar Wolfgang Mixa (20)
Learning from the worst behaved icelands financial crisis and nordic comparison mixa sigurjonsson
- 1. Learning from the “Worst Behaved” Iceland‘s Financial Crisis and Nordic Comparison Throstur Olaf Sigurjonsson Mar Wolfgang Mixa Abstract: This paper explores how the financial crisis in 2008 could have been partially avoided by Iceland through observing the warning signs. Iceland experienced the harshest consequences from the financial crisis in the western world such as the total collapse of its banking sector. This paper compares the prelude of Iceland’s financial crisis to the Scandinavian one, less than 20 years ago, providing an understanding of the sources of the crisis and its impact. Results show that signs of overexpansion in Iceland were clear and numerous. Iceland’s structural weaknesses resemble many other badly hit countries, simply more extreme. Keywords: Financial Crisis, Corporate Governance, Iceland, Policy Making, Scandinavian Crisis 1
- 2. Introduction Iceland is a good illustration when drawing lessons from the errors that resulted in the 2008 Global Financial Crisis. No other developed country endured a systemic collapse in its banking sector on the scale that occurred in Iceland, or indeed, rarely in the history of finance. Most of the variables that could go wrong undeniably went wrong, and the collection of these wrong doings systematically assumed mountainous proportions. Whether it was the fiscal policy of the government, the monetary policy of the Central Bank of Iceland, or the financial supervisory, corporate governance and risk management of the banks that were the causes; the situation turned out to be catastrophic. However, individually, these factors are an inadequate explanation. It was the interaction of these factors, which played an important role in the breakdown of the financial system. Consequently, the question of whether or not there were warning signs arises. Comparative research to contextualize the experience Iceland went through provides an understanding of the dynamics that led to the financial and economic collapse in 2008. Hence, this research compares the Scandinavian Crisis of the 1990s to the Icelandic Financial Crisis, focusing on the similarity between the two crisis’ and possible contrasts, illuminating the severity of the current crisis in Iceland. The Scandinavian countries and Iceland (often referred to as the Nordic countries) all bear a resemblance in their economic and societal structure and considering there is less than twenty years occurring between the crises, provide a comparable viewpoint. The Scandinavian countries had to provide their banking sector a considerable amount of public support and their crisis became widespread. However, an underlying question throughout this discussion is what went wrong within the banking institutions and how the changes within the public policy arena (itself being influenced by general social trends) may have contributed to the crisis. 2
- 3. Firstly, this article will examine the main reasons for the sudden and extraordinary growth of the Icelandic banks. Resulting from this growth, the increased vulnerability of the banks and the following collapse is reviewed in part two. Thirdly, the paper compares the Icelandic Crisis and the Scandinavian Crisis, involving the examination of similarities between the two, and the identification of factors that are unique to either banking crisis. Lastly, is a short summary regarding what lessons may be learned from the recent crisis, and what policy recommendations can be derived from the situation. Of special interest is the fact that the Scandinavian Crisis occurred within a banking environment where the separation of investment and commercial banking was mostly still intact. Following the abolishment of the Glass-Steagall Act of 1999, the international banking landscape changed; meaning that banks’ risk appetite increased. That complacency spread to the general public. After the abolishment of the act, it took less than a decade for the international banking system to collapse, the meltdown being worst in Iceland. It also appears that the Scandinavian Crisis was limited to abnormal lending growth, mostly related to mortgage loans, while Icelandic banks lent a great deal to holding companies, often with limited collateral. 1. A Sudden Prosperity Iceland experienced the worst financial collapse of any western country when its banking system fell apart in October 2008. Most of its financial system toppled when its three largest banks, Kaupthing, Landsbanki and Glitnir, with 182 billion USD in assets, were taken into receivership, creating the third largest collapse after Lehman Brothers and Washington Mutual (Bibler, 2010). They had grown from small local commercial banks into international commercial and 3
- 4. investment banks with combined balance sheets amounting to ten times Iceland‘s GDP. International conditions had been optimal, supplying funding at historically low interest rates at a low risk premium (Central Bank of Iceland, 2009). As early as in 1993, when Iceland became one of the founding members of the European Economic Area (EEA) agreement, Icelandic banks obtained the right to operate within the border of the EU countries. At the same time, Iceland instituted the EU regulatory framework for financial institutions and markets. Still, it was not until 2003, when the Icelandic banks were privatized in full, that they capitalized on money market funding, opened branches abroad and acquired foreign financial institutions in large numbers (Sigurjonsson, 2010a). The banks capitalized on the rapid growth that much of Icelandic industry enjoyed during the first years of the 2000’s. These were industries such as pharmaceutical, retailing, real estate, food processing and transportation. The drivers for this growth were similar to the drivers for the financial industry. These were favorable international conditions, a mature domestic market and an essential diversification strategy to decrease risk. The banks took advantage of this development and collaborated with both large and growing firms within these industries. The partnership did not only consist of lending but became, in many instances, joint ventures in which banks invested their own equity in their customer´s projects. That gave later rise to speculation regarding a conflict of interests and dependence on a few large customers, (some of whom were owners of the banks) and all were not necessarily geographically diversified nor diversified by industry (Portes and Baldursson, 2007). The privatization of Icelandic banking was conducted somewhat differently from the process of privatization in many other countries. Most countries privatized their institutions with at least some foreign ownership whereas the Icelandic government initially decided to encourage foreign 4
- 5. ownership, but then backed away from that decision. Instead, individual domestic entities gained controlling interests in the banks. These investors had no prior experience in commercial banking (Sigurjonsson, 2010b). Within three years of privatization, (in 2006), the banks were hit by what was called the Informational Crisis (Portes and Baldursson, 2007). Fitch Ratings and Danske Bank were the strongest critics of the banks mostly focusing on how dependent the Icelandic banks were on wholesale markets for financing and how “short maturity they had on their borrowing“. The criticism was that these conditions would create great vulnerability in the case of financial turmoil and a liquidity crisis. Concerns about potential cross-ownership, earning quality and lack of transparency in the banks’ operation drew criticism as well (Central Bank of Iceland, 2006a; Valgreen, 2006). When cross-ownership in Iceland was scrutinized, the lack of transparency was evident and corporate governance within the banks became a real issue. The root of these issues can be traced to the time when the banks began their growth period. In a small and fast growing economy, ownership was more entwined than in a larger economy. The young Icelandic financial industry promoted executives mostly aged in their late twenties or thirties. The banks went from public to private with considerable stock options for executive level managers. A completely new compensation policy was implemented, encompassing an aggressive investment banking style incentive system. This led to excessive risk taking. The criticism led to a depreciation of 25% in the ISK, and to a similar drop of the ICEX (the Icelandic Stock Exchange Index) during the early part of spring 2006. The banks had, until then, relied on wholesale market financing with short maturities. Their income stream was vulnerable, 5
- 6. with 50% of total income as none core income. The banks had no choice but to alter their strategies (Sigurjonsson, 2010a). With an already dominant share in the domestic market, they sought vast growth through their subsidiaries and branches abroad, where they managed to raise customer deposits, especially through Internet accounts. The banks were successful in this strategy and managed to raise the total deposit/asset ratio to similar levels that other Nordic banks enjoyed. Growth continued at extraordinary levels as indicated by asset multiples of 8 to 12 during 2003-2007 (annual reports of the banks 2003- 2007). Within 18 months, Landsbanki and Kaupthing managed to collect over £4.8 billion in the UK and €2.9 billion in the Netherlands through their Icesave and Edge Internet deposit accounts. The goal was to create a broader income base and distribute risk, intended to soften any setbacks that the Icelandic economy might suffer (Jannari, 2009). On the other hand, large shifts in the value of the foreign assets and liabilities of the banks created problems of how to insulate the domestic economy, which depended on the regular production flow of goods and services. The Icelandic banks, over a period of a few years, had leveraged their capital base to buy up banking assets worth several times Iceland‘s GDP (Sigurjonsson, 2010b)and the potential depreciation of assets made the leveraged banking sector highly vulnerable. There was thus little leeway for declining assets values, mostly purchased during the years of the banking and credit boom period of 2003-2007, in preventing the banks’ equity to dry up. Neither the National Treasury nor the Central Bank of Iceland had the necessary foreign reserves to support any of the larger banks. A lender of last resort in foreign currency, therefore, did not exist in Iceland’s post-privatization era. 2. The End of Prosperity 6
- 7. The Icelandic financial industry was gradually de-regulated prior to the privatization of the banks. At the time of the privatization, a laissez-faire policy of the Icelandic government fostered a period of optimism and risk taking on behalf of the business community. With ample credit, business opportunities were there for the taking. Asset prices appreciated in an era of easy access to cheap capital. The belief in further appreciation encouraged people to purchase assets, regardless of revenue stream. With equity appreciating further and with assets booked at market value, continued borrowing was justified, eventually creating asset bubbles. Most of the Western world experienced a similar environment of low interest rate policies for some years, with the negative effects of such policies only surfacing in 2007 (Kirkpatrick, 2009). In 2007, liquidity difficulties accumulated with mounting revelations of severe flaws in the US housing credit market. Trust within financial markets diminished and the trouble only accelerated in 2008. Less liquidity in asset markets made financing through bond markets yet more difficult. Central banks had to interfere and provide liquidity, among which was the Central Bank of Iceland. The Icelandic banks had been successful with their Internet deposit accounts abroad where they decreased their “loan/deposit ratio“ from 3.2 in 2005 to 2.0 in 2007 (Carey, 2009). At the time the largest bank in Europe, HSBC, had its ratio as 0.84 to 1.00. However, this initiative of the Icelandic banks provided merely temporarily relief. The fact that Landsbanki gained a larger market share in the UK than the largest Internet deposit bank internationally, ING Direct, should have been a clue that the deposit growth was vulnerable; such depositors were probably inclined following whatever Internet bank provided the highest interest rates at any given time. The Icelandic banks became a gauge of the negative effects to come. Their assets became extremely vulnerable and when creditors began believing that other creditors would refuse to roll 7
- 8. over present loans and extend new credit and the banks lost credibility. This is a classic situation that leads to the failure of banks. The fall of Lehman Brothers in September 2008 did not have a great direct influence on the Icelandic banks but its indirect influence was catastrophic. The bankruptcy of Lehman Brothers demonstrated that a large financial firm could go bankrupt without the state rescuing it. International money markets froze completely, interbank markets became inactive, liquid resources vanished and assets became untradeable. This was the point of no return for the Icelandic banks. A bank run began, not on a single Icelandic bank, but the complete Icelandic financial system (some international foreign exchange dealers informed their Icelandic counterparts that their banks had ceased lending to Iceland). When short run funding evaporated, margin calls came from the European Central Bank. Glitnir bank was the first to search for a lifeline at the Icelandic Central Bank, which refused to help, and the bank was taken over by the government the next day, October 6th. Landsbanki, which could not meet its obligations, went into receivership. On October 7th Kaupthing appeared to be still viable and had received an 80 billion ISK loan from the government on October 6th. The UK authorities had a substantial role in the events that followed. Landsbanki, with its UK branch, collected 1,200 billion ISK through its Icesave deposit accounts. By operating a branch, but not a subsidiary, the bank had transferred the liability to the Icelandic state. Comments from the Central Bank of Iceland stating that the Icelandic state would not be able to meet these obligations led to an immediate reaction by the UK authorities, applying anti-terrorist laws to seize the UK assets of the Icelandic banks. Kaupthing‘s operation in the UK was ruined as covenants on loan agreements were activated, and Kaupthing was put into receivership on October 9th. 8
- 9. Interestingly, all of the Icelandic banks had passed stress tests only a few weeks earlier by the Financial Supervisory Authority (FSA) (FSA, 2008), but unfortunately these stress tests did not account for vulnerability to a liquidity nor currency crisis1. While the banks’ assets grew ten times, the staff of the FSA only grew from 27 to 45 employees (FSA, 2009). Additionally, promising lawyers and economists at the FSA were swiftly ‘bought’ by the banks, maintaining an imbalance of corporate knowledge and skills in favor of the banks. The FSA became thus increasingly weaker, causing limited control of the banks’ growth, with aggressive incentive systems that encouraged excessive risk taking. Since there was not a regulatory framework preventing Icelandic banks from opening branches (rather than subsidiaries) abroad, the ultimate liability was transferred to the Icelandic public. 3. Comparison of Crises A study by Reinhart and Rogoff (2008) identified 18 financial crises from WWII until 2007 when the subprime crash unfolded. Among the five “Big Ones” are the crises in Norway, Sweden and Finland at the beginning of the 1990s. They conclude that the crises followed a similar pattern although the tipping point in each case seems to differ. The crises usually follow a pattern in which regulation changes lead to some sort of increase in lending (Easy Money) that develops into an asset bubble. When such bubbles burst, especially related to real estate, asset prices tumble with the consequence of mass bankruptcies. Losses related to write-offs and asset depreciation causes a banking crisis that, along with a currency crisis, exacerbates losses, 1 Kamallakharan & Tómasson (2009) describe why the test proved to be worthless, stating that the test assumed no more than a 20% fluctuation in the Icelandic Krona when in reality its worth against the currency basket fell more than 50% in a matter of weeks during the fall of 2008. 9
- 10. especially in circumstances where loans financed during the bubble were denominated in foreign currencies. The consequence is a contraction in loans to companies that are still in business, adding further pressure on a systematic collapse and necessary governmental interference to assist the financial system (Englund, 1999). This paper focuses on the crises in Sweden and Finland. These crises had similar characteristics within the same timeframe, and are often called “twin crises”, while the crisis in Norway was somewhat different, regarding both time and external developments (Jonung, 2008). However, the figures used here still include Norway, in order to provide a fuller picture. Adding Iceland to that equation, with its uncanny similarities, draws forth the possibility of ”triplet crises”, the main difference being that Iceland experienced its boom and bust just under two decades later. Even those who believe that the deregulation process itself did not cause the crisis usually attribute the beginning to the Scandinavian Crisis to the deregulation process that occurred at the start of the 1980s. The processes of deregulation differed somewhat between countries, but the start and end points were similar (Englund, Vihriala, 2003). The main characteristics of this deregulation were the liberation of interest rates and the free flow of capital in international markets, importantly including financing (Jonung, Kiander, Vartia, 2008). The new financial landscape was mostly unnoticed by regulators in Sweden where the laws remained largely unchanged following the rapid development and in addition, changes to the tax system resulted in incentives for households and corporations to increase lending (Honkapohja, 2009). Whilst the deregulation process took less than a decade in Scandinavia from start to finish, with the indirect effects in increased lending taking three to four years to materialize, the period in 10
- 11. Iceland was much longer, as seen in Table 1. It can be inferred that the Icelandic period was around 25 years, making comparison somewhat difficult. Table 1. Financial Evolution in Iceland Event Year Financial Indexation permitted 1979 Liberalization of domestic bank rates 1984-1986 Iceland Stock Exchange established 1985 Interest Rate Act: Interest rates fully liberalized 1987 Stepwise liberalization of capital movement begins 1990 Treasury overdraft facility in the Central Bank closed 1992-1993 New foreign exchange regulations marks the beginning of the 1992 liberalization of cross-boarder capital movements Privatization process launched 1992 Interbank market for foreign exchange established 1993 Iceland becomes a founding member of the EEA 1994 Long term capital movements fully liberalized 1994 Short term capital movements fully liberalized 1995 Foreign direct investment liberalized in accordance with EEA 1995 agreement Privatization process of the Icelandic banks begins 1998 Interbank money market 1998 Interbank FX swap market 2001 Privatization of state owned banks completed 2003 Source: Central Bank of Iceland, 2006b and authors’ addition. 11
- 12. The main years of deregulation were 1982 to 1986 for Scandinavia but for Iceland it was 1984 to 2003. However, the lending growth period was immediate in Scandinavia from 1986 to 1990; while in Iceland such growth started during the latter part of the 1990s but the explosive growth, leading to the bust, began after 2003. Nevertheless, the seeds of growth were planted once the interbank lending started in 1998, which quickly spread to add fluidity in currency market dealings. The starting point for the comparison period may appear being subjective. We look at the start of the deregulation process as a starting point in Scandinavia, i.e. in 1982. In Iceland, the deregulation process began during a similar period, but took longer and the effects were for a long time barely visible. Therefore we use 1999 as the starting point in Iceland, which is four years prior to the beginning of the lending boom (which is the same as the Scandinavians starting point), but also an approximation of when deregulation began in reality to change the Icelandic financial landscape. At that time, the privatization processes in two of the three Icelandic state owned banks had just begun and rapid changes were implemented soon after. Using the above assumptions, we use the year 1982 as the starting point for Scandinavia in this paper and 17 years later for Iceland. Thus, we define year 1999 as Period 1 or T for Iceland and 1982 or T minus 17 for Scandinavia. The length of periods differs somewhat, mainly because some data is no longer available after the Icelandic banks went into default. Lending Growth Following the deregulation process, the banks in Scandinavia decreased their emphasis on services and cost structure, and instead began to concentrate on pricing and added market share. This resulted in additional risk taking (Honkapohja, 2009) and loans to new markets followed. 12
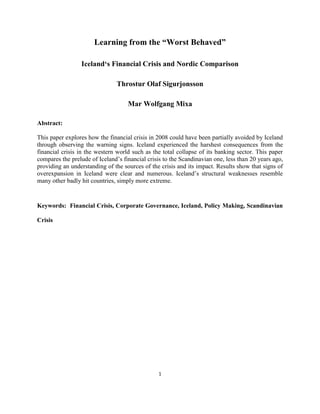
- 13. However, financial institutions were working in a new environment where their ability to measure risk adequately became more difficult (Berg, 1998). Initially the lending increase caused no alarm. After a long period of lending restriction, in which real rates were negative and thus there was some sort of privilege associated with receiving loans, a higher lending equilibrium was to be expected. Added demand for money caused interest rates to rise, leading to an increased rate difference between domestic rates and international rates. This made borrowing in foreign denominated currency even more tempting within the environment of free capital flow, making interest rate policies in Scandinavia increasingly toothless (Honkapohja, 2009). Due to the pegging of domestic currencies to the German Mark, domestic loan takers perceived the likelihood of currency losses to be minimal. Berg (1998) maintains that without the foreign capital inflow the increased lending growth would have been impossible. The privatization process of the banks began in Iceland 1997 with the aim of establishing a widely distributed ownership structure. The policy change in 2002, with the controlling interest in two of the three main banks falling into the hands of investor groups with little banking experience, set the stage for the banks’ transformation in which lending growth exploded in Iceland. As in Scandinavia a few years earlier, the Icelandic banks (with savings banks following suit) began to concentrate on market share and pricing with added risk associated to their business model. The true explosive lending growth period thus began in 2003 in Iceland, 17 years after the same development in Scandinavia. A comparison of lending growth in Iceland and Scandinavia is shown in Figure 1. Since two different periods are compared, the starting point is defined as being T or Period 1, representing 13
- 14. 1999 for Iceland and T minus 17 (or 1982) for Scandinavia, in line with the assumptions previously explained. Figure 1. Lending Growth Comparison – Iceland vs. Scandinavia2. 70 Iceland 1999-2007 Scandinavia 1982-1990 60 50 40 % 30 20 10 0 1 2 3 4 5 6 7 8 9 Finland Norway Sweden Iceland Sources: Central Bank of Iceland, 2009a. It is worthwhile pointing out that lending growth remained very high following the Informational Crisis in 2006, dipping a little the following year but was still higher than the other comparison periods in all comparison countries. Lending growth was actually in a similar range in Iceland in the early part of the comparison period, as it was in the latter one in Scandinavia. The later part of the comparison period shows that lending growth in Iceland was approximately double compared to Scandinavia, only with a short period in Finland being the exception. 2 Lending growth information is available for the first nine months of 2008. Nominal growth that year is almost 60%. The authors, however, assume that the depreciation of the Icelandic Krona, which during that period was approximately the same percentage as the nominal growth, is largely responsible for the increase (by that point ¾ of lending was denominated in foreign currency) in additional to inflation. 14
- 15. It was, however, not only the increased lending to households and companies that caused this increase. Icelandic banks evolved quickly from being traditional commercial banks into becoming investment banks who took positions in their commercial customers’ projects. Jannari (2009) explains this by stating that the majority holders who gained control in 2002-2003 had a mindset more like investment bankers rather than commercial bankers. Incentive systems were enacted in line with common features abroad where short term profits were paramount. This created an atmosphere in which the main objective was getting a deal done, as percentages employees received of loans provided could be around 0.3% to 0.4% in the form of bonuses. Those bonuses were given regardless of long-term consequences and inherent risks associated with the deals. In fact, as McLean and Elkind (2003) described the situation with Enron a few years earlier, an incentive scheme evolved in which it became advantageous to minimize the potential risk associated with deals taking place in order to make sure that they were completed and thus commissions paid. Once the contraction in lending growth subsided in the comparison periods, about 3 to 4 years after the common starting point (T and T-17), lending growth became much higher in Iceland compared to Scandinavia. Another, and maybe a more descriptive, way to look at this is viewing the cumulative increase as shown in Figure 2, representing the Icelandic lending growth compared to the “irrational” one in Scandinavia during the late 1980s. 15
- 16. Figure 2. Cumulative Lending Growth Comparison – Iceland vs. Scandinavia. 15 Iceland 1999-2007 Cumulative growth with 1 as a Scandinavia 1982-1990 base at period 1 10 5 0 1 2 3 4 5 6 7 8 9 Finland Norway Sweden Iceland Sources: Central Bank of Iceland, 2009a. The cumulative growth was already much more than it had been in the comparison countries when the Informational Crisis hit in 2006. The enormous continued growth shows how much more the expansion of the Icelandic banking system was compared to the Scandinavian countries during the 1980s. This growth corresponds with the growth of Icelandic banks’ balance sheets, which combined were just under the size of the country’s 1999 GDP, but are estimated at being ten times larger than Iceland´s GDP in 2008 (Central Bank of Iceland, 2009). One explanation of why the negative effects of deregulation filtered down so late into the Icelandic financial system is that the government retained its controlling stake in the banking system whilst the changes were taking effect. Thus, despite the free flow of capital, there were implicit restrictions on lending growth. That is not to say that lending growth was non-existent during those years (as Figure 2 demonstrates); but during that period it was understandable due to the easing of lending restrictions leading to a natural higher lending equilibrium. 16
- 17. Information surfacing after the crash (for example, the leaked loan book of Kaupthing Bank) indicates that the loans were not merely ill considered but were even questionable from legal and ethical standpoints. The collateral for loans were in an abnormally low percentage range or even simply only the equity bought. This raises the question why Icelandic banks did not simply buy the equity themselves and thus reap all the benefits themselves if they turned out to be successful. In some instances, such loans were used to finance purchases of the bank’s own shares, so in effect banks were lending money to buy shares in themselves, with those shares being the only collateral. During the writing of this paper investigations are under way regarding market manipulation due to such loans, with banks accused of lending money in the attempt of keeping their share prices artificially high. As with Japan in the late 1980s, where loans were increasingly made to holding companies with the main purpose of investing in other companies (Chancellor, 1999), loans by Icelandic banks were often related to cross-ownership or other relations between parties in which dubious collateral was placed (Jannari, 2009). This was not a concern in Scandinavia (Jonung, 2008). Figure 3 shows the nominal increase in total lending Icelandic holding companies scaled to April 2005, compared to the growth in lending to domestic households, many of whose sole purpose was investing in equities of other companies (Jannari, 2009). 17
- 18. Figure 3. Lending Growth to Icelandic Holding Companies and Households. 7 6 Cumulative growth with 1 as a base from April 2005 5 4 3 2 1 0 Jan-06 Jan-07 Jan-08 Jul-05 Jul-06 Jul-07 Jul-08 Apr-05 Apr-08 Apr-06 Apr-07 Oct-05 Oct-06 Oct-07 Holding Companies Households Source: Central Bank of Iceland (2009a). Despite the frenzied increase in lending to households, it pales compared to the increase in lending to holding companies. Often with little (if any) collateral on the table, the owners of the holding companies stood a chance of striking it rich if they were successful in their investments, it appears that stockholders, bondholders and taxpayers may have to pick up a sizeable amount of the tab if unsuccessful. Unemployment, GDP and (asset) Inflation Unemployment in Scandinavia was generally low during the 1980s (see Figure 4). In Finland, it gradually decreased during the later part of the decade. In Sweden, unemployment never went above 4% and for a period during that period was below 2%. A common government policy in the region was maintaining full employment (Jonung, Kiander, Vartia, 2008). 18
- 19. Figure 4. Unemployment % Comparison – Iceland vs. Scandinavia. 14 Iceland 1999-2009 12 Scandinavia 1982-1992 10 8 % 6 4 2 0 1 2 3 4 5 6 7 8 9 10 11 Finland Norway Sweden Iceland Source: IMF (statistical analysis, 2009). As with the Scandinavian countries during the 1980s, Iceland experienced almost non- unemployment, which is partially explained by major construction projects. Thus, the expansion in loans in both comparison periods created an illusion of a stable and healthy economy, only turning out to being an obvious mirage when unemployment skyrocketed following the bust. Information from the IMF shows that unemployment in Finland reached 17% for a short period during the ensuing bust; that figure in Iceland, at the time of writing, hovers around 8% (Directorate of Labour in Iceland, 2010). All the countries showed a stable increase in GDP during the period, especially Iceland that had a mean annual growth of 4%. This is in contrast to the 2-2.5% mean annual growth in the comparison countries within the decade actually being 6% annually during the boom years 2003- 2007 (see Figure 5). 19
- 20. Figure 5. Real GDP Growth Comparison – Iceland vs. Scandinavia. 9 Iceland 1999-2007 8 Scandinavia 1982-1990 7 6 % growth 5 4 3 2 1 0 -1 1 2 3 4 5 6 7 8 9 Finland Norway Sweden Iceland Source: IMF, 2009. What is probably most striking is the extraordinary high GDP growth in Iceland once the boom period took hold. Monetary issues were not the only cause. The government implemented enormous power plant projects that totaled 10.5% to 12% of GDP in 2005 and 2006 (Central Bank of Iceland, 2009). During the same period municipalities engaged in various projects keeping demand for labor high. The comparison of inflation as seen in Figure 6 shows that it remained relatively mild in Iceland during the boom years. That does not mean that it did not exist, the Central Bank’s goal of keeping inflation at or below 2.5% was seldom reached. Inflation was, in a sense, partially hidden due to the strength of the ISK, making imports cheaper than otherwise. Domestic factors were thus mostly instrumental in causing added inflation. 20
- 21. Figure 6. Inflation % (end of period) Comparison – Iceland vs. Scandinavia. 20 Iceland 1999-2007 18 Scandinavia 1980-1990 16 14 % inflation 12 10 8 6 4 2 0 1 2 3 4 5 6 7 8 9 10 Finland Norway Sweden Iceland Source: IMF, 2009. When the ISK tumbled following the financial meltdown, inflation shot up. Its strength had held back inflation for many years but when that development reversed inflation quickly spiked, as seen in Figure 6, since importers had little choice but to hand the added expense partially to the customers. Adding insult to injury, many Icelandic companies had, on the surface, operated in a stable and profitable manner, by merely looking at the net income numbers. No study has been done yet in this particular field, as far as the authors are aware, but by scanning a few annual reports, it shows that by comparing EBITDA numbers to net loans and fixed assets, under normal circumstances companies were losing money on their operations. However, by having a huge amount of their loans denominated in foreign currencies, interest costs were little, with artificially low interest rates and an increasingly strong ISK. Once the ISK depreciated, the strengthening reversed and exposed the ‘hidden’ risk via currency fluctuations in financing, leading to many companies’ equity disappearing almost overnight. 21
- 22. The monetary policies in Iceland and Scandinavia during the boom periods have been criticized for different reasons. Many academics have questioned the pegging of the currencies to the German Mark (Jonung, 2008; Honkapohja & Koskela, 2000; Englund, 1999). Although those thoughts are inconclusive, most argue that a floating currency would have resulted in a ‘corrective’ currency adjusting to interest rate spreads. Judging from Iceland’s recent experience, those arguments appear to be falling flat. At the beginning of the decade, the ISK was floated with the aim of keeping inflation below 2.5%, which was the Central Bank’s main interest rate objective. This policy proved to be futile, as Figure 8 demonstrates, as was the pegging in Scandinavia during the comparison period, within an environment of free flowing capital. While pegging created an imbalance too great between currencies, the floating ISK with the Central Bank policy of increasingly higher interest rates led to an inflow of capital that strengthened the ISK. Like the Scandinavians during the late 1980s, Icelanders (both households and municipalities) began taking foreign loans in large amounts. The rationale for many people was that historically such loans had provided more advantageous interest rates and, maybe more importantly, the ISK showed no signs of weakening (this is a case of the short term memory the public has of financial markets, the ISK had weakened considerably 2001, and this seemed already to be a distant memory). The consequences proved to be dire. Icelanders not only took foreign loans because of their belief in its continued strength but also, paradoxically, used much of that money to buy foreign goods, which had become so cheap because of the strong ISK. Jannari (2009) maintains that this eventually resulted in the high interest rate policy of the Central Bank not only being toothless, but in reality with the free flow of capital adding to the inflationary pressure. A lesson to be 22
- 23. drawn is that monetary policies alone do not suffice within such circumstances, fiscal policies with the same aim are necessary. Therefore, measuring asset inflation during this period is difficult. The underlying factors that were taking place did not necessary show up in normal studies. A simple approach is looking at the nominal inflation price of real estate, which takes inflation, underlying inflation to some extent, and the level of risk appetite into account. It also measures the consequences of access to money, or M1. The case in point is Scandinavia during the 1980s. Englund (1999) points out that while deregulation may have opened the door to asset inflation, it was not until the Loan-To- Value (LTV) ratio went from 75% to 90% in 1988, and 3 years after deregulation had firmly taken place that real estate values went up 35% within a short amount of time. Until that, real estate prices remained stable and even lowered during much of the decade (Berg, 1998). Furthermore, Englund asserts that a higher LTV ratio is, in a sense, a measure of risk appetite, which plummeted following the bust and the LTV ratio quickly fell again. The ratio thus increased when there was no need for it, but decreased when liquidity problems surfaced. The Swedes surely were aware of this, therefore the lesson simply was that a 90% LTV ratio is too high, even during bust periods. This development was even more extreme in Iceland. The government decided to raise the LTV ratio in a few steps from 65% to 90%. People began to take advantage of this by taking mortgage loans that were partially government sponsored in an indirect way and using the money, not only for household purposes, but also to increase spending and paying down overdraft loans. The banks responded by lowering interest rates even more and in the spirit of gaining market share 23
- 24. one bank began offering 100% LTV loans3. The fierce competition led to a negative interest rate spread. One of the major savings banks, for example, financed itself via long-term bonds paying 4.90% to 5.20% interest but lent its customers at the same time money to finance real estate at 4.15%. (NASDAQ OMX Nordic (2009). Figure 7. Real Estate Nominal Price Inflation Comparison (index set at 100 as starting point) 350 Iceland 1999-2009 Scandinavia 1980-1990 300 250 Index 200 150 100 1 2 3 4 5 6 7 8 9 10 11 Finland Norway Sweden Iceland Sources: Berg (1998) and Icelandic Property Registry (2009). Figure 7 shows that the paths of Iceland and Finland, during the comparison period, were for many years almost identical. However, prices kept on increasing in Iceland, and judging from the Scandinavian experience will decrease to about half of their value from their peak prices. This prediction is not impossible. Various home builders joked during the boom period that there was a 20/50 aim on new buildings, i.e. put 20 million in building an apartment and selling it for 50 million. As Englund and Berg point out, prices in Sweden were stable for most of the period but as the LTV ratio was raised, prices shot up only to fall again concurrent with the lowering of the LTV ratio. 3 http://www.sa.is/files/Sp%E1l%-EDkan%20um%20%EDb%FA%F0afj%E1rfestingar_1723061657.pdf 24
- 25. The above factors demonstrate not only an overheating of the economy, but indicate how the general population perceived the economy, i.e. added optimism leads to added consumerism. Therefore a vicious cycle forms, in which the main driver of economic growth is consumption (of various forms) financed by loans. In a sense, the current lifestyle is funded by sacrificing the future, although that is usually not the general perception at such a given point. Carey (2009) for example points out that the savings ratio of Iceland was negative during the boom years, 2003 to 2007. As previously mentioned, the high interest rate policy of the Central Bank may have increased underlying inflation, being expansionary in a sense. However, the monetary policy regarding Easy Money was clearly accommodating; broad based monetary aggregates such as M1 grew above 20% or more every year from 2002 until the crash (Bagus & Howden, 2009). As Woods Jr. (2009) explains, prices can only increase simultaneously (apart from decreasing supply of all goods) by increasing the amount of money in the economy. Hence, despite a high interest rate climate, the Austrian School of thought maintains that monetary policy in tandem with fiscal policy was adding oil to fire as opposed to reigning in inflation. Money was thus being flooded into society that invested it into long-term projects, such as houses, but put the Icelandic nation on a short lease, as recent events underline. Berg (1998) asserts that the Scandinavian banks would have not been able to increase their lending growth without access to foreign capital. This was the case in Iceland also, where people with loans in foreign currencies had enjoyed favorable interest rates for years and even had their underlying debts decrease in value due to the strength of the ISK. This is further amplified when people see others making money by speculative trading (not limited to the stock market but even 25
- 26. to a larger degree housing loans in foreign denominated currencies), adding a tendency to follow the crowd. Kindleberger (1996) described this as “Monkey see, monkey do”. Thus, by adding insult to injury, in the expansionary climate Icelanders began increasing their appetite for foreign loans considerably as the boom period continued. Such loans increased a great deal in 2006 and at the start of 2008 represented 14% of household debt (Carey, 2009). During the fall of 2007, banks were beginning to shut down foreign denominated loans. The increase, measured in ISK, is after that point mainly due to the weakening of the ISK. On paper, such loans were as safe for banks as the loans were denominated in the domestic currency. Currency contracts were generally hedged but could only been done so to a certain extent, with fluctuations being assumed to stay within certain parameters. Such hedges proved of limited use due to the discrepancy of the length of maturities between financing and loans provided. When the ISK plummeted in value, the hedging only provided support for the short term. Long-term contracts were ‘naked’ against such fluctuations. Carey (2009) also points out that although banks theoretically had adequate hedges against such fluctuations, their customers did not. Implying that while banks appeared to be safe, their customers simply could not pay back the loans under such different circumstances, therefore, write-downs became inevitable. A recent report by the Institute of Economic Affairs maintains that the root of the collapse for many US banks partially lies in the fact that the government encouraged banks to increase mortgage loans to income groups with less money (Schwartz, 2009). In Iceland, where a tradition of equality is rooted within society, such a development occurred to a higher degree with the increase of the LTV ratio. Thus governmental policies contributed to this in both countries, and even internationally, in creating the real estate asset bubble via the Easy Money 26
- 27. policy. A lesson from this experience is that governmental controls must be in place during deregulation and Easy Money policy periods. Such controls are paramount in keeping lending growth within reasonable levels and they need not be an infringement on the free market. If banks were to lend recklessly without government guarantees, knowledgeable depositors and financers would take notice and withdraw their money, but lesser educated people might not, therefore leaving trust in the system at the mercy of speculators disguised as bankers. A simple restriction of LTV ratios and foreign denominated loans would be the most effective strategy. Without such simple measures, another crisis due to the same underlying factors would soon occur, only in a different form. 4. Conclusion The similarity of the two comparison periods (T & T-17) is remarkable. Despite the Scandinavian crisis being defined as one of the five “Big Ones” by Rogoff and Reinhart, Iceland shows, by a wide margin, more significant signs of over-expansion in practically all aspects. An obvious question is how Iceland came to be a victim of such a similar euphoria so shortly after a similar crisis by their neighbours. Monetary issues are not the sole explanation. Galbraith (1997) maintains that credit has on numerous occasions (for instance both before and after the “Roaring Twenties”) been easy without causing speculation. As with deregulation, easy money by itself does not cause unsound speculation leading to disaster. Galbraith states that the mood is far more important than the rate of interest, some sort of conviction that ordinary people should be rich. The answer is in short provided by Reinhart and Rogoff (2009). Icelanders, in line with a common syndrome associated with financial crises, thought that they were smarter and had 27
- 28. learned from past mistakes; such crises only happened to other people during other times. The reality was that not only had Icelanders not learned from past mistakes, but there are vast indications that past mistakes were visible both qualitatively and quantitatively. Striking similarities are also to be found in recent examples in Argentina a decade ago, Asia during the 1990s, and even the “Roaring Twenties” in the US (Mixa, 2009). Iceland imitated all the main features of Scandinavia such as deregulation, a real estate boom, huge lending increase and an increased amount of foreign capital flow. As the increase of lending to holding companies shows, lending growth was not only more prevalent in Iceland but had an added category where risk taking among insiders took constantly a bigger share of the lending pie. Such added risk appetite was also prevalent in banks’ increased exposure in direct ownership of companies. 4.1 Firm Level Business practices in Iceland became questionable and of such a scale that they ultimately facilitated the collapse of the Icelandic economy. The close-knit society, partially created by managerial relationships, cross-ownership and cross lending, established imbalances in favor of business over regulatory authority. This consequence was an extensive collapse, where if one link in the chain was to fail a domino effect throughout the entire economy was created. As pointed out in this paper, this was not a problem in the other Nordic countries (Jonung, 2008). The foreign criticism from financial institutions, rating agencies and foreign media in 2006 did not manage to influence the general discussion in the Icelandic media in such a way that the international expansion of the Icelandic banks was scaled down. On the contrary, the growth only escalated. In a country where nearly all the newspapers and business magazines are in ownership 28
- 29. indirectly or directly by the banks themselves through their largest shareholders, attempts to criticize become negatively addressed and extinguished (Vaiman, Sigurjonsson and Davidsson, 2010). One possible reason why things got so out of control in Iceland is that the Icelandic banks operated as if they were investment banks. In the shadow of the Great Depression, the Glass- Steagall Act was enacted in 1933, separating commercial banking and investment banking. During the Scandinavian crisis, those walls still held. They were, however, abolished 1999 and it was within that landscape that the Icelandic banks grew so quickly. It took the international banking system less than a decade to collapse after investment banking became again part of the general banking system. Icelandic banks, expanding partially because they had some sort of governmental guarantee, were the worst culprits and, as such, suffered the worst consequences. This questions how systematic the crash was in reality, whether the similarity of the buildup created the circumstance in which all of the banks stood a chance of failing within parameters of certain negative events, with or without domino effects. It can thus be argued that this experiment of abolishing the Glass-Steagall Act was an expensive one (Mixa, 2009), with Iceland suffering the highest cost. This also raises the question why such separation has not been re- enacted. 4.2 Macro Level The recent experience in Iceland and the experience in Scandinavia two decades ago suggest that fiscal and monetary policies must involve consistent goals. Interest rate tools within an environment of free flow of capital were used in both instances, in Iceland with the aim of keeping inflation at bay with a floating currency whilst the Scandinavian countries aimed at 29
- 30. stabilizing the economy by pegging their currencies. History shows that both these courses become toothless once speculation within an environment of rising asset inflation. The real rate of interest was disguised with foreign denominated loans freely available. During the prelude to the crash of 1929, the rate of interest of some margin loans for stock purchases went to 40-50% with added collateral required (Rappoport & White, 1994) without dampening the amount of speculation since the stock market had become a cornerstone in a sociological sense (Galbraith, 1997). While the Central Bank of Iceland raised interest rates to keep the economy´s growth under control, the government increased to ceiling of LTV for housing purchases, lowered taxes and kept an expansionary policy in the tight labor market. The signals given by the Central Bank via higher interest rates and expansionary policy by the government and its subsidiaries raises the question what sort of policy was in place and partly answers the question why nobody warned against the build up of foreign loans. 4.3 Policy Level Much discussion has revolved around the effects of added deregulation in Scandinavia. Englund (1999) maintains that such a view simplifies reality. Demirgüç-Kunt and Detragiache (1998) find that a financial crisis occurs more likely in an unregulated environment, especially where a lack of respect is for the rule of law and corruption is widely spread. They find, however, no correlation between financial crises and changes from a regulated environment to a lesser regulated one. Englund (1999) concludes that what counts is a balanced macro environment in keeping the financial system stable within a deregulated environment. 30
- 31. Claiming that deregulation was the root of the financial collapse in Iceland is a simplification. Deregulation in neither Iceland nor Scandinavia was the cause of excessive lending. However, once the monetary and fiscal policy got out of hand, creating a destabilized economy, the doors that deregulation had unlocked were opened. The main impetus at first was real estate loans, leading to higher real estate values in tandem with increased risk in lending. In Iceland the privatization of the state-owned banks accelerated, where size was clearly all that mattered, and with risk taking becoming much more via holding companies within a historically low interest rate environment. Banking is among the structural factors within societies today, just as schools, electricity and transportation to name a few. Regulation issues within banking are thus of vital importance for the public. Regulations – detailed or general – are not a substitute for proper business practices within banks (Gregg, 2009). Authorities must ensure that not only are such practices within the banks in line with general good practices, but also the interaction of banks and regulatory institutions and stakeholders. It may appear clichéd, but prudent banking is needed to create trust, and banking is built on that basis. Trust in the banking system is deservedly lacking in the banking system and needs to be re-built. A lesson from what went wrong in Iceland is a good starting point. 31
- 32. References Bagus, P., & Howden, J. D. (2009). Iceland’s banking crisis: The meltdown of an interventionist financial system. Retrieved June 11, 2009, from Ludwig von Mises Institute website: http://mises.org./story/3499 Berg, S. (1998). Bank failures in Scandinavia. In J. E. Hughes & S. B. MacDonald (Eds.), International banking: Text and cases, (pp. 198-207). Pearson Education Asia Limited and Tsinghua University Press. Bibler, J. (2010). Hversu mikið var fall íslensku bankanna á heimsmælikvarða? [How extensive was the fall of the Icelandic banks internationally?]. Retrieved March 15, 2010, from FSA´s website: http://fme.is/?PageID=14&NewsID=521 Carey, D. (2009). Iceland: The financial and economic crisis. Economics Department Working Paper No. 725. OECD, 1-47. Retrieved November 7, 2009, from http://www.olis.oecd.org/olis/2009doc.nsf/LinkTo/NT000069D2/$FILE/JT03271463.PDF Central Bank of Iceland. (2006a). Fitch Ratings revises Iceland's outlook to negative. Retrieved December 28, 2008, from http://www.sedlabanki.is/?PageID=287&NewsID=1124 Central Bank of Iceland. (2006b). The Economy of Iceland. Retrieved December 28, 2008, from http://www.sedlabanki.is/lisalib/getfile.aspx?itemid=4689 Central Bank of Iceland. (2009a). Retrieved September 11, 2009, from http://sedlabanki.is/?pageid=444&itemid=5a037662-26ea-477d-bda8-d71a6017cc05 32
- 33. Central Bank of Iceland. (2009b). Advantages and disadvantages of changing Iceland's monetary policy framework. Retrieved August 19, 2009, from http://www.sedlabanki.is/lisalib/getfile.aspx?itemid=7219 Chancellor, E. (2000). Devil take the hindmost: A history of financial speculation. New York: Plume. Demirgüç-Kunt, A. & Detragiache, E. (1998). Financial liberation and financial fragility. Retrieved March 10, 2010, from: http://siteresources.worldbank.org/DEC/Resources/84797- 1251813753820/6415739-1251813951236/demirguc.pdf Directorate of Labour (20010). Retrieved October 28, 2010, from: http://www.vinnumalastofnun.is/ DV. (2009). Fengu bónusa fyrir að lána. Retrieved August 15, 2009, from: http://www.dv.is/frettir/2009/8/5/fengu-bonusa-fyrir-ad-lana/ Englund P., & Vihrala V. (2003). Financial crises in developed economies: The cases of Sweden and Finland. Stockholm: Handelshogskolan. Englund, P. (1999). The Swedish banking crisis: Roots and consequences. Oxford Review of Economic Policy, 15(3), 80-97. Financial Supervisory Authority. (2008). Stress test. Retrieved August 20, 2009, from: http://www.fme.is/?PageID=168 Financial Supervisory Authority. (2009). Annual report. Retrieved September 5, 2009, from: http://fme.is/?PageID=531 Galbraith, J. K. (1997). The Great Crash. New York: Mariner Books. 33
- 34. Gregg, S. (2009). Moral failure: borrowing, lending and the financial crisis. Í P. Booth (Ed.), Verdict on the Crash: Causes and Policy Implications (pp. 145-152). London: The Institute of Economic Affairs. Honkapohja, S. (2009). The 1990’s financial crises in Nordic countries. Bank of Finland Research Discussion Papers, 5, 7-26. Honkapohja, S., & Koskela, E. (2000). The economic crisis of the 1990s in Finland. Helsinki: University of Helsinki and CEPR. Icelandic Property Registry. (2009). Vísitala íbúðaverðs. Retrieved May 19, 2009, from http://www3.fmr.is/Markadurinn/Visitala-ibudaverds International Monetary Fund. (2009b). World Economic Outlook Database. Retrieved July 6, 2009, from: http://www.imf.org/external/pubs/ft/weo/2009/01/weodata/weorept.aspx?sy=1980&ey=2014&sc sm=1&ssd=1&sort=subject&ds=.&br=1&c=142%2C128%2C172%2C144%2C176&s=NGDP_R %2CNGDP_RPCH%2CNGDP%2CNGDPD%2CNGDP_D%2CNGDPRPC%2CNGDPPC%2C NGDPDPC%2CNGAP_NPGDP%2CPPPGDP%2CPPPPC%2CPPPSH%2CPPPEX%2CPCPI%2 CPCPIPCH%2CPCPIE%2CPCPIEPCH%2CLUR%2CLE%2CLP%2CGGB%2CGGB_NGDP% 2CGGSB%2CGGSB_NPGDP%2CBCA%2CBCA_NGDPD&grp=0&a=&pr1.x=29&pr1.y=8#do wnload Jannari, K. (2009). Report on Banking Regulation and Supervision in Iceland: past, present and future. Retrieved July 15, 2009, from: http://eng.forsaetisraduneyti.is/media/frettir/KaarloJannari__2009.pdf 34
- 35. Jonung, L. (2008). Lessons from financial liberalisation in Scandinavia. Comparative Economic Studies, 50, 564-598. Jonung, L., Kiander J., & Vartia, P. (2008). The great financial crisis in Finland and Sweden: The dynamics of boom, bust and recovery, 1985-2000. European Economy Economic Papers 350, December, 1-70. Kamallakharan, B. & Tómasson, H. (2009). Can power law help us avoid the high impact ail events? Ingjaldur Hannibalsson (Ed.), Rannsóknir í Félagsvísindum X, 77-88. Reykjavík: Félagsvísindastofnun Háskóla Ísland. Kindleberger, C. P. (1996). Manias, panics, and crashes: A history of financial crises. New York: John Wiley & Sons. Kirkpatrick, G. (2009). The Corporate Governance Lessons from the Financial Crisis. Retrieved September 9, 2009, from: http://www.oecd.org/dataoecd/32/1/42229620.pdf McLean, B., & Elkind, P. (2003). The smartest guys in the room: The amazing rise and scandalous Fall of Enron. New York: Penguin Group. Mixa, M. W. (2009a). Once in khaki suits - Socioeconomical Features of the Icelandic Collapse. Ingjaldur Hannibalsson (Ed.), Rannsóknir í Félagsvísindum X, 435-447. Reykjavík: Félagsvísindastofnun Háskóla Ísland. Mixa, M. W. (2009b). Only Yesterday and Today. Unpublished MS thesis. Morgunblaðið. (2009). Yfirlýsingin kom frá forstjóra Kaupþings. Retrieved September 20, 2009, from: http://www.mbl.is/mm/vidskipti/frettir/2008/11/05/yfirlysingin_kom_fra_forstjora_kaupthings/ 35
- 36. Portes, R. & Baldursson F.M. (2007). The Internationalization of Iceland’s Financial Sector, Iceland Chamber of Commerce. Rappoport, P. og White, E. N. (1994). Was the Crash of 1929 Expected? The American Economic Review, 84(1), 272–282. Reinhart, C. M. and Rogoff, K. S. (2009). This time is different. Eight Centruries of Financial Folly. Princeton, New Jersey: University Press. Reinhart, C., & Rogoff, K. (2008). Is the 2007 U.S. Sub-Prime Crisis So Different? An International Historical Comparison. University of Maryland and Harvard University. Schwartz, A. J., (2009). Origins of the financial market crisis of 2008. In P. Booth (Ed.), Verdict on the Crash: Causes and Policy Implications (pp. 45-50). London: The Institute of Economic Affairs. Seðlabanki Íslands. (2010). Bankatöflur. Sótt 15. febrúar, 2009, af http://sedlabanki.is/?pageid=444&itemid=5a037662-26ea-477d-bda8-d71a6017cc05 Sigurjonsson, T. O., (2010a). Governance of risk and performance. Corporate Governance: The International Journal of Business in Society, 10(1), pp. 33-46. Sigurjonsson, T. O., (2010b). Privatization and Deregulation: A Chronology of Events. In R. Aliber (ed.), Documents on the Asset Price bubble in Iceland. Palgrave. Vaiman, V., Sigurjonsson, T. O. & Davidsson, P.A. (2010). Weak Business Culture as an Antecedent of Economic Crisis: The Case of Iceland, forthcoming. Valgreen, C. (2006). Iceland: Geyser crisis. Copenhagen: Danske Bank. Woods Jr., T. E. (2009). Meltdown: A free-market look at why the stock market collapsed, the economy tanked, and government bailouts will make things worse. New York: Regnery Press. 36