SlideShare uma empresa Scribd logo
1 de 8
Baixar para ler offline
The Long & Foster ® Market Conditions Report
Philadelphia Metropolitan Area - September 2013
Median Sales Price

Median Sale Price

$300,000

Of Top Five Counties/Cities Based on Total Units Sold

$210,000

$285,000

$265,000

$254,400

$190,000

$200,000
$100,000

$247,500

$300,000

$149,000

$134,900

$400,000

$282,500

Current Month

$500,000

$215,000

$230,000

$238,000

$239,000

$220,000

$206,000

$206,000

$185,000

$190,000

$206,811

$210,000

$210,000

$203,000

$223,000

$227,215

$230,000

$217,000

$203,000

$193,000

$183,750

$197,000

$195,000

$199,900

$200,000

$150,000

$208,000

$200,000

One Year Ago

$270,000

$250,000

$100,000
$0

$50,000

Philadelphia Montgomery
County
County

Bucks
County

Chester
County

Delaware
County

$0

Median Sale Price

3%

2%

1%

1%

5%

7%
1%

2%

1%
0%

2%

1%

3%

4%

4%

6%

6%

5%

8%

4%

● This September, the median sale price
was $215,000, an increase of 2%
compared to last year.

Percent Change Year/Year

3%

Highlights

0%

-10%

-5%

-4%

-2%
-5%
-8%

-8%

-5%

-4%
-6%

-2%

-2%

-6%

● The current median sale price was 7%
lower than in August.

30
The Long & Foster ® Market Conditions Report
Philadelphia Metropolitan Area - September 2013
Total Units Sold
7,000

Total Units Sold
Of Top Five Counties/Cities Based on Total Units
Sold

459

394

495

467

500

555

459

642

934

845

4,131

1,000

Current Month

731

5,297

5,154
4,331
3,637

One Year Ago

1,500

2,750

2,882

3,570

4,034

3,489

4,705
3,707

3,590

3,365
2,441

3,189

3,026

2,983

2,498

2,000

3,309

3,000

4,245

4,000

4,292

4,857

5,000

5,579

5,767

6,000

0
Philadelphia Montgomery
County
County

1,000

Bucks
County

Chester
County

Delaware
County

0

Total Units Sold

Highlights

Percent Change Year/Year

30%

11%

8%

13%

19%

21%

21%
13%

12%

15%

17%

12%

14%

14%

12%

13%

17%

19%

9%

11%
6%

10%

12%

20%

6%

● There was a decrease of 22% in total
units sold in September compared to
August.

30%

8%

● This month's total units sold was
higher than at this time last year, an
increase of 11% versus September 2012.

33%

40%

0%

31
The Long & Foster ® Market Conditions Report
Philadelphia Metropolitan Area - September 2013
Total Units Sold by Type

Total Units Sold by Type
Detached

Attached

Current Month

Condo

7,000

Detached

Attached

Condo

6,000

270
6%

5,000
4,000
3,000

1,603
39%

2,000

2,258
55%

1,000
0

Total Units Sold by Price Range
< 150K

3,000

150K to < 300K

300K to < 450K

450K to < 600K

Total Units Sold by Price Range
Current Month

600K and up

< 150K
450K to < 600K

150K to < 300K
600K and up

300K to < 450K

2,500

194
261 5%
6%

2,000

1,500

765
18%

1,181
29%

1,000
500
0

1,730
42%

32
The Long & Foster ® Market Conditions Report
Philadelphia Metropolitan Area - September 2013
Total Active Inventory
45,000

Total Active Inventory
Of Top Five Counties/Cities Based on Total Units Sold

3,678

3,313

3,345

2,936

3,773

4,000

20,000

Current Month

3,337

4,679

6,000

4,438

8,548

8,000

7,309

30,339

29,965

30,922

31,162

31,481

30,744

29,328

28,729

28,146

27,650

10,000
31,425

25,000

33,047

34,150

34,369

35,103

35,693

36,275

35,776

34,631

33,366

32,510

31,944

One Year Ago
35,913

30,000

37,704

35,000

38,901

40,000

2,000
0

15,000

Philadelphia Montgomery
County
County

10,000

Bucks
County

Chester
County

Delaware
County

5,000

0

Highlights
0%

-11%

-12%

-13%

-13%

-13%

-14%

-15%

-13%

-14%

-13%

-12%

-12%

-12%

-13%

-14%

-11%

-9%

-6%

-7%

-7%

-13%

-15%

-8%

-10%

-6%

-5%

-7%

● Versus September 2012, the total
number of homes available was lower
by 3,811 units or 11%.

Percent Change Year/Year

-5%

● This month's supply of available
inventory remained relatively stable
compared to last month.

Total Active Inventory

-20%

-25%

33
The Long & Foster ® Market Conditions Report
Philadelphia Metropolitan Area - September 2013
Total Active Inventory by Type
Detached

Attached

Total Active Inventory
by Type

Condo

Current Month

45,000

Detached

Attached

Condo

40,000
35,000

1,769
6%

30,000
25,000
20,000

11,981
39%

15,000

16,589
55%

10,000
5,000
0

Total Active Inventory by Price Range
< 150K

45,000

150K to < 300K

300K to < 450K

450K to < 600K

600K and up

Total Active Inventory by
Price Range
Current Month

< 150K
450K to < 600K

150K to < 300K
600K and up

300K to < 450K

40,000
35,000
30,000

25,000
20,000
15,000

2,897
10%
1,868
6%
4,211
14%

10,036
33%

10,000
5,000
0

11,327
37%

34
The Long & Foster ® Market Conditions Report
Philadelphia Metropolitan Area - September 2013
Sale Price as % of List Price

Average Sale Price as a Percent of List Price
97.5%

Of Top Five Counties/Cities Based on Total Units
Sold

93.0%

94.1%

Philadelphia Montgomery
County
County
Days on Market
Current One Year
Month
Ago

92.0%

78

114

100
90

104
98

105

108

100%

107

92

87

94 94 94

96.0%

95.0%

97.0%

96.4%

Up 1.0% Vs. Year Ago

< 150K

150K to < 300K

300K to < 450K

450K to < 600K

600K and up

94%
92%
78

80
71 70

60

95.5%

96%
92

81

70

96.5%

98%

102 101 101
92
90 91

Delaware
County

by Price Range

112

97

Chester
County

Average Sale Price as a Percent of List Price

Days on Market

120

Bucks
County

Avg Sale Price as % of List Price
Current
One Year
Month
Ago

Down -15% Vs. Year
Ago

110

97.4%

92.0%

92.5%

107

Current Month

95.4%

96.6%

95.8%

94.7%

96.0%

95.5%

96.5%

96.7%

96.5%

96.4%

96.1%

100.0%
98.0%

95.1%

95.4%

95.3%

95.4%

95.4%

95.5%

95.7%

95.7%

One Year Ago

94.0%
93.7%

93.5%

95.2%

95.1%

94.7%

94.3%

94.0%

94.3%

94.5%

94.7%

95.0%

95.3%

95.5%

95.6%

96.0%

96.1%

96.5%

96.8%

97.0%

74

90%
88%
86%
84%

35
The Long & Foster ® Market Conditions Report
Philadelphia Metropolitan Area - September 2013
Total Dollar Volume Sold
In Thousands

Highlights

$200,000

● Total volume sold this September was
14% greater than the same month one
year ago.
$1,078,157

$1,453,170

$1,384,505

$1,077,514

$893,979

$620,916

$674,998

$906,351

$1,002,262

$860,168

$944,140

$1,272,478

$1,164,037

$885,309

$785,807

$544,945

$603,589

$758,191

$400,000

$729,329

$600,000

$717,149

$800,000

$808,601

$1,000,000

$1,094,532

$1,200,000

$1,332,382

$1,400,000

$1,579,399

$1,600,000

$1,677,981

$1,800,000

● In September, there was 7.3 months of
supply available, compared to 9.2 in
September 2012. That was a decrease
of 20% versus a year ago.

$0

Months of Supply

Total Dollar Volume Sold
Current
One Year
Month
Ago

Current Month's Active Inventory/Current Month's Unit Sales
16

2

5.7

5.5

6.1

7.1

7.3

8.1

9.8
7.8

9.5
7.8

7.3

8.2

9.2

10.0

10.3

10.5

5.4

4

7.4

6

$944,139,680

Up 14% Vs. Year Ago

8.6

8

$1,078,156,634

13.7

13.0
10.0

11.9

10

11.8

12

12.6

14

Months of Supply
Current
One Year
Month
Ago
7.3

9.2

Down -20% Vs. Year Ago

0

36
The Long & Foster ® Market Conditions Report
Philadelphia Metropolitan Area - September 2013
New Listings

New Listings & New Contracts

Bucks
County

Chester
County

833

754

776

682

881

Current Month

758

1,201

1,098

Philadelphia Montgomery
County
County

7,297

6,996

7,696

7,793

9,154

9,855

8,695
7,009

7,185

One Year Ago

Delaware
County

New Contracts
Current Month

398

321

436

334

442

500

452

563

607

1,000

780

1,500
3,236

4,377

One Year Ago
4,679

4,844

5,488

5,804

5,302

4,023

3,708

3,467

Of Top Five Counties/Cities Based on Total Units Sold

2,789

3,057

4,028

3,521

4,029

4,055

4,180

4,445

4,424

3,806

4,586

4,756

6,407

6,748

6,853

6,919

7,391

8,081

7,467

6,894
3,039

2,893

3,225

2,000

2,953

4,000

2,451

3,704

6,000

5,081

6,363

6,697

8,000

8,506

9,116

12,000

10,000

1,810

2,000
1,500
1,000
500
0

1,895

Of Top Five Counties/Cities Based on Total Units Sold

New Contracts (Under Active Contract Status)

788

New Listings

0

0

Philadelphia Montgomery
County
County

New Listings
Current One Year
Month
Ago
7,297

6,748

Up 8% Vs. Year Ago

New Contracts
Current One Year
Month
Ago
3,236

Highlights
● Based on this month's amount of new
listings and new contracts, the ratio of
home supply (new listings) to current
home demand (new contracts) was 2.3,
an increase of 18% from September
2012.

Bucks
County

Chester
County

Delaware
County

Supply/Demand Ratio
Number of New Listings to New Contracts
2.5

2.0

1.5

2.3

2.3

2.3
2.0 2.0 1.9

2.0
1.8
1.5

1.8 1.8

1.9

1.9
1.7 1.7

1.7
1.6 1.6

1.6 1.7 1.7 1.6 1.6 1.6

1.2
1.0

3,521

Down -8% Vs. Year
Ago

0.5

0.0

37

Mais conteúdo relacionado

Mais procurados

Comparison 2014-vs-2013-second quarter
Comparison 2014-vs-2013-second quarterComparison 2014-vs-2013-second quarter
Comparison 2014-vs-2013-second quarter
RE/MAX Grand Lake
 
Eucatex apres 4_t14_en
Eucatex apres 4_t14_enEucatex apres 4_t14_en
Eucatex apres 4_t14_en
EucatexRI
 

Mais procurados (16)

August 2015 The Woodlands Market Report
August 2015 The Woodlands Market ReportAugust 2015 The Woodlands Market Report
August 2015 The Woodlands Market Report
 
January 2016 The Woodlands market report
January 2016 The Woodlands market reportJanuary 2016 The Woodlands market report
January 2016 The Woodlands market report
 
lotte foods 002270 Algorithm Investment Report
lotte foods 002270 Algorithm Investment Reportlotte foods 002270 Algorithm Investment Report
lotte foods 002270 Algorithm Investment Report
 
**JUNK** Upload
**JUNK** Upload**JUNK** Upload
**JUNK** Upload
 
San Francisco Market Update
San Francisco Market UpdateSan Francisco Market Update
San Francisco Market Update
 
FHC HSUISSEG FORECAST BUDGETING 2019
FHC HSUISSEG FORECAST BUDGETING 2019FHC HSUISSEG FORECAST BUDGETING 2019
FHC HSUISSEG FORECAST BUDGETING 2019
 
November 2015 the woodlands market report
November 2015 the woodlands market reportNovember 2015 the woodlands market report
November 2015 the woodlands market report
 
cellivery 268600 Algorithm Investment Report
cellivery 268600 Algorithm Investment Reportcellivery 268600 Algorithm Investment Report
cellivery 268600 Algorithm Investment Report
 
Comparison 2014-vs-2013-second quarter
Comparison 2014-vs-2013-second quarterComparison 2014-vs-2013-second quarter
Comparison 2014-vs-2013-second quarter
 
s-oil 010950 Algorithm Investment Report
s-oil 010950 Algorithm Investment Reports-oil 010950 Algorithm Investment Report
s-oil 010950 Algorithm Investment Report
 
Eucatex apres 4_t14_en
Eucatex apres 4_t14_enEucatex apres 4_t14_en
Eucatex apres 4_t14_en
 
Reliance Industries Growth for the Year 2017-2018 y-o-y analysis
Reliance Industries Growth for the  Year 2017-2018  y-o-y analysisReliance Industries Growth for the  Year 2017-2018  y-o-y analysis
Reliance Industries Growth for the Year 2017-2018 y-o-y analysis
 
Capital Heights Baton Rouge Home Sales Charts 2015 to 2018 YTD
Capital Heights Baton Rouge Home Sales Charts 2015 to 2018 YTDCapital Heights Baton Rouge Home Sales Charts 2015 to 2018 YTD
Capital Heights Baton Rouge Home Sales Charts 2015 to 2018 YTD
 
Ascension Parish Home Sales February 2013 vs February 2014
Ascension Parish Home Sales February 2013 vs February 2014Ascension Parish Home Sales February 2013 vs February 2014
Ascension Parish Home Sales February 2013 vs February 2014
 
June 2013 Multifamily Housing Activity Report – Boston, MA Real Estate
June 2013 Multifamily Housing Activity Report – Boston, MA Real EstateJune 2013 Multifamily Housing Activity Report – Boston, MA Real Estate
June 2013 Multifamily Housing Activity Report – Boston, MA Real Estate
 
unison 018000 Algorithm Investment Report
unison 018000 Algorithm Investment Reportunison 018000 Algorithm Investment Report
unison 018000 Algorithm Investment Report
 

Semelhante a Philadelphia Metropolitan Market Conditions Report

TORONTO REAL ESTATE BOARD'S -- MARKET WATCH - JULY 2019
TORONTO REAL ESTATE BOARD'S -- MARKET WATCH - JULY 2019TORONTO REAL ESTATE BOARD'S -- MARKET WATCH - JULY 2019
TORONTO REAL ESTATE BOARD'S -- MARKET WATCH - JULY 2019
Shawn Venasse
 
San Francisco Market Focus May 2014
San Francisco Market Focus May 2014San Francisco Market Focus May 2014
San Francisco Market Focus May 2014
Ronny Budiutama
 

Semelhante a Philadelphia Metropolitan Market Conditions Report (20)

Baltimore Metropolitan Area Market Conditions
Baltimore Metropolitan Area Market ConditionsBaltimore Metropolitan Area Market Conditions
Baltimore Metropolitan Area Market Conditions
 
Richmond Metropolitan Area Market Conditions Report
Richmond Metropolitan Area Market Conditions ReportRichmond Metropolitan Area Market Conditions Report
Richmond Metropolitan Area Market Conditions Report
 
The Triangle Area, NC Market Conditions Report
The Triangle Area, NC Market Conditions ReportThe Triangle Area, NC Market Conditions Report
The Triangle Area, NC Market Conditions Report
 
Virginia Beach/Norfolk/Newport News Market Conditions Report
Virginia Beach/Norfolk/Newport News Market Conditions ReportVirginia Beach/Norfolk/Newport News Market Conditions Report
Virginia Beach/Norfolk/Newport News Market Conditions Report
 
Eastern Shore Maryland/Delaware Area Market Conditions Report
Eastern Shore Maryland/Delaware Area Market Conditions ReportEastern Shore Maryland/Delaware Area Market Conditions Report
Eastern Shore Maryland/Delaware Area Market Conditions Report
 
Roanoke Metropolitan Area Market Conditions Report
Roanoke Metropolitan Area Market Conditions ReportRoanoke Metropolitan Area Market Conditions Report
Roanoke Metropolitan Area Market Conditions Report
 
Market Watch TORONTO 2015 SEPTEMBER
Market Watch TORONTO 2015 SEPTEMBERMarket Watch TORONTO 2015 SEPTEMBER
Market Watch TORONTO 2015 SEPTEMBER
 
Market Report for August 2017 - Residential Resale
Market Report for August 2017 - Residential ResaleMarket Report for August 2017 - Residential Resale
Market Report for August 2017 - Residential Resale
 
Toronto Market Watch AUGUST 2016
Toronto Market Watch AUGUST 2016Toronto Market Watch AUGUST 2016
Toronto Market Watch AUGUST 2016
 
TREB Market Watch - August 2016
TREB Market Watch - August 2016TREB Market Watch - August 2016
TREB Market Watch - August 2016
 
TREB MARKET WATCH 2017
TREB MARKET WATCH 2017TREB MARKET WATCH 2017
TREB MARKET WATCH 2017
 
October Market Watch is Here !
October Market Watch is Here !October Market Watch is Here !
October Market Watch is Here !
 
San Francisco Market Focus June 2015
San Francisco Market Focus June 2015San Francisco Market Focus June 2015
San Francisco Market Focus June 2015
 
KPI Dashboard Template in Excel
KPI Dashboard Template in ExcelKPI Dashboard Template in Excel
KPI Dashboard Template in Excel
 
San Francisco Market Focus July 2013
San Francisco Market Focus July 2013San Francisco Market Focus July 2013
San Francisco Market Focus July 2013
 
April 2016 Home Sales in Toronto and GTA
April 2016 Home Sales in Toronto and GTAApril 2016 Home Sales in Toronto and GTA
April 2016 Home Sales in Toronto and GTA
 
Market watch jul 2019 frank yu oakville
Market watch jul 2019 frank yu oakvilleMarket watch jul 2019 frank yu oakville
Market watch jul 2019 frank yu oakville
 
Market watch jul 2019 frank yu oakville
Market watch jul 2019 frank yu oakvilleMarket watch jul 2019 frank yu oakville
Market watch jul 2019 frank yu oakville
 
TORONTO REAL ESTATE BOARD'S -- MARKET WATCH - JULY 2019
TORONTO REAL ESTATE BOARD'S -- MARKET WATCH - JULY 2019TORONTO REAL ESTATE BOARD'S -- MARKET WATCH - JULY 2019
TORONTO REAL ESTATE BOARD'S -- MARKET WATCH - JULY 2019
 
San Francisco Market Focus May 2014
San Francisco Market Focus May 2014San Francisco Market Focus May 2014
San Francisco Market Focus May 2014
 

Último

MEQ Mainstreet Equity Corp Q2 2024 Investor Presentation
MEQ Mainstreet Equity Corp Q2 2024 Investor PresentationMEQ Mainstreet Equity Corp Q2 2024 Investor Presentation
MEQ Mainstreet Equity Corp Q2 2024 Investor Presentation
MEQ - Mainstreet Equity Corp.
 
9990771857 Call Girls in Dwarka Sector 08 Delhi (Call Girls) Delhi
9990771857 Call Girls in Dwarka Sector 08 Delhi (Call Girls) Delhi9990771857 Call Girls in Dwarka Sector 08 Delhi (Call Girls) Delhi
9990771857 Call Girls in Dwarka Sector 08 Delhi (Call Girls) Delhi
delhimodel235
 
BPTP THE AMAARIO Luxury Project Invest Like Royalty in Sector 37D Gurgaon Dwa...
BPTP THE AMAARIO Luxury Project Invest Like Royalty in Sector 37D Gurgaon Dwa...BPTP THE AMAARIO Luxury Project Invest Like Royalty in Sector 37D Gurgaon Dwa...
BPTP THE AMAARIO Luxury Project Invest Like Royalty in Sector 37D Gurgaon Dwa...
ApartmentWala1
 
Call Girls In Seelampur Delhi ↬8447779280}Seelampur Escorts Service In Delhi...
Call Girls In Seelampur  Delhi ↬8447779280}Seelampur Escorts Service In Delhi...Call Girls In Seelampur  Delhi ↬8447779280}Seelampur Escorts Service In Delhi...
Call Girls In Seelampur Delhi ↬8447779280}Seelampur Escorts Service In Delhi...
asmaqueen5
 
ACE Terra Yamuna Expressway | 8929888700
ACE Terra Yamuna Expressway | 8929888700ACE Terra Yamuna Expressway | 8929888700
ACE Terra Yamuna Expressway | 8929888700
Truhomes
 
9990771857 Call Girls in Dwarka Sector 6 Delhi (Call Girls) Delhi
9990771857 Call Girls in Dwarka Sector 6 Delhi (Call Girls) Delhi9990771857 Call Girls in Dwarka Sector 6 Delhi (Call Girls) Delhi
9990771857 Call Girls in Dwarka Sector 6 Delhi (Call Girls) Delhi
delhimodel235
 
9990771857 Call Girls in Dwarka Sector 2 Delhi (Call Girls) Delhi
9990771857 Call Girls in Dwarka Sector 2 Delhi (Call Girls) Delhi9990771857 Call Girls in Dwarka Sector 2 Delhi (Call Girls) Delhi
9990771857 Call Girls in Dwarka Sector 2 Delhi (Call Girls) Delhi
delhimodel235
 

Último (20)

M3M The Line Brochure - Premium Investment Opportunity for Commercial Ventures
M3M The Line Brochure - Premium Investment Opportunity for Commercial VenturesM3M The Line Brochure - Premium Investment Opportunity for Commercial Ventures
M3M The Line Brochure - Premium Investment Opportunity for Commercial Ventures
 
Yedi Mavi TOBB Zeytinburnu - Listing Turkey
Yedi Mavi TOBB Zeytinburnu - Listing TurkeyYedi Mavi TOBB Zeytinburnu - Listing Turkey
Yedi Mavi TOBB Zeytinburnu - Listing Turkey
 
Retail Center For Sale - 1019 River St., Belleville, WI
Retail Center For Sale - 1019 River St., Belleville, WIRetail Center For Sale - 1019 River St., Belleville, WI
Retail Center For Sale - 1019 River St., Belleville, WI
 
Vanam At Purva Soukhyam Guduvanchery.pdf.pdf
Vanam At Purva Soukhyam Guduvanchery.pdf.pdfVanam At Purva Soukhyam Guduvanchery.pdf.pdf
Vanam At Purva Soukhyam Guduvanchery.pdf.pdf
 
Enjoy Night ≽ 8448380779 ≼ Call Girls In Huda City Centre (Gurgaon)
Enjoy Night ≽ 8448380779 ≼ Call Girls In Huda City Centre (Gurgaon)Enjoy Night ≽ 8448380779 ≼ Call Girls In Huda City Centre (Gurgaon)
Enjoy Night ≽ 8448380779 ≼ Call Girls In Huda City Centre (Gurgaon)
 
Eldeco Dwarka Project In Delhi-brochure.pdf.pdf
Eldeco Dwarka Project In Delhi-brochure.pdf.pdfEldeco Dwarka Project In Delhi-brochure.pdf.pdf
Eldeco Dwarka Project In Delhi-brochure.pdf.pdf
 
MEQ Mainstreet Equity Corp Q2 2024 Investor Presentation
MEQ Mainstreet Equity Corp Q2 2024 Investor PresentationMEQ Mainstreet Equity Corp Q2 2024 Investor Presentation
MEQ Mainstreet Equity Corp Q2 2024 Investor Presentation
 
9990771857 Call Girls in Dwarka Sector 08 Delhi (Call Girls) Delhi
9990771857 Call Girls in Dwarka Sector 08 Delhi (Call Girls) Delhi9990771857 Call Girls in Dwarka Sector 08 Delhi (Call Girls) Delhi
9990771857 Call Girls in Dwarka Sector 08 Delhi (Call Girls) Delhi
 
2k Shots ≽ 9205541914 ≼ Call Girls In Sainik Farm (Delhi)
2k Shots ≽ 9205541914 ≼ Call Girls In Sainik Farm (Delhi)2k Shots ≽ 9205541914 ≼ Call Girls In Sainik Farm (Delhi)
2k Shots ≽ 9205541914 ≼ Call Girls In Sainik Farm (Delhi)
 
BPTP THE AMAARIO Luxury Project Invest Like Royalty in Sector 37D Gurgaon Dwa...
BPTP THE AMAARIO Luxury Project Invest Like Royalty in Sector 37D Gurgaon Dwa...BPTP THE AMAARIO Luxury Project Invest Like Royalty in Sector 37D Gurgaon Dwa...
BPTP THE AMAARIO Luxury Project Invest Like Royalty in Sector 37D Gurgaon Dwa...
 
BDSM⚡Call Girls in Sector 57 Noida Escorts >༒8448380779 Escort Service
BDSM⚡Call Girls in Sector 57 Noida Escorts >༒8448380779 Escort ServiceBDSM⚡Call Girls in Sector 57 Noida Escorts >༒8448380779 Escort Service
BDSM⚡Call Girls in Sector 57 Noida Escorts >༒8448380779 Escort Service
 
2k Shot Call girls Karol Bagh Delhi 9205541914
2k Shot Call girls Karol Bagh Delhi 92055419142k Shot Call girls Karol Bagh Delhi 9205541914
2k Shot Call girls Karol Bagh Delhi 9205541914
 
M3M 129 E Brochure Noida Expressway, Sector 129, Noida
M3M 129 E Brochure Noida Expressway, Sector 129, NoidaM3M 129 E Brochure Noida Expressway, Sector 129, Noida
M3M 129 E Brochure Noida Expressway, Sector 129, Noida
 
Parksville 96 Surrey Floor Plans May 2024
Parksville 96 Surrey Floor Plans May 2024Parksville 96 Surrey Floor Plans May 2024
Parksville 96 Surrey Floor Plans May 2024
 
Call Girls In Seelampur Delhi ↬8447779280}Seelampur Escorts Service In Delhi...
Call Girls In Seelampur  Delhi ↬8447779280}Seelampur Escorts Service In Delhi...Call Girls In Seelampur  Delhi ↬8447779280}Seelampur Escorts Service In Delhi...
Call Girls In Seelampur Delhi ↬8447779280}Seelampur Escorts Service In Delhi...
 
ACE Terra Yamuna Expressway | 8929888700
ACE Terra Yamuna Expressway | 8929888700ACE Terra Yamuna Expressway | 8929888700
ACE Terra Yamuna Expressway | 8929888700
 
9990771857 Call Girls in Dwarka Sector 6 Delhi (Call Girls) Delhi
9990771857 Call Girls in Dwarka Sector 6 Delhi (Call Girls) Delhi9990771857 Call Girls in Dwarka Sector 6 Delhi (Call Girls) Delhi
9990771857 Call Girls in Dwarka Sector 6 Delhi (Call Girls) Delhi
 
Greater Vancouver Realtors Statistics Package April 2024
Greater Vancouver Realtors Statistics Package April 2024Greater Vancouver Realtors Statistics Package April 2024
Greater Vancouver Realtors Statistics Package April 2024
 
9990771857 Call Girls in Dwarka Sector 2 Delhi (Call Girls) Delhi
9990771857 Call Girls in Dwarka Sector 2 Delhi (Call Girls) Delhi9990771857 Call Girls in Dwarka Sector 2 Delhi (Call Girls) Delhi
9990771857 Call Girls in Dwarka Sector 2 Delhi (Call Girls) Delhi
 
Kohinoor Teiko Hinjewadi Phase 2 Pune E-Brochure.pdf
Kohinoor Teiko Hinjewadi Phase 2 Pune  E-Brochure.pdfKohinoor Teiko Hinjewadi Phase 2 Pune  E-Brochure.pdf
Kohinoor Teiko Hinjewadi Phase 2 Pune E-Brochure.pdf
 

Philadelphia Metropolitan Market Conditions Report

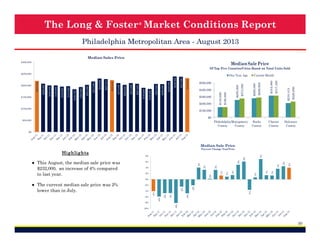
  • 1. The Long & Foster ® Market Conditions Report Philadelphia Metropolitan Area - September 2013 Median Sales Price Median Sale Price $300,000 Of Top Five Counties/Cities Based on Total Units Sold $210,000 $285,000 $265,000 $254,400 $190,000 $200,000 $100,000 $247,500 $300,000 $149,000 $134,900 $400,000 $282,500 Current Month $500,000 $215,000 $230,000 $238,000 $239,000 $220,000 $206,000 $206,000 $185,000 $190,000 $206,811 $210,000 $210,000 $203,000 $223,000 $227,215 $230,000 $217,000 $203,000 $193,000 $183,750 $197,000 $195,000 $199,900 $200,000 $150,000 $208,000 $200,000 One Year Ago $270,000 $250,000 $100,000 $0 $50,000 Philadelphia Montgomery County County Bucks County Chester County Delaware County $0 Median Sale Price 3% 2% 1% 1% 5% 7% 1% 2% 1% 0% 2% 1% 3% 4% 4% 6% 6% 5% 8% 4% ● This September, the median sale price was $215,000, an increase of 2% compared to last year. Percent Change Year/Year 3% Highlights 0% -10% -5% -4% -2% -5% -8% -8% -5% -4% -6% -2% -2% -6% ● The current median sale price was 7% lower than in August. 30
  • 2. The Long & Foster ® Market Conditions Report Philadelphia Metropolitan Area - September 2013 Total Units Sold 7,000 Total Units Sold Of Top Five Counties/Cities Based on Total Units Sold 459 394 495 467 500 555 459 642 934 845 4,131 1,000 Current Month 731 5,297 5,154 4,331 3,637 One Year Ago 1,500 2,750 2,882 3,570 4,034 3,489 4,705 3,707 3,590 3,365 2,441 3,189 3,026 2,983 2,498 2,000 3,309 3,000 4,245 4,000 4,292 4,857 5,000 5,579 5,767 6,000 0 Philadelphia Montgomery County County 1,000 Bucks County Chester County Delaware County 0 Total Units Sold Highlights Percent Change Year/Year 30% 11% 8% 13% 19% 21% 21% 13% 12% 15% 17% 12% 14% 14% 12% 13% 17% 19% 9% 11% 6% 10% 12% 20% 6% ● There was a decrease of 22% in total units sold in September compared to August. 30% 8% ● This month's total units sold was higher than at this time last year, an increase of 11% versus September 2012. 33% 40% 0% 31
  • 3. The Long & Foster ® Market Conditions Report Philadelphia Metropolitan Area - September 2013 Total Units Sold by Type Total Units Sold by Type Detached Attached Current Month Condo 7,000 Detached Attached Condo 6,000 270 6% 5,000 4,000 3,000 1,603 39% 2,000 2,258 55% 1,000 0 Total Units Sold by Price Range < 150K 3,000 150K to < 300K 300K to < 450K 450K to < 600K Total Units Sold by Price Range Current Month 600K and up < 150K 450K to < 600K 150K to < 300K 600K and up 300K to < 450K 2,500 194 261 5% 6% 2,000 1,500 765 18% 1,181 29% 1,000 500 0 1,730 42% 32
  • 4. The Long & Foster ® Market Conditions Report Philadelphia Metropolitan Area - September 2013 Total Active Inventory 45,000 Total Active Inventory Of Top Five Counties/Cities Based on Total Units Sold 3,678 3,313 3,345 2,936 3,773 4,000 20,000 Current Month 3,337 4,679 6,000 4,438 8,548 8,000 7,309 30,339 29,965 30,922 31,162 31,481 30,744 29,328 28,729 28,146 27,650 10,000 31,425 25,000 33,047 34,150 34,369 35,103 35,693 36,275 35,776 34,631 33,366 32,510 31,944 One Year Ago 35,913 30,000 37,704 35,000 38,901 40,000 2,000 0 15,000 Philadelphia Montgomery County County 10,000 Bucks County Chester County Delaware County 5,000 0 Highlights 0% -11% -12% -13% -13% -13% -14% -15% -13% -14% -13% -12% -12% -12% -13% -14% -11% -9% -6% -7% -7% -13% -15% -8% -10% -6% -5% -7% ● Versus September 2012, the total number of homes available was lower by 3,811 units or 11%. Percent Change Year/Year -5% ● This month's supply of available inventory remained relatively stable compared to last month. Total Active Inventory -20% -25% 33
  • 5. The Long & Foster ® Market Conditions Report Philadelphia Metropolitan Area - September 2013 Total Active Inventory by Type Detached Attached Total Active Inventory by Type Condo Current Month 45,000 Detached Attached Condo 40,000 35,000 1,769 6% 30,000 25,000 20,000 11,981 39% 15,000 16,589 55% 10,000 5,000 0 Total Active Inventory by Price Range < 150K 45,000 150K to < 300K 300K to < 450K 450K to < 600K 600K and up Total Active Inventory by Price Range Current Month < 150K 450K to < 600K 150K to < 300K 600K and up 300K to < 450K 40,000 35,000 30,000 25,000 20,000 15,000 2,897 10% 1,868 6% 4,211 14% 10,036 33% 10,000 5,000 0 11,327 37% 34
  • 6. The Long & Foster ® Market Conditions Report Philadelphia Metropolitan Area - September 2013 Sale Price as % of List Price Average Sale Price as a Percent of List Price 97.5% Of Top Five Counties/Cities Based on Total Units Sold 93.0% 94.1% Philadelphia Montgomery County County Days on Market Current One Year Month Ago 92.0% 78 114 100 90 104 98 105 108 100% 107 92 87 94 94 94 96.0% 95.0% 97.0% 96.4% Up 1.0% Vs. Year Ago < 150K 150K to < 300K 300K to < 450K 450K to < 600K 600K and up 94% 92% 78 80 71 70 60 95.5% 96% 92 81 70 96.5% 98% 102 101 101 92 90 91 Delaware County by Price Range 112 97 Chester County Average Sale Price as a Percent of List Price Days on Market 120 Bucks County Avg Sale Price as % of List Price Current One Year Month Ago Down -15% Vs. Year Ago 110 97.4% 92.0% 92.5% 107 Current Month 95.4% 96.6% 95.8% 94.7% 96.0% 95.5% 96.5% 96.7% 96.5% 96.4% 96.1% 100.0% 98.0% 95.1% 95.4% 95.3% 95.4% 95.4% 95.5% 95.7% 95.7% One Year Ago 94.0% 93.7% 93.5% 95.2% 95.1% 94.7% 94.3% 94.0% 94.3% 94.5% 94.7% 95.0% 95.3% 95.5% 95.6% 96.0% 96.1% 96.5% 96.8% 97.0% 74 90% 88% 86% 84% 35
  • 7. The Long & Foster ® Market Conditions Report Philadelphia Metropolitan Area - September 2013 Total Dollar Volume Sold In Thousands Highlights $200,000 ● Total volume sold this September was 14% greater than the same month one year ago. $1,078,157 $1,453,170 $1,384,505 $1,077,514 $893,979 $620,916 $674,998 $906,351 $1,002,262 $860,168 $944,140 $1,272,478 $1,164,037 $885,309 $785,807 $544,945 $603,589 $758,191 $400,000 $729,329 $600,000 $717,149 $800,000 $808,601 $1,000,000 $1,094,532 $1,200,000 $1,332,382 $1,400,000 $1,579,399 $1,600,000 $1,677,981 $1,800,000 ● In September, there was 7.3 months of supply available, compared to 9.2 in September 2012. That was a decrease of 20% versus a year ago. $0 Months of Supply Total Dollar Volume Sold Current One Year Month Ago Current Month's Active Inventory/Current Month's Unit Sales 16 2 5.7 5.5 6.1 7.1 7.3 8.1 9.8 7.8 9.5 7.8 7.3 8.2 9.2 10.0 10.3 10.5 5.4 4 7.4 6 $944,139,680 Up 14% Vs. Year Ago 8.6 8 $1,078,156,634 13.7 13.0 10.0 11.9 10 11.8 12 12.6 14 Months of Supply Current One Year Month Ago 7.3 9.2 Down -20% Vs. Year Ago 0 36
  • 8. The Long & Foster ® Market Conditions Report Philadelphia Metropolitan Area - September 2013 New Listings New Listings & New Contracts Bucks County Chester County 833 754 776 682 881 Current Month 758 1,201 1,098 Philadelphia Montgomery County County 7,297 6,996 7,696 7,793 9,154 9,855 8,695 7,009 7,185 One Year Ago Delaware County New Contracts Current Month 398 321 436 334 442 500 452 563 607 1,000 780 1,500 3,236 4,377 One Year Ago 4,679 4,844 5,488 5,804 5,302 4,023 3,708 3,467 Of Top Five Counties/Cities Based on Total Units Sold 2,789 3,057 4,028 3,521 4,029 4,055 4,180 4,445 4,424 3,806 4,586 4,756 6,407 6,748 6,853 6,919 7,391 8,081 7,467 6,894 3,039 2,893 3,225 2,000 2,953 4,000 2,451 3,704 6,000 5,081 6,363 6,697 8,000 8,506 9,116 12,000 10,000 1,810 2,000 1,500 1,000 500 0 1,895 Of Top Five Counties/Cities Based on Total Units Sold New Contracts (Under Active Contract Status) 788 New Listings 0 0 Philadelphia Montgomery County County New Listings Current One Year Month Ago 7,297 6,748 Up 8% Vs. Year Ago New Contracts Current One Year Month Ago 3,236 Highlights ● Based on this month's amount of new listings and new contracts, the ratio of home supply (new listings) to current home demand (new contracts) was 2.3, an increase of 18% from September 2012. Bucks County Chester County Delaware County Supply/Demand Ratio Number of New Listings to New Contracts 2.5 2.0 1.5 2.3 2.3 2.3 2.0 2.0 1.9 2.0 1.8 1.5 1.8 1.8 1.9 1.9 1.7 1.7 1.7 1.6 1.6 1.6 1.7 1.7 1.6 1.6 1.6 1.2 1.0 3,521 Down -8% Vs. Year Ago 0.5 0.0 37