SlideShare uma empresa Scribd logo
1 de 24
Baixar para ler offline
THE IMPACT OF TRANSPORT AND
LOGISTICS COSTS IN SELECTED SECTORS
OF CEARÁ’S FOREIGN TRADE
April 2007
This document was prepared for the United States Agency for International
Development (USAID) by CARANA Corporation, in collaboration with the Federation
of Industries of the State of Ceará (FIEC)
This document was prepared for the United States Agency for International Development
(USAID) by David Schacht, Martin Sgut, Júlia Carvalhedo Studart, Rogério Couto Parente,
Leopoldo Neto Nunes da Silva, Frederico Ponte and Luciana Mota Tomé, of the CARANA
Corporation, under the LAC Trade III contract (Prime Contract No. GS-10F-0150K, Order
No. EDG-M-00-02-00041).
The information, conclusions, interpretations and opinions expressed in this publication are the
responsibility of the authors, and they do not necessarily reflect the thinking of the United
States Agency for International Development (USAID), nor of the Government of the United
States of America.
THE IMPACT OF TRANSPORT AND
LOGISTICS COSTS IN SELECTED SECTORS
OF CEARÁ’S FOREIGN TRADE
PREFACE
The United States Agency for International Development (USAID), through the consultant, the
CARANA Corporation, made available to the Federation of the Industries of the State of Ceará (FIEC)
the methodology for the identification and measurement of the logistical costs relating to the foreign
marketing of products.
The study, entitled “The Impact of the Logistical Costs in Selected Sectors of Ceará’s Foreign Trade,”
was developed by local consultants, and reveals the status of the situation of the logistical corridors for
six products, which together represent approximately 50% of Ceará’s foreign trade. The study identifies
the logistical impediments to the processes of exportation or importation of those products, and
quantifies the extra costs generated, which impact in a negative fashion on the international
competitiveness of Ceará’s industry, and, as a result, on the state’s economy. Proposals of solutions to
the problems encountered have relative importance for the state, in that competitiveness is not
restricted to the internal formation of pricing, but also affects all of the external factors that influence
costs assumed by any given company.
With that in mind, this study offers to the companies, the entities and the government a tool for the
analysis of logistical costs relating to exportation/importation, which will contribute substantially to an
increase in the competitiveness abroad of Ceará’s economy.
One entity concerned with these questions, FIEC, with the invaluable support of the USAID, thereby
strengthens its position as a major entity in the industrial representation in the state of Ceará.
Obviously, this study would not have been made, nor its conclusions reached, without the collaboration
of a valuable group of individuals, companies and entities.
Finally, the strategic joining of the entities involved in overseas trade that has been successful occurs
with the commitment of all of the individuals involved in continuing to make their capabilities available,
with a view to the full and continual improvement of the economy of the state, and consequently, of the
improved livelihood of its inhabitants.
The Northeast region of Brazil will receive quantitative and qualitative gains as soon as the methodology
of the present study is replicated in the other units of the federation. FIEC remains at the disposal of the
northeastern states which show interest in that regard.
Roberto Proença de Macedo
President of FIEC
TABLE OF CONTENTS
EXECUTIVE SUMMARY..............................................................................................................xi
1. THE GEOPOLITICAL SITUATION IN THE STATE OF CEARÁ.....................................1
1.1. BRIEF OVERVIEW OF THE CEARÁ ECONOMY .............................................3
1.1.1. Evolution..........................................................................................................................................3
1.1.2. Foreign Trade Performance in Ceará – 1997-2006.........................................................7
1.1.3. Ceará exports................................................................................................................................7
1.2. INTERNATIONAL TRADE ENTITIES IN CEARÁ..........................................10
1.2.1. Commercial Sector...................................................................................................................10
1.2.2. Transport......................................................................................................................................11
1.2.3. Government and Regulatory Agencies..............................................................................19
2. INTERNATIONAL LOGISTICS IN THE STATE OF CEARÁ..........................................23
2.1. IMPORTANCE OF LOGISTICS IN INTERNATIONAL TRADE...................23
2.2. INFRASTRUCTURE OF THE INTERNATIONAL PHYSICAL
DISTRIBUTION (DFI) IN THE STATE OF CEARÁ ................24
2.2.1. Port System of state of Ceará...............................................................................................24
2.2.2. Port of Fortaleza........................................................................................................................25
2.2.3. Port of Pecém.............................................................................................................................27
2.2.4. Productivity of the ports of Pecém and Fortaleza (container operations)32
2.2.5. Pinto Marins Airport................................................................................................................33
2.2.6. Land transportation infrastructure......................................................................................34
2.2.7. Railroads.......................................................................................................................................34
3. METHODOLOGY..................................................................................................................37
3.1. PRIOR EXPERIENCE ..........................................................................................37
3.2. COVERAGE OF THE ANALYSIS......................................................................38
3.3. SELECTION OF PRODUCTS AND CEARÁ EXPORT CORRIDORS ..........40
3.4. DEFINITION OF THE STRUCTURE (STAGES/CATEGORIES OF COSTS)41
3.4.1. Stages .............................................................................................................................................42
3.4.2. Categories of costs...................................................................................................................42
3.4.3. Issues involving inventory costs............................................................................................43
3.4.4. Issues involving indirect costs relating to port operations and the
mooring of vessels.....................................................................................................................44
3.4.5. Issues involving indirect costs relating to land transport............................................46
3.5. MAIN SOURCES OF INFORMATION..............................................................48
3.6. PROCESSING OF THE INFORMATION..........................................................48
4. RESULTS................................................................................................................................51
4.1. EXPORTATION OF SHOES – MARITIME MODE..........................................51
4.2. EXPORTATION OF CASHEW NUTS – MARITIME MODE..........................58
4.3. EXPORTATION OF FROZEN SHRIMP – MARITIME MODE........................65
4.4. EXPORTATION OF MELONS – MARITIME MODE.......................................72
4.5. EXPORTATION OF APPAREL – AIR MODE ..................................................79
4.6. IMPORTATION OF COTTON – MARITIME MODE......................................85
5. CONCLUSIONS AND RECOMMENDATIONS.................................................................93
5.1. SECTOR COMPARISONS..................................................................................94
5.1.1. Main common extra costs......................................................................................................96
5.1.2. Main extra costs exclusive to certain sectors.................................................................97
5.2. ANALYSIS OF EXTRA COSTS BY STAGE AND ACTIVITY........................99
5.2.1. Pre-shipment ............................................................................................................................101
5.2.2. Land transport..........................................................................................................................103
5.2.3. Airport and port......................................................................................................................104
5.2.4. Customs......................................................................................................................................106
5.2.5. Maritime/air transport...........................................................................................................109
5.3. MACRO-EXTRAPOLATION ANALYSIS OF EXTRA COSTS FOR CEARÁ
FOREIGN TRADE..............................................................................................112
5.3.1. Exports........................................................................................................................................112
5.3.2. Imports........................................................................................................................................112
5.4. RECOMMENDATIONS.....................................................................................113
5.4.1. Pre-shipment.............................................................................................................................113
5.4.2. Land transport..........................................................................................................................115
5.4.3. Port...............................................................................................................................................119
5.4.4. Customs......................................................................................................................................123
5.4.5. Maritime/air transport...........................................................................................................128
5.4.6. Application of international practices for handling security
in Ceará ports...........................................................................................................................129
GLOSSARY.................................................................................................................................135
BIBLIOGRAPHY........................................................................................................................137
APPENDICES.............................................................................................................................139
Appendix A: Evolution of containerized cargo in the Ceará port system....................................141
Appendix B: Simplified exportation............................................................................................................147
Appendix C: Extrapolation of extra costs................................................................................................150
Appendix D: Entities operating in Brazilian foreign trade...................................................................153
Appendix E: Operational process of Brazilian foreign trade.............................................................158
Appendix F: Results of the models.............................................................................................................162
ACKNOWLEDGMENTS...........................................................................................................181
LIST OF CHARTS
Chart 1. Select products ..........................................................................................................................................xii
Chart 2. Corridors studied....................................................................................................................................xiii
Chart 3. Definition of logistical stages studied ...............................................................................................xv
Chart 4. Definition of categories of logistical costs studied ....................................................................xv
Chart 5. Extra costs calculated by stage of export and import processes (2006) ........................xvi
Chart 6. Most significant extra costs by product/card or (2006) ........................................................xvii
Chart 7. Activities responsible for the major portion of extra costs identified in the study .xviii
Chart 8. Extra costs calculated for Ceará foreign trade - 2006...........................................................xix
Chart 9. Main recommendations of the study...............................................................................................xx
Chart 10. Ceará data......................................................................................................................................................1
Chart 11. Transport time (hours) - air mode .....................................................................................................2
Chart 12. Transport time (days) - maritime mode...........................................................................................2
Chart 13. Selected products - percentage of exports - 2005-2006 ..........................................................6
Chart 14. Evolution of Ceará foreign trade, 1997-2006.................................................................................7
Chart 15. Ceará exports, Northeast, Brazil, 1997-2006................................................................................8
Chart 16. Amount of merchandise exported, selected states, 2000-2006............................................9
Chart 17. Comparison of Ceará export companies 2005-2006.................................................................9
Chart 18. Free rate of exchange - US dollar (buy) - period average ........................................................9
Chart 19. Comparison of Ceará import and export companies 2004-2005......................................11
Chart 20 Billings of companies involved in foreign trade-2005...............................................................11
Chart 21. Evolution of transportation modes in Ceará foreign trade -1997/2006 -
percentage of volume (T).....................................................................................................................12
Chart 22. Transporters and fleet of vehicles ....................................................................................................13
Chart 23. Average highway freight for the ports of Pecém and Fortaleza, main
exporting municipalities.........................................................................................................................14
Chart 24. Direct services offered in the Ceará ports ..................................................................................15
Chart 25. Transit time from Ceará to main ports of destination............................................................16
Chart 26. Cargo agents – “Ranking” Brazil (2004-2006) Mooring of ships in port of Fortaleza18
Chart 27. Mooring of ships in the port of Fortaleza (2004-2006) ..........................................................25
Chart 28. General data on the port of Fortaleza............................................................................................27
Chart 29. Mooring of ships in the port of Pecém...........................................................................................29
Chart 30. Movement of full and empty containers ........................................................................................30
Chart 31. Movement of containers, long course and coastal trade .......................................................30
Chart 32. General condensed data on the port of Pecém .........................................................................31
Chart 33. Characteristics of the Pinto Martins Airport...............................................................................33
Chart 34. Highway situation by jurisdiction (Km) 2006...............................................................................34
Chart 35. Prior CARANA/USAID statistical studies and problems encountered...........................38
Chart 36. Selected products ....................................................................................................................................40
Chart 37. Corridors studied....................................................................................................................................41
Chart 38. Definition of logistical stages...............................................................................................................42
Chart 39. Definition of categories of logistical costs ....................................................................................43
Chart 40. Average productivity of selected ports in Latin America.......................................................45
Chart 41. Productivity for loading and offloading, impact on the ship owner (Ceará
2006)..............................................................................................................................................................46
Chart 42. Cost of land transport...........................................................................................................................47
Chart 43. Interviews performed.............................................................................................................................48
Chart 44. Categories of data observed and calculated for the export process ............................. 50
Chart 45. Principal countries of destination for Ceará exports of shoes in 2006...........................51
Chart 46. Logistical costs of exportation of shoes ........................................................................................53
Chart 47. Responsibility for extra costs of exporting shoes.....................................................................54
Chart 48. Principal countries of destination for Ceará exports of cashews-2006...........................58
Chart 49. Logistical costs of exportation of cashews...................................................................................60
Chart 50. Responsibility for extra costs of exporting cashews................................................................61
Chart 51. Principal countries of destination for Ceará exports of frozen shrimp-2006...............65
Chart 52. Logistical costs of exporting frozen shrimp .................................................................................67
Chart 54. Principal countries of destination for Ceará exports of fresh melons-2006.................72
Chart 55. Logistical costs of exportation of fresh melons..........................................................................74
Chart 56. Responsibility for extra costs of exporting fresh melons ......................................................75
Chart 57. Principal countries of destination for Ceará exports of apparel-2006.............................79
Chart 58. Logistical costs of exporting apparel ...............................................................................................81
Chart 59. Responsibility for extra costs of exporting apparel..................................................................82
Chart 60. Principal countries of origin for imports of cotton-2006.......................................................85
Chart 61. Logistical costs of importation of cotton ......................................................................................87
Chart 62. Responsibility for extra costs of importing cotton ...................................................................88
Chart 63. Report - Total FOB costs for cargo (inter-sector analysis)..................................................93
Chart 64. Report - Extra costs added to optimized cost (2006).............................................................94
Chart 65. Total extra cost by sector (2006) ....................................................................................................94
Chart 66. Most significant extra costs by product/corridor (2006).......................................................95
Chart 67. Extra costs due to lack of security...................................................................................................97
Chart 68. Average amount of applied freightage............................................................................................99
Chart 69. Extra cost by sector and by stage...................................................................................................100
Chart 70 Total extra costs per activity generated in the pre-shipment/post-shipment
stage (Ceará, 2006)...............................................................................................................................102
Chart 71. Total extra costs per activity generated in the transport stage........................................102
Chart 72. Total extra costs per activity generated at the port stage
(Ceará, 2006)...........................................................................................................................................105
Chart 73. Total extra costs per activity generated at the customs stage
(Ceará, 2006)...........................................................................................................................................107
Chart 74. Total extra costs per activity generated at the maritime/air stage (Ceará,
2006)............................................................................................................................................................110
Chart 75. Exports of the state of Ceará by transport modality, 2006................................................112
Chart 76. Imports of the state of Ceará by transport modality, 2006................................................113
Chart 77. Calculated extra costs for Ceará foreign trade - 2006.........................................................113
Chart 78. Evolution of container movement at the ports of Fortaleza and
Pecém vs. all of Brazil (2001-2006), in TEU...............................................................................143
Chart 79. Average desired productivity for loading and offloading of containers as a
function of the equipment and amount of movement...........................................................145
Chart 80. Simulation - common parameters ..................................................................................................148
Chart 81. Comparative data - freight forwarders X express services (20 kg) ................................148
Chart 82. Comparative data - freight forwarders X express services (70 kg) ................................149
Chart 83. Exports of the state of Ceará – 2006 ...........................................................................................150
Chart 84. Extra costs by product - 2006 (US$/ton)....................................................................................150
Chart 85. Percentage of extra costs by cost category...............................................................................150
Chart 86. Extra costs for exports (1) – macro level (Ceará, 2006).....................................................151
Chart 87. Imports of the state of Ceará – 2006...........................................................................................151
Chart 88. Extra costs for cotton – 2006 ..........................................................................................................151
Chart 89. Percentage of extra costs by cost category...............................................................................152
Chart 90. Extra costs for imports (1) - macro level (Ceará, 2006)......................................................152
LIST OF FIGURES
FIGURE 1. Structure of the exportation and importation processes......................................................xiv
FIGURE 2. Rates of growth (%) PIB - Ceará and Brazil - 1990-2005..........................................................4
FIGURE 3. Annual variation (%) in Ceará exports, 2000-2006......................................................................8
FIGURE 4. Companies active in foreign trade in the state of Ceará -2005 ..........................................12
FIGURE 5. Evolution of modes of transport in Ceará foreign trade (1997-2006).............................13
FIGURE 6. Scheme for contracting of regular line services (container gate) – Pecém
terminal.........................................................................................................................................................28
FIGURE 7. Times involved in port operations ...................................................................................................32
FIGURE 8. Structure of the processes of exportation and importation ................................................41
FIGURE 9. Total time for the process of exportation of shoes.................................................................52
FIGURE 10. Percentage of extra costs for exportation of shoes.................................................................55
FIGURE 11. Analysis of costs by stage of exportation of shoes ...................................................................56
FIGURE 12. Macro analysis of costs for the exportation of shoes..............................................................57
FIGURE 13. Total time for the process of exportation of cashews............................................................59
FIGURE 14. Percentage of extra costs for exportation of cashews...........................................................62
FIGURE 15. Analysis of costs by stage of exports of cashews......................................................................63
FIGURE 16. Macro analysis of costs for the exportation of cashews ........................................................64
FIGURE 17. Total time for the process of exportation of frozen shrimp................................................66
FIGURE 18. Percentage of extra costs for exportation of frozen shrimp................................................69
FIGURE 19. Analysis of costs by stage of exports of frozen shrimp...........................................................70
FIGURE 20. Macro analysis of costs for the exportation of frozen shrimp .............................................71
FIGURE 21. Total time for the process of exportation of fresh melons..................................................73
FIGURE 22. Percentage of extra costs for the exportation of fresh melons..........................................76
FIGURE 23. Analysis of costs by stage of exports of fresh melons.............................................................77
FIGURE 24. Macro analysis of costs for the exportation of fresh melons...............................................78
FIGURE 25. Total time for the process of exportation of apparel..............................................................80
FIGURE 26. Percentage of extra costs for the exportation of apparel .....................................................82
FIGURE 27. Analysis of costs by stage of exports of apparel ........................................................................83
FIGURE 28. Macro analysis of costs for the exportation of apparel ..........................................................84
FIGURE 29. Total time for the process of importation of cotton...............................................................86
FIGURE 30. Percentage of extra costs for the importation of cotton ......................................................89
FIGURE 31. Analysis of costs by stage of imports of cotton .........................................................................90
FIGURE 32. Macro analysis of costs for the importation of cotton............................................................91
FIGURE 33. Percentage of extra costs by stage.................................................................................................101
FIGURE 34. Evolution of container activity at the port of Fortaleza........................................................141
FIGURE 35. Evolution of container activity at the port of Pecém.............................................................142
FIGURE 36. Evolution of container activity at the ports of Fortaleza and Pecém..............................142
xi
• The average for logistical costs as compared with FOB value for the products and product
corridors studied reached 20.1% in 2006.
• The impact of the extra costs calculated in this study for the year 2006 exceeded US$10
million, of which US$7 million related to the five selected export corridors, and US$3 million to
the import corridor studied.
• At the macro level, extrapolating these extra costs to all of the foreign trade of Ceará, the
impact amounts to US$43 million for 2006, equivalent to 2% of Ceará’s foreign trade for that
year.
•
EXECUTIVE SUMMARY
The changes that have occurred in the national economic scenarios -- for example, the opening up of
the Brazilian economy that began in 1990 -- as well as at the international level, such as the
intensification of globalization and the surge of Mercosul in 1991, have contributed to the fact that the
states of Brazil have been seeking a greater role in the worldwide economy. Under this scenario, and
beginning in the ‘90s, we have witnessed a more incisive effort within the state of Ceará in the areas of
governmental management, economic modernization and innovation in public policies, and in more
recent years, in a search for a greater role to be played by Ceará in the global context. With regard to
foreign trade, and according to data from the Ministry of Development, Industry and Foreign Trade of
Brazil (MDIC), the exports of Ceará amounted to US$957 million in 2006, with an average monthly
amount of US$79.7 million, an increase of 2.86% as compared with 2005.
Considering the relevance of exports as they relate to the generation of jobs and income, and the loss
of overseas sales by Ceará in the past four years, a critical and objective evaluation of Ceará’s foreign
trade becomes essential. In this sense, the worldwide trend toward the integration and globalization of
trade, which has become stronger over time, makes it necessary to improve the quality of international
logistics and the facilitation of trade, which both depend increasingly on the competitiveness overseas of
the state's regions, as well as the importance of logistics with regard to the present situ ation. With this
in mind, the present study of the extra costs relating to Ceará’s international logistics was developed.
International logistics plays a fundamental role with regard to agility, and increased
competitiveness of overseas sales from all of our regions. Thus, the objective of this study is to
identify and quantify, in a monetary sense, the losses that have been verified with respect to six selected
logistical corridors, analyzing the trail followed by merchandise from the factory to the port or airport
of destination, and to present recommendations as to how to mitigate those losses, with a view to
providing exporters with updated information on this matter, which may be useful as an orientation
toward the reduction of expenses, with a resulting gain in international competitiveness, and as a guide
to logistical costs for those who want play a part in the overseas market.
The extreme importance of logistics in foreign trade. The results of this quantitative and
independent analysis clearly demonstrate that logistical costs are extremely important as they relate to
the competitiveness of Ceará’s foreign trade:
It happens that the obstacles are many, and the direction taken by the actions of the public and private
sectors would need to be basedupon a more precise diagnosis, based upon greater content relating to
the Ceará export sector, so that such initiatives are aimed at expansion, in a sustained form, of the
volume of foreign sales, diversification of the guidelines for manufactured products with greater added
value, the reduction of dependence on just a few market buyers and the amplification of the number of
small- and medium-sized export companies. Some of the difficulties observed are listed below:
xii
• bureaucratic and tax impediments to the exporting process;
• a growing rise in protectionist barriers, including some that are not tax-related;
• super-valuation of the real as compared to the US dollar;
• a fragile export culture among the exporters;
• low intensity of commercial marketing;
• concentration upon only a few markets of destination;
• the growing participation of China as an export market within the worldwide scenario,
affecting Brazil, and Ceará in particular, within the textile industry;
• obstacles and high costs relating to logistics, and the marketing of merchandise;
• difficulties in doing business and in access to credit1, and
• a reduced number of export companies.
Products and Corridors Selected
For this study, the products shown in the chart below were selected:
TABLE 1. SELECTED PRODUCTS
Selected Products Pcntge. 2005 (%) Pcntge. 2006 (%)
1 Shoes 22,05% 24,84%
2 Cashew nuts 14,67% 14,23%
3 Shrimp 6,67% 5,35%
4 Melons 4,80% 5,17%
5 Apparel 2,77% 0,94%
TOTAL 50,96% 50,53%
6 Cotton(importation) 3,45% 4,36%
Source: MIDIC / Secex
Shoes, cashew nuts and fruits were immediately chosen. The first two are easily justified by their weight
relating to Ceará exports; together, they represented 39% of everything Ceará sold to the rest of the
world in 2006. The export of fresh melons, in turn, has been growing quite a bit, and has the peculiarity
of requiring refrigerated containers. Ceará exports 50% of all fruits sold by Brazil.
Despite the fact that freight is not a significant component of the export price of frozen shrimp, as a
function of its high price per kilogram, the sector was chosen for the following reasons: i) its aspects
also affect the lobster and fish sectors (important sectors of the Ceará economy); ii) the sector involves
small producers; iii) it utilizes reefer containers (the cargo must be frozen), and iv) Ceará has natural
features that are favorable to the sector, such as the amount of sun, its waters and the winds.
Also with regard to exports, apparel completes the set of products selected. Although it represents
only about 3% of Ceará’s total exports, this sector involves micro and small companies; it is a great
generator of jobs, it has a freight value that is significant in relation to the merchandise. In addition, this
1 World Bank report, Doing Business in Brazil, 2006, classified Ceará in last place among 13 selected states. The study
compares, among others, the processes of creating companies, obtaining credit and the payment of taxes.
xiii
is a manufactured product, like shoes, and it makes use of air transport, and finally, this is a highly visible
job category in our state.
The five products selected represented more than 50% of total exports of Ceará in 2006.
Considering that the textile industry in Ceará is a large consumer of cotton for the production of
thread and cloth, and that it is a sector of great importance to the Ceará economy, the importation of
cotton was included in this study.
Having chosen the products, we selected the five corridors for exportation and one for importation, as
follows:
TABLE 2. CORRIDORS STUDIED
Products Exp/ Imp Via Origin Destination
Shoes Exp Marítime Pecém Altamira (MEX)
Cashew nuts Exp Marítime Pecém Norfolk (EUA)
Frozen Shrimp Exp Marítime Fortaleza Algeciras (ESP)
Melons Exp Marítime Pecém Rotterdam (HOL)
Apparel Exp Air Fortaleza Lisboa (POR)
Cotton Imp Marítime Houston (USA) Pecém
Source: CARANA Corporation Analysis, 2007
Identification of Costs and Times
Below, and with the objective of identifying and quantifying the costs and times involved in the logistical
chains included in this study, we initially developed a structure with all the steps involved in these
selected processes of exportation and importation, grouped in stages, in accordance with the type of
transport, which was utilized in obtaining information on costs and times for each activity. Although the
processes vary as a function of the mode of transport used, care was given in a search for a standard
structure of activities and steps that was adapted to the different characteristics of the corridors. Each
structure of the models elaborated shows the movement of the merchandise from the producer to the
purchaser, in the case of exports, and from the receiving port to the factory in Ceará, in the case of
imports, for each of the products and corridors selected.
14
Ceará
Country
Of
Origin
Ceará
Pre-shipping Land
Transport
Airport Customs Maritime
Transport
Billing
Inventory and Financial Costs
Country
of
Destination
Maritime
Transport
Customs Post-
Offloading
Land
Transport
Port
BillingLand
Transport
Airport Customs Maritime
Transport
Pre-shipping
Inventory and Financial Costs
Inventory and Financing Costs
Ceará
Country
of
Destination
Structure of the Exportation Process (Maritime Mode)
Structure of the Importation Process (Maritime Mode)
Structure of the Exportation Process (Air Mode)
FIGURE 1. STRUCTURE OF THE PROCESSES OF IMPORTATION AND EXPORTATION
Source: CARANA Corporation, 2007
15
TABLE 3. DEFINITION OF THE LOGISTICAL STAGES STUDIED
STAGE DEFINITION
Pre-shipping/
Post-offloading
The pre-shipping activities include consolidation, packaging and
warehousing of the products, and any other actions necessary or
performed prior to sending the merchandise to its final destination. In
the case of importation of cotton, the post-offloading stage includes
payment activities and administration of the operation.
Land Transport Refers basically to transport of the empty container to the exporter
and the domestic land freight from the exporter’s factory to the port
or to any consolidation locale that is part of the process.
Port Includes the activities of delivering the loaded container to the port,
operation/mooring of the ship and warehousing in the case of
importation of cotton.
Customs Covers the activities relating to the offloading of merchandise for
shipment overseas (exportation) or for nationalization of the
merchandise (importation). Includes certifications and inspections
required by the client or by the importing country.
Transport to Destination
(Marítime or Air)
Involves transportation to the destination and the processing of the
documentation.
Invoicing Includes signing the exchange contract, issuance of the letter of credit
and the delivery of documents abroad (courier).
Source: CARANA Corporation, 2007
The costs generated in the stages and activities described above were classified in accordance with the
categories shown in the following chart:
TABLE 4. DEFINITION OF THE LOGISTICAL COST CATEGORIES STUDIED
COST CATEGORIES DEFINITION
Direct Costs Includes amounts actually paid for activities carried out, by stage.
Indirect Costs
(Inventory and Financial
Costs)
The indirect costs do not involve the disbursement of amounts. They
are divided between inventory and financial costs. They are the result
of sitting cargo and of delays (inventory costs) and of lost profits
relating to the truck (financial costs). The inventory costs are based
upon the study by Hummels, commented upon where appropriate.
Extra Costs
(Direct and Indirect)
Extra costs of the process are those that do not contribute to the
achievement of the major logistical goal, which is to transport the
product of the exporter to its destination in an efficient fashion. The
extra costs are calculated throughout all of the processes of
exportation and importation, and include unnecessary direct costs,
over and above all indirect costs.
Source: CARANA Corporation, 2007
Primary Results
16
The calculated extra costs for the year 2006, for each of the sectors studied, are shown in the following
chart; they totaled USD10,553,712.72.
TABLE 5. CALCULATED EXTRA COSTS BY STAGES OF THE EXPORTATION
AND IMPORTATION PROCESSES (2006)
STAGE
CALCULATED EXTRA
COSTS
(IN US$)
%
Pre-shipment / Post-offloading 439.896,18 4,2%
Land Transport 2.859.775,72 27,1%
Port / Airport 1.807.981,36 17,1%
Customs 1.091.165,46 10,3%
Marítime / Air Transport 4.354.894,00 41,3%
TOTAL 10.553.712,72 100%
Source: CARANA Corporation, 2007
This impact is very significant for Ceará, and represents an obstacle to development, limiting the
expansion of the state's foreign trade and its possibilities for the reduction of poverty. These extra costs
directly affect the competitiveness of exports, and have a negative impact on Ceará wages, bearing in
mind that export companies transfer to their employees and their producers the losses identified here.
On the importation side, the extra costs are transferred to final consumers and to products with
imported components destined for foreign trade, signifying an additional loss of competitiveness. These
extra costs have a strong economic and social impact.
In this sense, the proposal of the study is, above all, to offer opportunities for an increase in overseas
competitiveness for the companies involved in foreign trade, indicating the stages that should be
examined on a priority basis, with a view to the reduction of logistical costs, and a consequent increase
in international competitiveness. The study does not exhaust the evaluations of logistical costs, and
should be a basis for new studies of this kind, but bearing in mind that, although the study has indicated
all of the costs involved in the selected logistical chains, it is limited to an analysis of the extra costs.
To provide a better view of the distribution of these extra costs, Chart 6 below presents the most
significant extra costs (about 80% of the total of the extra costs) that impact the logistical chain for each
of the sectors analyzed. At each step in the process, activities are listed that contributed most to an
impact of approximately US$10 million and extra costs for the merchandise moved in 2006 by the
sectors studied herein. This analysis provides the exporter/importer with information that permits an
orientation toward the concentration of efforts on the principal activities that generate extra costs.
17
TABLE 6. MOST SIGNIFICANT EXTRA COSTS BY PRODUCT / CORRIDOR (2006)
Product Corridor Stage Most Significant Extra Costs
Estimated Impact on
the Volume Moved in
2006 (US$)
% of Total
Extra Costs
Cotton importation / marítime Maritime Transport Demurrage 1.742.143,51 54,8%
Port Loading and unloading - warehouse 338.760,70 10,7%
Maritime Transport NIC and Release of BL 278.621,16 8,8%
Customs ICMS grant to Sefaz/Cesut 226.855,48 7,1%
Shoes exportation / marítime Land Transport Logistical operator service 395.290,98 21,4%
Land Transport Freight Terminal for Empties > CD > Port 373.923,90 20,3%
Maritime Transport Awaiting shipment 291.508,02 15,8%
Port Ship mooring / port operation 250.130,50 13,6%
Pre-shipping Loading of truck 123.793,40 6,7%
Customs Customs inspection/SRF 70.375,70 3,8%
Shrimp exportation / marítime Port Ship mooring / port operation 211.415,28 47,6%
Pre-shipping Loading of container 83.747,25 18,9%
Pre-shipping Issuance – International Certificate (UVAGRO) 32.506,34 7,3%
Customs Form A - Certificate of Origin 25.9 30,63 5,8%
Customs Health oversight document (MAPA) 25.930,63 5,8%
Melons exportation / marítime Land Transport Road conditions - losses 1.334.809,92 60,1%
Land Transport Transport of empties > Farm > Port 276.655,58 12,5%
Port Ship mooring / port operation 222.176,52 10,0%
Cashews exportation / marítime Maritime Transport Waiting for shipment 1.898.995,28 68,2%
Port Ship mooring / port operation 343.764,72 12,3%
Customs Gathering of inspected containers (13/cont) 68.231,28 2,5%
Apparel exportation / air Pre-shipping Processing for remittance 28.928,20 35,9%
Customs Form A - Certificate of Origin 26.861,90 33,3%
Air Transport Waiting for shipment 22.729,30 28,2%
Total - Most Significant Extra Costs 8.694.086,18 82,4%
Source: CARANA Corporation analysis, 2007
18
No longer relating to products individually, as in the above chart, Chart 7 below identifies the 15
principal calculated extra costs for all of the products included in this study, which total 92% of
everything analyzed.
TABLE 7. 15 ACTIVITIES RESPONSIBLE FOR THE MAJOR PORTION OF THE
EXTRA COSTS IDENTIFIED IN THE STUDY
TOTALACTIVITY STAGE
US$ %
Waiting for shipment Maritime/Air Transport 2.307.804,98 23,77%
Demurrage Maritime/Air Transport 1.742.143,51 17,95%
Road conditions - losses Land Transport 1.334.809,92 13,75%
Mooring of ship/port operation Port 1.183.545,32 12,19%
Transport of Empties > CD (factory)
> Port
Land Transport
660.199,70 6,80%
Logistical service operator Land Transport 395.290,98 4,07%
Loading of truck
Pre-shipment/
Post-offloading
376.352,45 3,88%
Loading and unloading - warehousing Port 338.760,70 3,49%
NIC release of BL Maritime/Air Transport 278.621,16 2,87%
Granting of ICMS to SEFAZ/Cesut Customs 226.855,48 2,34%
Delivery of loaded container Port 201.432,04 2,08%
DI registration Customs 183.083,03 1,89%
Removal of empty container Land Transport 171.755,54 1,77%
Customs Inspection/SRF Customs 155.784,44 1,60%
Factory freight > CD or Port Land Transport 150.926,20 1,55%
SUBTOTAL OF THE 15 ACTIVITIES RESPONSIBLE
FOR THE MAJOR PORTION OF THE IDENTIFIED
EXTRA COSTS
9.707.365,45 91,98%
TOTAL EXTRA COSTS (31 ACTIVITIES IDENTIFIED
IN THE STUDY)
10.553.712,7
2
100,00%
Source: CARANA Corporation Analysis, 2007
The amounts of the extra costs identified in the selected corridors were extrapolated for the exports
and imports of the state of Ceará in 2006. The extrapolation of the extra costs relating to exports
considers those made in both the maritime and air modes, while those relating to imports only take into
account those using maritime transportation.
Chart 8 below shows the results of the extrapolation for Ceará’s foreign trade. It can be seen that the
costs for inventory represent 40.1%, while the extra financial and direct costs represent 59.9%.
19
CHART 8 - CALCULATED EXTRA COSTS IN CEARÁ FOREIGN TRADE – 2006
CALCULATED EXTRA COSTS (US$)
CORRIDOR
Inventory %
Financial &
Direct
% Total %
Importation (1) 6.543.416,16 6.558.141,75 13.101.557,91
Exportation (2) 10.831.112,24 19.348.737,92 30.179.850,16
TOTAL 17.374.528,40 40,1% 25.906.879,67 59,9% 43.281.408,07 100%
(1) containerized importation only
(2) containerized and air exportation only
Source: CARANA Corporation Analysis, 2007
The calculations of the total costs and the extra costs were made on the basis of an intense compilation
and processing of crossed data. This set of data, analyzed by the team of consultants, later served as the
basis for a critical evaluation with the management of the companies and entities involved. All who were
interviewed and involved in the process were then invited for discussions. The discussions were
restricted to the models, the conclusions, and the recommendations. The meeting resulted in important
changes relating to all of the corridors, made on the basis of the discussions held.
All of the results obtained are averages derived from the data supplied, and they serve merely for
reference purposes, since the times and costs of each operation involve private and confidential
commercial data from each company or entity; it is quite likely that there are no actual operations that
have the same values.
The values for these results are useful as parameters of reference, since they permit the arrival at
conclusions and recommendations based upon the averages. Also, by means of the methodology used, a
model for the evaluation and tracking of all logistical costs was made available to the companies.
This is not a “laboratory study” developed only by consultants. The development of the task involved
the very significant participation of businessmen in the private sector and of representatives of the
institutions. The conclusions of the study are based upon a broad range of opinions and data from the
private sector and the consultants, which are expressed in this report, with no censorship of any of the
sectors involved.
The support of the Federation of Industries of the State of Ceará (FIEC) was fundamental. Its openness
in exposing all of the problems, without omitting those that derive from inefficiencies in the private
sector, is a valuable attitude, and reflects a vocation of service to the general interest.
20
CHART 9. MAIN RECOMMENDATIONS OF THE STUDY – EXTRAPOLATED AMOUNTS FOR THE SECTORS
INCLUDED IN THIS STUDY
STAGE
AREA OF
OPPOR-TUNITY
TO LOWER
COSTS
EXTRA COSTS
TO BE
REDUCED US$
REMARKS MAIN RECOMMENDATIONS
Pre-shipment Organization of
foreign trade
operations
See remarks2
There have been cases in which the process of
exportation/importation is treated in a way that is similar to
that for domestic marketing. When this happens, the entire
process is delayed. Regarding foreign trade as an
extension of the domestic market is a mistake, and it makes
difficult the success of overseas sales and purchases. The
lack of planning and training are causes of this mistaken
view.
In order to prioritize the area of logistics in export
companies, it is recommended that a department of foreign
trade be established, covering the cells of
exportation/importation and company logistics so as to
fac ilitate business dealings. The preparation of a list of
activities, of a schedule, the indication of those who have
responsibility and the control of the processes by means of
an organized archive, as well as the production of statistics
on costs and time s would be assigned to this department.
Loading of
Containers
376,352.45 As a result of a lack of planning for the shipment of
merchandise overseas, referred to above, it can be seen
that the truck/container spends unnecessary time parked at
the factory. The price charged by the transporter includes
an additional sum in compensation for the down time, since
the truck could be used to generate more profit for its
owner.
? Negotiate discounts against the prices charged for the
utilization of the truck for a shorter time, restricted to what is
actually necessary.
? Schedule the request for the truck/container only when
the merchandise is ready to be shipped.
? Review the procedure for sending the container to the
port, so as to avoid its standing idle at the factory awaiting
loading.
? Institute a procedure for recording the waiting times and
the stay of the trucks so that goals are set.
Land
Transport
Highway
Infrastructure
2,020,892.46 The state highways, with the exception of those that
connect factories with the main roads, are in better
condition than the federal highways along which travel most
of the trucks loaded with merchandise for exportation.
As an alternative to improving the highways, we
recommend the commissioning of a study of the viability of
expanding the railway system for transporting products,
since this would avoid losses due to the leveling of the rails,
transport large volumes at reduced cost and potentially
attract companies by making it easier for them to bring their
products to market.
Coordination of
retrieval of
empty containers
171,755.54 The retrieval of empty containers is still considered as slow,
since on average, this activity requires 1.5 hours, while the
international standard suggests 30 minutes.
Better coordination in the process of retrieving empties is
recommended, as well as time schedules that quicken the
removal of equipment.
2 The lack of organization and planning for overseas operations affects the entire logistical chain, and causes various extra costs. Among others, the following can be cited:
extra costs resulting from delays in the loading process (all sectors except apparel), and in the shipping process (apparel), both of these measured in this study. See Item 5.2,
“Analysis of Extra Costs by Stage and Activity.”
21
Fruit
Consolidation
Center
864,812.00
(amount to be
saved if a food
consolidation
center is built)3
As mentioned in the above item, presently there is a need
for the removal of empty containers to the factory, creating
extra costs for the process.
Inspections by the Ministry of Agriculture, Livestock and
Supply (MAPA) and by the Secretariat of Federal Revenue
(SRF) occur at the port, except for fruits destined for the
US.
It is recommended that a study be made of the viability of
establishing a fruit consolidation center on the outskirts of
the port of Pecém, at which fruit will be deposited on pallets
and then transferred to containers, as in a cross-docking
operation. At this consolidation center it would also be
possible to carry out inspections, guaranteeing that
additional movements of the container within the port are
avoided; the cargo would be delivered to the port already
authorized for shipment. With these procedures, a great
many of the extra costs relating to the pre-shipment stage,
land transport and customs could be avoided.
Port Administration
and port
operations
1,183,545.32 Both the port of Fortaleza and the port of Pecém have a
structure that is capable of dealing with an increase in
volume of container movement. However, the existing
equipment and the infrastructure of the ports limit the speed
with which ships are handled, and can cause congestion,
and by extension, extra costs.
The main suggestion in this case would be the formation, at
both Fortaleza and Pecém, of a consortium for the
administration of an investment in an integrated container
terminal, permitting an adequate return on investment for
the management group, better quality of service provided
and more intensive usage, making possible a reduction in
costs.
Alternatives for
the development
of the ports in
the state of
Ceará
See remarks4
The port of Fortaleza, with respect to the operation of
containers, has a tool port operational model. This model is
not the best kind for attracting container operations or for
reducing the costs of ship owners and users. The tool port
model affects the quality and cost of services, since it gives
broad access to operating companies and maritime
agencies, so that they can participate in port operations
(activities alongside the ships and in the yard, reception and
delivery of containers), creating a certain level of intra-port
competition.
At the port of Pecém, despite the fact that loading and
unloading operations take place under a landlord model,
generating little intra-port competition, and the fact that
there is not an operational integration at the port, the
benefits are of little significance. Under the landlord model,
an operator assumes responsibility for the entire operation
(loading and unloading, transfer, the yard, reception and
delivery).
Do away with intra-port competition, and adopt a model of
competition between both ports.
Succinctly, they should:
? Discard the tool port model at both ports;
? Discard the intra-port competition;
? Establish a landlord model;
? Lease both ports, or raise public investment;
? Encourage competition between both ports.
Access to the
port
201,432.04 The delivery of containers at both ports is done with delays
that add extra costs to the operation. In a way, both the
delivery and the removal could be improved, so that the
ports have a constant flow, and the occurrence of
bottlenecks is avoided.
It is recommended that there be a restructuring of access to
the port using information technology, permitting
registration in advance of containers, of the operator and of
the truck driver prior to their arrival at the port; this would
enhance the checking of data in the system, and the
identification of the driver. With the information accessible
3
For details, see Item 5.4, “Recommendations” (Consolidation Center for Fruits– Case Study).
4
The low productivity of the port operation and the delay in the delivery of full containers, extra costs measured in this study, are related to the present administration models at the ports of Ceará. See
Item 5.2, “Analysis of Extra Costs by Stage and Activity.”
22
at the gate in digital form, and the possibility of checking
between the gate operator and the driver, right at the side
of the truck, it is estimated that the access time would be
reduced to competitive levels, with regional standards.
Ports of call in
Ceará
See remarks5
Since the ports of Ceará are the last ones for lines that
pass through Brazil, they suffer from problems relating to
faults in Brazilian port logistics. Frequent bottlenecks,
principally at the port of Santos, cause delays, and at times,
due to the delays, cancellation of services that Ceará
provides.
There is competition between the ports of Natal and
Pernambuco (Suape and Recife) for the cargo generated in
the region, causing a dilution of container volume to be
shipped, and making some ports of call unviable.
The solution for this restriction depends upon improvement
in port efficiency, which can be achieved through a
reduction in total times for the process, through better tariffs
that reduce the total cost of the process and by constant
improvement of the human resources that work in support
of foreign trade, facilitating the capture and the offloading of
cargo at the ports of Ceará. If this occurs, both the ship
owners and their agents, as well as the exporters of the
region, will evaluate the options for making their shipments
using the ports of Ceará, with a resulting increase in the
volume of cargo passing through the state, and in the
number of arriving ships.
Duration of stay
of containers in
the port
385,958.82 The practice of warehousing cotton containers in the yard
has been observed, as well as bales of cotton in the port’s
warehouses, after offloading from the ship, for periods that
average as much as 50 days. There is a reasonable period
of time for both storage and demurrage. The presence of
the product in this ambiance could result in inefficiencies of
port management, due to the occupation of space designed
for rapid circulation of general cargo, and space in the
container yard, probably causing a greater number of
operations for the stackers.
It is recommended that there be a reduction in the tax
exemption for storage and demurrage for periods of more
than 10 days and 5 days, respectively. Since there is an
operations contract entered into by the Union and
Cearáportos/Docas, extending the time period for free
storage, and ceding a discount on storage taxes, it is
suggested in this case that containers be segregated in the
yard so as to avoid delays in the daily operation of the
ports.
Customs Health and
customs
inspections
313,288.64 The activities of the entities that oversee the process of
importation and exportation of the Ceará ports have grown
with the evolution of foreign trade; there has been an effort
to make the inspections more efficient. This effort is
reflected mainly in the sectors of shrimp and melons,
studied
in this inquiry. However, in the other sectors included in
this study, it was observed that the extra costs were higher.
In the case of health inspections, it was noted that these
originated in the shrimp sector, and that extra costs were
eliminated; they were also quite reduced in the fruit sector,
particularly melons, which are produced for export, and are
inspected by the Ministry of Agriculture at the exporter’s site
when the ports of destination are in the US. However, in
the case of cotton and cashews, the extra costs have risen
due to the lack of a more efficient treatment.
We recommend the adoption of health inspec tions at the
plant, in the case of cashews, which can be made prior to
exportation by means of evaluations of Good Manufacturing
Practices (BPF) and Risk Analysis, Identification and
Control of Critical Points (ARCPC). With regard to
inspections of cotton, it would be necessary only to speed
up the process of verification of the containers following
their arrival at the port.
5
Delays and cancellations of moorings result in greater waiting times for shipment, an extra cost measured in this study. . See Item 5.2, “Analysis of Extra Costs by Stage and Activity.”
23
Customs
inspection at the
port for
importations
122,182.23 With a view to facilitating trade and international transpor t,
consideration must be given to the present worldwide
scenario, with a tendency toward the recommendation of a
minimization of customs inspections made in a systematic
or random manner at the port. Oversight has been
transferred to the factory of origin and to the final
destination of the goods shipped. In this way, the
inspections carried out at the ports are restricted exclusively
to those cases where crimes are suspected.
For imports, the mode suggested as best is to perform the
inspections at the receiving factory or at the deconsolidation
center, but in a selective fashion, establishing certain
criteria that take into account aspects of risk and
intelligence, and abandoning random inspections. The
installation of scanner equipment with high resolution at the
ports is regarded as the most appropriate and
recommendable approach.
Certification 137,335.53 It has been observed that the providing of the Certificate of
Origin, Form A, generates a logistical bottleneck for the
exporter, due to the time needed for its issuance and the
necessity for transport and anticipation of at least 24 hours.
Although it is similar to other certificates issued during the
exportation process, for example, the Health Certificate, it
becomes an extra cost to the extent that it generates an
unnecessary direct cost for the exporter. The health
certificate, in turn, generates an indirect cost, due to the
time needed for issuance and the necessity of previously
obtaining an international certificate after the container has
left the plant for the port.
The issuance of certificates can be sped up through the use
of information technology. By means of an internet system,
the exporter could issue a certificate of origin or a health
certificate, starting with the particular requirements for each
certificate. After issuance from an electronic site or at the
end of the exportation, the exporter would be obligated to
send the copies of the documents to the responsible issuing
entity, which would record them in the system at the
conclusion of the process. If this does not occur, the
exporter could not obtain another certificate, and he could
not make new shipments. He would also be taxed and
fined.
Processing of
documents
108,420.55 The time taken for the processing of documents at the port
or cargo terminal and at the airport is increased both by
congestion in the individual response of each entity and by
the need to wait for the setting of parameters on fixed
schedules.
It is recommended that the dealings at the ports and
airports be computerized, eliminating physical
documentation.
Customs agents See remarks6
There are difficulties and delays observed in this study
which can be corrected. Errors in filling out documents and
faults in communication between the agent and the
exporter/importer have entered the process, making it
slower.
It is recommended that the customs staff provide training
for the agents and in the exportation and importation
sectors of the companies, by means of groups of instructors
who would multiply the knowledge acquired directly from
those entities by interested parties and by participants in
Ceará’s foreign trade. We would also suggest the inclusion
of class registration for activities at the ports and airports
after prior approval in an open bidding process.
Maritime/air
Transport
Number of
ships/planes
2,307,804.98 Despite the fact that the number of ships anchored in 2006
at Fortaleza was about 500, which represents
approximately 10 ships per week, this does not represent
an increased number, even with an exported volume by sea
The existence of efficient ports, with an infrastructure
capable of handling a greater volume of exports catches the
attention of the ship owners and permits the broadening of
their line of services, serving the exporter or importer with
6
These costs are reflected in other stages of the logistical chains, and especially at the Customs stage, and are measured in this study. It is recommended that a specific study be made for the customs
agent. . See Item 5.2, “Analysis of Extra Costs by Stage and Activity.”
24
of almost US$ 900 million in the last year. The time
between the offloading of merchandise and the shipping of
that merchandise is important, due to the speed of
international trade and the needs of the importing client,
from the marketing point of view.
greater frequency. This, along with governmental actions in
broadening the poles for exportation, will lead to an
increase in the number of ships and a better
frequency/destination ratio.
Demurrage 1,742,143.51 The free time of demurrage offered by ship owners for
cargo destined for Europe, North America and even some
countries in South America is 5 days on average. In Brazil,
the practice of ship owners is to offer 10 free days of
demurrage, due to the time necessary for customs -related
offloading and to certain cultural aspects. In addition, a fact
worthy of note in this regard is the utilization of the port as a
relatively low cost option for the warehousing of cargo that
is not urgent to the production or marketing process of a
given industry, or even for purposes of postponing the
payment of taxes relating to the importation of the product.
It is recommended that the free time for demurrage and port
warehousing be reduced, with a view to promoting a more
efficient system for the offloading of imported cargo at the
ports.
Security Application of
international
practices for the
management
and security of
the ports of
Ceará.
1,396,187.54
(The amount that
could be saved if
recommendable
international
security
practices were
applied)
With regard to port security, it was verified that at both ports
(Pecém and Fortaleza), security relating to merchandise is
generally acceptable as compared with local parameters,
but it is not at the international level. Amplifying this
concept involves approval from the International Ship and
Port Facility Security (ISPS); the ports of Ceará do not have
certification at higher levels, nor do they have non-intrusive
detection equipment (scanners). In addition, the
operational models of the state’s ports (toolport) do not
make possible the implementation of international security
standards in the area of human resources.
The Container Security Initiative (CSI) is a treaty that
requires agreement among the signatory states. Since
Brazil and the United States have already formalized this
agreement, it would presumably be viable to advance its
implementation in the state of Ceará. With regard to the
“Structure of Standards for Assuring and Facilitating
International Trade,” of the World Customs Organization
(WCO), it is important to go forward in its broadcasting and
advertising, as well as in its eventual implementation. This
is a primary responsibility of the federal government.
There should be promotion of the application of the
Customs Trade Partnership Against Terrorism (CTPAT),
both at the ports and in the private sector, thus involving all
of the agents in the chain: exporter, transporter, port
operator, freight forwarder, maritime agency and port
terminal. In this respect, there should be propulsion from
different angles and orbits of a campaign for clarification,
demonstrating the benefits that would derive from its
adoption.
There is also a need for the establishment of customs
mechanisms and security of inspection of the plant of the
exporter, thereby avoiding, as much as possible,
interference between the physical inspection and the
document inspection at the port.

Mais conteúdo relacionado

Semelhante a USAID Ceara Transport and Logistics Executive Summary

Recent economic dvlp_sro_wa2012
Recent economic dvlp_sro_wa2012Recent economic dvlp_sro_wa2012
Recent economic dvlp_sro_wa2012Dr Lendy Spires
 
CEU No 5 - January 2013 - Final (English)
CEU No 5 - January 2013 - Final (English)CEU No 5 - January 2013 - Final (English)
CEU No 5 - January 2013 - Final (English)Raju Jan SINGH
 
Envestisman Dirèk Etranje nan Amerik Latinn e Karayib an 2019
Envestisman Dirèk Etranje nan Amerik Latinn e Karayib an 2019Envestisman Dirèk Etranje nan Amerik Latinn e Karayib an 2019
Envestisman Dirèk Etranje nan Amerik Latinn e Karayib an 2019Stanleylucas
 
Philippines economic-update-resuming-public-investment-fast-tracking-implemen...
Philippines economic-update-resuming-public-investment-fast-tracking-implemen...Philippines economic-update-resuming-public-investment-fast-tracking-implemen...
Philippines economic-update-resuming-public-investment-fast-tracking-implemen...KristelMorena
 
ECUADOR: DIVERSIFICATION AND SUSTAINABLE GROWTH IN AN OIL-DEPENDENT COUNTRY
ECUADOR: DIVERSIFICATION AND SUSTAINABLE GROWTH IN AN OIL-DEPENDENT COUNTRYECUADOR: DIVERSIFICATION AND SUSTAINABLE GROWTH IN AN OIL-DEPENDENT COUNTRY
ECUADOR: DIVERSIFICATION AND SUSTAINABLE GROWTH IN AN OIL-DEPENDENT COUNTRYAndresz26
 
Uneca af db-auc statistics for good economic governance, regional intergratio...
Uneca af db-auc statistics for good economic governance, regional intergratio...Uneca af db-auc statistics for good economic governance, regional intergratio...
Uneca af db-auc statistics for good economic governance, regional intergratio...Dr Lendy Spires
 
2015 : The Travel & Tourism Competitiveness Report Growth through Shocks
2015 : The Travel & Tourism Competitiveness Report Growth through Shocks2015 : The Travel & Tourism Competitiveness Report Growth through Shocks
2015 : The Travel & Tourism Competitiveness Report Growth through ShocksLausanne Montreux Congress
 
RMPresentation2023 (1).pdf
RMPresentation2023 (1).pdfRMPresentation2023 (1).pdf
RMPresentation2023 (1).pdfCésar Sobrino
 
Leveraging Public Private Partnerships for Trade Facilitation in CAFTA-DR Fin...
Leveraging Public Private Partnerships for Trade Facilitation in CAFTA-DR Fin...Leveraging Public Private Partnerships for Trade Facilitation in CAFTA-DR Fin...
Leveraging Public Private Partnerships for Trade Facilitation in CAFTA-DR Fin...Bobby Fraser
 
Georgia_-_FAO_Report_-_DFD-G-00-08000311-00
Georgia_-_FAO_Report_-_DFD-G-00-08000311-00Georgia_-_FAO_Report_-_DFD-G-00-08000311-00
Georgia_-_FAO_Report_-_DFD-G-00-08000311-00Nizam Al-Hussainy
 
Bid2000re262eng
Bid2000re262engBid2000re262eng
Bid2000re262engG Garcia
 
4th devlopment strategy online
4th devlopment strategy  online4th devlopment strategy  online
4th devlopment strategy onlineDr Lendy Spires
 
Illicit financial flows from africa hidden resources for development
Illicit financial flows from africa hidden resources for developmentIllicit financial flows from africa hidden resources for development
Illicit financial flows from africa hidden resources for developmentDr Lendy Spires
 
Volaris investor day presentation 2017
Volaris investor day presentation 2017Volaris investor day presentation 2017
Volaris investor day presentation 2017irvolaris
 
Volaris investor-day-presentation-2017-v final
Volaris investor-day-presentation-2017-v finalVolaris investor-day-presentation-2017-v final
Volaris investor-day-presentation-2017-v finalirvolaris
 
Fiscal Space and Financing for National Health Insurance in Botswana - Report
Fiscal Space and Financing for National Health Insurance in Botswana - ReportFiscal Space and Financing for National Health Insurance in Botswana - Report
Fiscal Space and Financing for National Health Insurance in Botswana - ReportHFG Project
 
Dr Dev Kambhampati | USTR: Foreign Trade Barriers- 2013 National Trade Estima...
Dr Dev Kambhampati | USTR: Foreign Trade Barriers- 2013 National Trade Estima...Dr Dev Kambhampati | USTR: Foreign Trade Barriers- 2013 National Trade Estima...
Dr Dev Kambhampati | USTR: Foreign Trade Barriers- 2013 National Trade Estima...Dr Dev Kambhampati
 

Semelhante a USAID Ceara Transport and Logistics Executive Summary (20)

Recent economic dvlp_sro_wa2012
Recent economic dvlp_sro_wa2012Recent economic dvlp_sro_wa2012
Recent economic dvlp_sro_wa2012
 
Ghana case study
Ghana case studyGhana case study
Ghana case study
 
CEU No 5 - January 2013 - Final (English)
CEU No 5 - January 2013 - Final (English)CEU No 5 - January 2013 - Final (English)
CEU No 5 - January 2013 - Final (English)
 
Envestisman Dirèk Etranje nan Amerik Latinn e Karayib an 2019
Envestisman Dirèk Etranje nan Amerik Latinn e Karayib an 2019Envestisman Dirèk Etranje nan Amerik Latinn e Karayib an 2019
Envestisman Dirèk Etranje nan Amerik Latinn e Karayib an 2019
 
Philippines economic-update-resuming-public-investment-fast-tracking-implemen...
Philippines economic-update-resuming-public-investment-fast-tracking-implemen...Philippines economic-update-resuming-public-investment-fast-tracking-implemen...
Philippines economic-update-resuming-public-investment-fast-tracking-implemen...
 
ECUADOR: DIVERSIFICATION AND SUSTAINABLE GROWTH IN AN OIL-DEPENDENT COUNTRY
ECUADOR: DIVERSIFICATION AND SUSTAINABLE GROWTH IN AN OIL-DEPENDENT COUNTRYECUADOR: DIVERSIFICATION AND SUSTAINABLE GROWTH IN AN OIL-DEPENDENT COUNTRY
ECUADOR: DIVERSIFICATION AND SUSTAINABLE GROWTH IN AN OIL-DEPENDENT COUNTRY
 
0 - Full Report_21
0 - Full Report_210 - Full Report_21
0 - Full Report_21
 
Uneca af db-auc statistics for good economic governance, regional intergratio...
Uneca af db-auc statistics for good economic governance, regional intergratio...Uneca af db-auc statistics for good economic governance, regional intergratio...
Uneca af db-auc statistics for good economic governance, regional intergratio...
 
2015 : The Travel & Tourism Competitiveness Report Growth through Shocks
2015 : The Travel & Tourism Competitiveness Report Growth through Shocks2015 : The Travel & Tourism Competitiveness Report Growth through Shocks
2015 : The Travel & Tourism Competitiveness Report Growth through Shocks
 
41178802
4117880241178802
41178802
 
RMPresentation2023 (1).pdf
RMPresentation2023 (1).pdfRMPresentation2023 (1).pdf
RMPresentation2023 (1).pdf
 
Leveraging Public Private Partnerships for Trade Facilitation in CAFTA-DR Fin...
Leveraging Public Private Partnerships for Trade Facilitation in CAFTA-DR Fin...Leveraging Public Private Partnerships for Trade Facilitation in CAFTA-DR Fin...
Leveraging Public Private Partnerships for Trade Facilitation in CAFTA-DR Fin...
 
Georgia_-_FAO_Report_-_DFD-G-00-08000311-00
Georgia_-_FAO_Report_-_DFD-G-00-08000311-00Georgia_-_FAO_Report_-_DFD-G-00-08000311-00
Georgia_-_FAO_Report_-_DFD-G-00-08000311-00
 
Bid2000re262eng
Bid2000re262engBid2000re262eng
Bid2000re262eng
 
4th devlopment strategy online
4th devlopment strategy  online4th devlopment strategy  online
4th devlopment strategy online
 
Illicit financial flows from africa hidden resources for development
Illicit financial flows from africa hidden resources for developmentIllicit financial flows from africa hidden resources for development
Illicit financial flows from africa hidden resources for development
 
Volaris investor day presentation 2017
Volaris investor day presentation 2017Volaris investor day presentation 2017
Volaris investor day presentation 2017
 
Volaris investor-day-presentation-2017-v final
Volaris investor-day-presentation-2017-v finalVolaris investor-day-presentation-2017-v final
Volaris investor-day-presentation-2017-v final
 
Fiscal Space and Financing for National Health Insurance in Botswana - Report
Fiscal Space and Financing for National Health Insurance in Botswana - ReportFiscal Space and Financing for National Health Insurance in Botswana - Report
Fiscal Space and Financing for National Health Insurance in Botswana - Report
 
Dr Dev Kambhampati | USTR: Foreign Trade Barriers- 2013 National Trade Estima...
Dr Dev Kambhampati | USTR: Foreign Trade Barriers- 2013 National Trade Estima...Dr Dev Kambhampati | USTR: Foreign Trade Barriers- 2013 National Trade Estima...
Dr Dev Kambhampati | USTR: Foreign Trade Barriers- 2013 National Trade Estima...
 

Último

Intermediate Accounting, Volume 2, 13th Canadian Edition by Donald E. Kieso t...
Intermediate Accounting, Volume 2, 13th Canadian Edition by Donald E. Kieso t...Intermediate Accounting, Volume 2, 13th Canadian Edition by Donald E. Kieso t...
Intermediate Accounting, Volume 2, 13th Canadian Edition by Donald E. Kieso t...ssuserf63bd7
 
WSMM Technology February.March Newsletter_vF.pdf
WSMM Technology February.March Newsletter_vF.pdfWSMM Technology February.March Newsletter_vF.pdf
WSMM Technology February.March Newsletter_vF.pdfJamesConcepcion7
 
Rakhi sets symbolizing the bond of love.pptx
Rakhi sets symbolizing the bond of love.pptxRakhi sets symbolizing the bond of love.pptx
Rakhi sets symbolizing the bond of love.pptxRakhi Bazaar
 
Strategic Project Finance Essentials: A Project Manager’s Guide to Financial ...
Strategic Project Finance Essentials: A Project Manager’s Guide to Financial ...Strategic Project Finance Essentials: A Project Manager’s Guide to Financial ...
Strategic Project Finance Essentials: A Project Manager’s Guide to Financial ...Aggregage
 
5-Step Framework to Convert Any Business into a Wealth Generation Machine.pdf
5-Step Framework to Convert Any Business into a Wealth Generation Machine.pdf5-Step Framework to Convert Any Business into a Wealth Generation Machine.pdf
5-Step Framework to Convert Any Business into a Wealth Generation Machine.pdfSherl Simon
 
How to Conduct a Service Gap Analysis for Your Business
How to Conduct a Service Gap Analysis for Your BusinessHow to Conduct a Service Gap Analysis for Your Business
How to Conduct a Service Gap Analysis for Your BusinessHelp Desk Migration
 
Technical Leaders - Working with the Management Team
Technical Leaders - Working with the Management TeamTechnical Leaders - Working with the Management Team
Technical Leaders - Working with the Management TeamArik Fletcher
 
Planetary and Vedic Yagyas Bring Positive Impacts in Life
Planetary and Vedic Yagyas Bring Positive Impacts in LifePlanetary and Vedic Yagyas Bring Positive Impacts in Life
Planetary and Vedic Yagyas Bring Positive Impacts in LifeBhavana Pujan Kendra
 
Entrepreneurial ecosystem- Wider context
Entrepreneurial ecosystem- Wider contextEntrepreneurial ecosystem- Wider context
Entrepreneurial ecosystem- Wider contextP&CO
 
Introducing the Analogic framework for business planning applications
Introducing the Analogic framework for business planning applicationsIntroducing the Analogic framework for business planning applications
Introducing the Analogic framework for business planning applicationsKnowledgeSeed
 
Driving Business Impact for PMs with Jon Harmer
Driving Business Impact for PMs with Jon HarmerDriving Business Impact for PMs with Jon Harmer
Driving Business Impact for PMs with Jon HarmerAggregage
 
Unveiling the Soundscape Music for Psychedelic Experiences
Unveiling the Soundscape Music for Psychedelic ExperiencesUnveiling the Soundscape Music for Psychedelic Experiences
Unveiling the Soundscape Music for Psychedelic ExperiencesDoe Paoro
 
Darshan Hiranandani (Son of Niranjan Hiranandani).pdf
Darshan Hiranandani (Son of Niranjan Hiranandani).pdfDarshan Hiranandani (Son of Niranjan Hiranandani).pdf
Darshan Hiranandani (Son of Niranjan Hiranandani).pdfShashank Mehta
 
Simplify Your Funding: Quick and Easy Business Loans
Simplify Your Funding: Quick and Easy Business LoansSimplify Your Funding: Quick and Easy Business Loans
Simplify Your Funding: Quick and Easy Business LoansNugget Global
 
Psychic Reading | Spiritual Guidance – Astro Ganesh Ji
Psychic Reading | Spiritual Guidance – Astro Ganesh JiPsychic Reading | Spiritual Guidance – Astro Ganesh Ji
Psychic Reading | Spiritual Guidance – Astro Ganesh Jiastral oracle
 
How To Simplify Your Scheduling with AI Calendarfly The Hassle-Free Online Bo...
How To Simplify Your Scheduling with AI Calendarfly The Hassle-Free Online Bo...How To Simplify Your Scheduling with AI Calendarfly The Hassle-Free Online Bo...
How To Simplify Your Scheduling with AI Calendarfly The Hassle-Free Online Bo...SOFTTECHHUB
 
Implementing Exponential Accelerators.pptx
Implementing Exponential Accelerators.pptxImplementing Exponential Accelerators.pptx
Implementing Exponential Accelerators.pptxRich Reba
 

Último (20)

Intermediate Accounting, Volume 2, 13th Canadian Edition by Donald E. Kieso t...
Intermediate Accounting, Volume 2, 13th Canadian Edition by Donald E. Kieso t...Intermediate Accounting, Volume 2, 13th Canadian Edition by Donald E. Kieso t...
Intermediate Accounting, Volume 2, 13th Canadian Edition by Donald E. Kieso t...
 
WSMM Technology February.March Newsletter_vF.pdf
WSMM Technology February.March Newsletter_vF.pdfWSMM Technology February.March Newsletter_vF.pdf
WSMM Technology February.March Newsletter_vF.pdf
 
Rakhi sets symbolizing the bond of love.pptx
Rakhi sets symbolizing the bond of love.pptxRakhi sets symbolizing the bond of love.pptx
Rakhi sets symbolizing the bond of love.pptx
 
Strategic Project Finance Essentials: A Project Manager’s Guide to Financial ...
Strategic Project Finance Essentials: A Project Manager’s Guide to Financial ...Strategic Project Finance Essentials: A Project Manager’s Guide to Financial ...
Strategic Project Finance Essentials: A Project Manager’s Guide to Financial ...
 
5-Step Framework to Convert Any Business into a Wealth Generation Machine.pdf
5-Step Framework to Convert Any Business into a Wealth Generation Machine.pdf5-Step Framework to Convert Any Business into a Wealth Generation Machine.pdf
5-Step Framework to Convert Any Business into a Wealth Generation Machine.pdf
 
How to Conduct a Service Gap Analysis for Your Business
How to Conduct a Service Gap Analysis for Your BusinessHow to Conduct a Service Gap Analysis for Your Business
How to Conduct a Service Gap Analysis for Your Business
 
Technical Leaders - Working with the Management Team
Technical Leaders - Working with the Management TeamTechnical Leaders - Working with the Management Team
Technical Leaders - Working with the Management Team
 
Planetary and Vedic Yagyas Bring Positive Impacts in Life
Planetary and Vedic Yagyas Bring Positive Impacts in LifePlanetary and Vedic Yagyas Bring Positive Impacts in Life
Planetary and Vedic Yagyas Bring Positive Impacts in Life
 
Entrepreneurial ecosystem- Wider context
Entrepreneurial ecosystem- Wider contextEntrepreneurial ecosystem- Wider context
Entrepreneurial ecosystem- Wider context
 
Introducing the Analogic framework for business planning applications
Introducing the Analogic framework for business planning applicationsIntroducing the Analogic framework for business planning applications
Introducing the Analogic framework for business planning applications
 
The Bizz Quiz-E-Summit-E-Cell-IITPatna.pptx
The Bizz Quiz-E-Summit-E-Cell-IITPatna.pptxThe Bizz Quiz-E-Summit-E-Cell-IITPatna.pptx
The Bizz Quiz-E-Summit-E-Cell-IITPatna.pptx
 
Toyota and Seven Parts Storage Techniques
Toyota and Seven Parts Storage TechniquesToyota and Seven Parts Storage Techniques
Toyota and Seven Parts Storage Techniques
 
Driving Business Impact for PMs with Jon Harmer
Driving Business Impact for PMs with Jon HarmerDriving Business Impact for PMs with Jon Harmer
Driving Business Impact for PMs with Jon Harmer
 
Authentically Social - presented by Corey Perlman
Authentically Social - presented by Corey PerlmanAuthentically Social - presented by Corey Perlman
Authentically Social - presented by Corey Perlman
 
Unveiling the Soundscape Music for Psychedelic Experiences
Unveiling the Soundscape Music for Psychedelic ExperiencesUnveiling the Soundscape Music for Psychedelic Experiences
Unveiling the Soundscape Music for Psychedelic Experiences
 
Darshan Hiranandani (Son of Niranjan Hiranandani).pdf
Darshan Hiranandani (Son of Niranjan Hiranandani).pdfDarshan Hiranandani (Son of Niranjan Hiranandani).pdf
Darshan Hiranandani (Son of Niranjan Hiranandani).pdf
 
Simplify Your Funding: Quick and Easy Business Loans
Simplify Your Funding: Quick and Easy Business LoansSimplify Your Funding: Quick and Easy Business Loans
Simplify Your Funding: Quick and Easy Business Loans
 
Psychic Reading | Spiritual Guidance – Astro Ganesh Ji
Psychic Reading | Spiritual Guidance – Astro Ganesh JiPsychic Reading | Spiritual Guidance – Astro Ganesh Ji
Psychic Reading | Spiritual Guidance – Astro Ganesh Ji
 
How To Simplify Your Scheduling with AI Calendarfly The Hassle-Free Online Bo...
How To Simplify Your Scheduling with AI Calendarfly The Hassle-Free Online Bo...How To Simplify Your Scheduling with AI Calendarfly The Hassle-Free Online Bo...
How To Simplify Your Scheduling with AI Calendarfly The Hassle-Free Online Bo...
 
Implementing Exponential Accelerators.pptx
Implementing Exponential Accelerators.pptxImplementing Exponential Accelerators.pptx
Implementing Exponential Accelerators.pptx
 

USAID Ceara Transport and Logistics Executive Summary

  • 1. THE IMPACT OF TRANSPORT AND LOGISTICS COSTS IN SELECTED SECTORS OF CEARÁ’S FOREIGN TRADE April 2007 This document was prepared for the United States Agency for International Development (USAID) by CARANA Corporation, in collaboration with the Federation of Industries of the State of Ceará (FIEC)
  • 2. This document was prepared for the United States Agency for International Development (USAID) by David Schacht, Martin Sgut, Júlia Carvalhedo Studart, Rogério Couto Parente, Leopoldo Neto Nunes da Silva, Frederico Ponte and Luciana Mota Tomé, of the CARANA Corporation, under the LAC Trade III contract (Prime Contract No. GS-10F-0150K, Order No. EDG-M-00-02-00041). The information, conclusions, interpretations and opinions expressed in this publication are the responsibility of the authors, and they do not necessarily reflect the thinking of the United States Agency for International Development (USAID), nor of the Government of the United States of America. THE IMPACT OF TRANSPORT AND LOGISTICS COSTS IN SELECTED SECTORS OF CEARÁ’S FOREIGN TRADE
  • 3. PREFACE The United States Agency for International Development (USAID), through the consultant, the CARANA Corporation, made available to the Federation of the Industries of the State of Ceará (FIEC) the methodology for the identification and measurement of the logistical costs relating to the foreign marketing of products. The study, entitled “The Impact of the Logistical Costs in Selected Sectors of Ceará’s Foreign Trade,” was developed by local consultants, and reveals the status of the situation of the logistical corridors for six products, which together represent approximately 50% of Ceará’s foreign trade. The study identifies the logistical impediments to the processes of exportation or importation of those products, and quantifies the extra costs generated, which impact in a negative fashion on the international competitiveness of Ceará’s industry, and, as a result, on the state’s economy. Proposals of solutions to the problems encountered have relative importance for the state, in that competitiveness is not restricted to the internal formation of pricing, but also affects all of the external factors that influence costs assumed by any given company. With that in mind, this study offers to the companies, the entities and the government a tool for the analysis of logistical costs relating to exportation/importation, which will contribute substantially to an increase in the competitiveness abroad of Ceará’s economy. One entity concerned with these questions, FIEC, with the invaluable support of the USAID, thereby strengthens its position as a major entity in the industrial representation in the state of Ceará. Obviously, this study would not have been made, nor its conclusions reached, without the collaboration of a valuable group of individuals, companies and entities. Finally, the strategic joining of the entities involved in overseas trade that has been successful occurs with the commitment of all of the individuals involved in continuing to make their capabilities available, with a view to the full and continual improvement of the economy of the state, and consequently, of the improved livelihood of its inhabitants. The Northeast region of Brazil will receive quantitative and qualitative gains as soon as the methodology of the present study is replicated in the other units of the federation. FIEC remains at the disposal of the northeastern states which show interest in that regard. Roberto Proença de Macedo President of FIEC
  • 4.
  • 5. TABLE OF CONTENTS EXECUTIVE SUMMARY..............................................................................................................xi 1. THE GEOPOLITICAL SITUATION IN THE STATE OF CEARÁ.....................................1 1.1. BRIEF OVERVIEW OF THE CEARÁ ECONOMY .............................................3 1.1.1. Evolution..........................................................................................................................................3 1.1.2. Foreign Trade Performance in Ceará – 1997-2006.........................................................7 1.1.3. Ceará exports................................................................................................................................7 1.2. INTERNATIONAL TRADE ENTITIES IN CEARÁ..........................................10 1.2.1. Commercial Sector...................................................................................................................10 1.2.2. Transport......................................................................................................................................11 1.2.3. Government and Regulatory Agencies..............................................................................19 2. INTERNATIONAL LOGISTICS IN THE STATE OF CEARÁ..........................................23 2.1. IMPORTANCE OF LOGISTICS IN INTERNATIONAL TRADE...................23 2.2. INFRASTRUCTURE OF THE INTERNATIONAL PHYSICAL DISTRIBUTION (DFI) IN THE STATE OF CEARÁ ................24 2.2.1. Port System of state of Ceará...............................................................................................24 2.2.2. Port of Fortaleza........................................................................................................................25 2.2.3. Port of Pecém.............................................................................................................................27 2.2.4. Productivity of the ports of Pecém and Fortaleza (container operations)32 2.2.5. Pinto Marins Airport................................................................................................................33 2.2.6. Land transportation infrastructure......................................................................................34 2.2.7. Railroads.......................................................................................................................................34 3. METHODOLOGY..................................................................................................................37 3.1. PRIOR EXPERIENCE ..........................................................................................37 3.2. COVERAGE OF THE ANALYSIS......................................................................38 3.3. SELECTION OF PRODUCTS AND CEARÁ EXPORT CORRIDORS ..........40 3.4. DEFINITION OF THE STRUCTURE (STAGES/CATEGORIES OF COSTS)41 3.4.1. Stages .............................................................................................................................................42 3.4.2. Categories of costs...................................................................................................................42 3.4.3. Issues involving inventory costs............................................................................................43 3.4.4. Issues involving indirect costs relating to port operations and the mooring of vessels.....................................................................................................................44 3.4.5. Issues involving indirect costs relating to land transport............................................46 3.5. MAIN SOURCES OF INFORMATION..............................................................48 3.6. PROCESSING OF THE INFORMATION..........................................................48 4. RESULTS................................................................................................................................51 4.1. EXPORTATION OF SHOES – MARITIME MODE..........................................51
  • 6. 4.2. EXPORTATION OF CASHEW NUTS – MARITIME MODE..........................58 4.3. EXPORTATION OF FROZEN SHRIMP – MARITIME MODE........................65 4.4. EXPORTATION OF MELONS – MARITIME MODE.......................................72 4.5. EXPORTATION OF APPAREL – AIR MODE ..................................................79 4.6. IMPORTATION OF COTTON – MARITIME MODE......................................85 5. CONCLUSIONS AND RECOMMENDATIONS.................................................................93 5.1. SECTOR COMPARISONS..................................................................................94 5.1.1. Main common extra costs......................................................................................................96 5.1.2. Main extra costs exclusive to certain sectors.................................................................97 5.2. ANALYSIS OF EXTRA COSTS BY STAGE AND ACTIVITY........................99 5.2.1. Pre-shipment ............................................................................................................................101 5.2.2. Land transport..........................................................................................................................103 5.2.3. Airport and port......................................................................................................................104 5.2.4. Customs......................................................................................................................................106 5.2.5. Maritime/air transport...........................................................................................................109 5.3. MACRO-EXTRAPOLATION ANALYSIS OF EXTRA COSTS FOR CEARÁ FOREIGN TRADE..............................................................................................112 5.3.1. Exports........................................................................................................................................112 5.3.2. Imports........................................................................................................................................112 5.4. RECOMMENDATIONS.....................................................................................113 5.4.1. Pre-shipment.............................................................................................................................113 5.4.2. Land transport..........................................................................................................................115 5.4.3. Port...............................................................................................................................................119 5.4.4. Customs......................................................................................................................................123 5.4.5. Maritime/air transport...........................................................................................................128 5.4.6. Application of international practices for handling security in Ceará ports...........................................................................................................................129 GLOSSARY.................................................................................................................................135 BIBLIOGRAPHY........................................................................................................................137 APPENDICES.............................................................................................................................139 Appendix A: Evolution of containerized cargo in the Ceará port system....................................141 Appendix B: Simplified exportation............................................................................................................147 Appendix C: Extrapolation of extra costs................................................................................................150 Appendix D: Entities operating in Brazilian foreign trade...................................................................153 Appendix E: Operational process of Brazilian foreign trade.............................................................158 Appendix F: Results of the models.............................................................................................................162 ACKNOWLEDGMENTS...........................................................................................................181
  • 7. LIST OF CHARTS Chart 1. Select products ..........................................................................................................................................xii Chart 2. Corridors studied....................................................................................................................................xiii Chart 3. Definition of logistical stages studied ...............................................................................................xv Chart 4. Definition of categories of logistical costs studied ....................................................................xv Chart 5. Extra costs calculated by stage of export and import processes (2006) ........................xvi Chart 6. Most significant extra costs by product/card or (2006) ........................................................xvii Chart 7. Activities responsible for the major portion of extra costs identified in the study .xviii Chart 8. Extra costs calculated for Ceará foreign trade - 2006...........................................................xix Chart 9. Main recommendations of the study...............................................................................................xx Chart 10. Ceará data......................................................................................................................................................1 Chart 11. Transport time (hours) - air mode .....................................................................................................2 Chart 12. Transport time (days) - maritime mode...........................................................................................2 Chart 13. Selected products - percentage of exports - 2005-2006 ..........................................................6 Chart 14. Evolution of Ceará foreign trade, 1997-2006.................................................................................7 Chart 15. Ceará exports, Northeast, Brazil, 1997-2006................................................................................8 Chart 16. Amount of merchandise exported, selected states, 2000-2006............................................9 Chart 17. Comparison of Ceará export companies 2005-2006.................................................................9 Chart 18. Free rate of exchange - US dollar (buy) - period average ........................................................9 Chart 19. Comparison of Ceará import and export companies 2004-2005......................................11 Chart 20 Billings of companies involved in foreign trade-2005...............................................................11 Chart 21. Evolution of transportation modes in Ceará foreign trade -1997/2006 - percentage of volume (T).....................................................................................................................12 Chart 22. Transporters and fleet of vehicles ....................................................................................................13 Chart 23. Average highway freight for the ports of Pecém and Fortaleza, main exporting municipalities.........................................................................................................................14 Chart 24. Direct services offered in the Ceará ports ..................................................................................15 Chart 25. Transit time from Ceará to main ports of destination............................................................16 Chart 26. Cargo agents – “Ranking” Brazil (2004-2006) Mooring of ships in port of Fortaleza18 Chart 27. Mooring of ships in the port of Fortaleza (2004-2006) ..........................................................25 Chart 28. General data on the port of Fortaleza............................................................................................27 Chart 29. Mooring of ships in the port of Pecém...........................................................................................29 Chart 30. Movement of full and empty containers ........................................................................................30 Chart 31. Movement of containers, long course and coastal trade .......................................................30 Chart 32. General condensed data on the port of Pecém .........................................................................31 Chart 33. Characteristics of the Pinto Martins Airport...............................................................................33 Chart 34. Highway situation by jurisdiction (Km) 2006...............................................................................34 Chart 35. Prior CARANA/USAID statistical studies and problems encountered...........................38 Chart 36. Selected products ....................................................................................................................................40 Chart 37. Corridors studied....................................................................................................................................41 Chart 38. Definition of logistical stages...............................................................................................................42 Chart 39. Definition of categories of logistical costs ....................................................................................43 Chart 40. Average productivity of selected ports in Latin America.......................................................45 Chart 41. Productivity for loading and offloading, impact on the ship owner (Ceará 2006)..............................................................................................................................................................46 Chart 42. Cost of land transport...........................................................................................................................47 Chart 43. Interviews performed.............................................................................................................................48
  • 8. Chart 44. Categories of data observed and calculated for the export process ............................. 50 Chart 45. Principal countries of destination for Ceará exports of shoes in 2006...........................51 Chart 46. Logistical costs of exportation of shoes ........................................................................................53 Chart 47. Responsibility for extra costs of exporting shoes.....................................................................54 Chart 48. Principal countries of destination for Ceará exports of cashews-2006...........................58 Chart 49. Logistical costs of exportation of cashews...................................................................................60 Chart 50. Responsibility for extra costs of exporting cashews................................................................61 Chart 51. Principal countries of destination for Ceará exports of frozen shrimp-2006...............65 Chart 52. Logistical costs of exporting frozen shrimp .................................................................................67 Chart 54. Principal countries of destination for Ceará exports of fresh melons-2006.................72 Chart 55. Logistical costs of exportation of fresh melons..........................................................................74 Chart 56. Responsibility for extra costs of exporting fresh melons ......................................................75 Chart 57. Principal countries of destination for Ceará exports of apparel-2006.............................79 Chart 58. Logistical costs of exporting apparel ...............................................................................................81 Chart 59. Responsibility for extra costs of exporting apparel..................................................................82 Chart 60. Principal countries of origin for imports of cotton-2006.......................................................85 Chart 61. Logistical costs of importation of cotton ......................................................................................87 Chart 62. Responsibility for extra costs of importing cotton ...................................................................88 Chart 63. Report - Total FOB costs for cargo (inter-sector analysis)..................................................93 Chart 64. Report - Extra costs added to optimized cost (2006).............................................................94 Chart 65. Total extra cost by sector (2006) ....................................................................................................94 Chart 66. Most significant extra costs by product/corridor (2006).......................................................95 Chart 67. Extra costs due to lack of security...................................................................................................97 Chart 68. Average amount of applied freightage............................................................................................99 Chart 69. Extra cost by sector and by stage...................................................................................................100 Chart 70 Total extra costs per activity generated in the pre-shipment/post-shipment stage (Ceará, 2006)...............................................................................................................................102 Chart 71. Total extra costs per activity generated in the transport stage........................................102 Chart 72. Total extra costs per activity generated at the port stage (Ceará, 2006)...........................................................................................................................................105 Chart 73. Total extra costs per activity generated at the customs stage (Ceará, 2006)...........................................................................................................................................107 Chart 74. Total extra costs per activity generated at the maritime/air stage (Ceará, 2006)............................................................................................................................................................110 Chart 75. Exports of the state of Ceará by transport modality, 2006................................................112 Chart 76. Imports of the state of Ceará by transport modality, 2006................................................113 Chart 77. Calculated extra costs for Ceará foreign trade - 2006.........................................................113 Chart 78. Evolution of container movement at the ports of Fortaleza and Pecém vs. all of Brazil (2001-2006), in TEU...............................................................................143 Chart 79. Average desired productivity for loading and offloading of containers as a function of the equipment and amount of movement...........................................................145 Chart 80. Simulation - common parameters ..................................................................................................148 Chart 81. Comparative data - freight forwarders X express services (20 kg) ................................148 Chart 82. Comparative data - freight forwarders X express services (70 kg) ................................149 Chart 83. Exports of the state of Ceará – 2006 ...........................................................................................150 Chart 84. Extra costs by product - 2006 (US$/ton)....................................................................................150 Chart 85. Percentage of extra costs by cost category...............................................................................150 Chart 86. Extra costs for exports (1) – macro level (Ceará, 2006).....................................................151
  • 9. Chart 87. Imports of the state of Ceará – 2006...........................................................................................151 Chart 88. Extra costs for cotton – 2006 ..........................................................................................................151 Chart 89. Percentage of extra costs by cost category...............................................................................152 Chart 90. Extra costs for imports (1) - macro level (Ceará, 2006)......................................................152
  • 10. LIST OF FIGURES FIGURE 1. Structure of the exportation and importation processes......................................................xiv FIGURE 2. Rates of growth (%) PIB - Ceará and Brazil - 1990-2005..........................................................4 FIGURE 3. Annual variation (%) in Ceará exports, 2000-2006......................................................................8 FIGURE 4. Companies active in foreign trade in the state of Ceará -2005 ..........................................12 FIGURE 5. Evolution of modes of transport in Ceará foreign trade (1997-2006).............................13 FIGURE 6. Scheme for contracting of regular line services (container gate) – Pecém terminal.........................................................................................................................................................28 FIGURE 7. Times involved in port operations ...................................................................................................32 FIGURE 8. Structure of the processes of exportation and importation ................................................41 FIGURE 9. Total time for the process of exportation of shoes.................................................................52 FIGURE 10. Percentage of extra costs for exportation of shoes.................................................................55 FIGURE 11. Analysis of costs by stage of exportation of shoes ...................................................................56 FIGURE 12. Macro analysis of costs for the exportation of shoes..............................................................57 FIGURE 13. Total time for the process of exportation of cashews............................................................59 FIGURE 14. Percentage of extra costs for exportation of cashews...........................................................62 FIGURE 15. Analysis of costs by stage of exports of cashews......................................................................63 FIGURE 16. Macro analysis of costs for the exportation of cashews ........................................................64 FIGURE 17. Total time for the process of exportation of frozen shrimp................................................66 FIGURE 18. Percentage of extra costs for exportation of frozen shrimp................................................69 FIGURE 19. Analysis of costs by stage of exports of frozen shrimp...........................................................70 FIGURE 20. Macro analysis of costs for the exportation of frozen shrimp .............................................71 FIGURE 21. Total time for the process of exportation of fresh melons..................................................73 FIGURE 22. Percentage of extra costs for the exportation of fresh melons..........................................76 FIGURE 23. Analysis of costs by stage of exports of fresh melons.............................................................77 FIGURE 24. Macro analysis of costs for the exportation of fresh melons...............................................78 FIGURE 25. Total time for the process of exportation of apparel..............................................................80 FIGURE 26. Percentage of extra costs for the exportation of apparel .....................................................82 FIGURE 27. Analysis of costs by stage of exports of apparel ........................................................................83 FIGURE 28. Macro analysis of costs for the exportation of apparel ..........................................................84 FIGURE 29. Total time for the process of importation of cotton...............................................................86 FIGURE 30. Percentage of extra costs for the importation of cotton ......................................................89 FIGURE 31. Analysis of costs by stage of imports of cotton .........................................................................90 FIGURE 32. Macro analysis of costs for the importation of cotton............................................................91 FIGURE 33. Percentage of extra costs by stage.................................................................................................101 FIGURE 34. Evolution of container activity at the port of Fortaleza........................................................141 FIGURE 35. Evolution of container activity at the port of Pecém.............................................................142 FIGURE 36. Evolution of container activity at the ports of Fortaleza and Pecém..............................142
  • 11. xi • The average for logistical costs as compared with FOB value for the products and product corridors studied reached 20.1% in 2006. • The impact of the extra costs calculated in this study for the year 2006 exceeded US$10 million, of which US$7 million related to the five selected export corridors, and US$3 million to the import corridor studied. • At the macro level, extrapolating these extra costs to all of the foreign trade of Ceará, the impact amounts to US$43 million for 2006, equivalent to 2% of Ceará’s foreign trade for that year. • EXECUTIVE SUMMARY The changes that have occurred in the national economic scenarios -- for example, the opening up of the Brazilian economy that began in 1990 -- as well as at the international level, such as the intensification of globalization and the surge of Mercosul in 1991, have contributed to the fact that the states of Brazil have been seeking a greater role in the worldwide economy. Under this scenario, and beginning in the ‘90s, we have witnessed a more incisive effort within the state of Ceará in the areas of governmental management, economic modernization and innovation in public policies, and in more recent years, in a search for a greater role to be played by Ceará in the global context. With regard to foreign trade, and according to data from the Ministry of Development, Industry and Foreign Trade of Brazil (MDIC), the exports of Ceará amounted to US$957 million in 2006, with an average monthly amount of US$79.7 million, an increase of 2.86% as compared with 2005. Considering the relevance of exports as they relate to the generation of jobs and income, and the loss of overseas sales by Ceará in the past four years, a critical and objective evaluation of Ceará’s foreign trade becomes essential. In this sense, the worldwide trend toward the integration and globalization of trade, which has become stronger over time, makes it necessary to improve the quality of international logistics and the facilitation of trade, which both depend increasingly on the competitiveness overseas of the state's regions, as well as the importance of logistics with regard to the present situ ation. With this in mind, the present study of the extra costs relating to Ceará’s international logistics was developed. International logistics plays a fundamental role with regard to agility, and increased competitiveness of overseas sales from all of our regions. Thus, the objective of this study is to identify and quantify, in a monetary sense, the losses that have been verified with respect to six selected logistical corridors, analyzing the trail followed by merchandise from the factory to the port or airport of destination, and to present recommendations as to how to mitigate those losses, with a view to providing exporters with updated information on this matter, which may be useful as an orientation toward the reduction of expenses, with a resulting gain in international competitiveness, and as a guide to logistical costs for those who want play a part in the overseas market. The extreme importance of logistics in foreign trade. The results of this quantitative and independent analysis clearly demonstrate that logistical costs are extremely important as they relate to the competitiveness of Ceará’s foreign trade: It happens that the obstacles are many, and the direction taken by the actions of the public and private sectors would need to be basedupon a more precise diagnosis, based upon greater content relating to the Ceará export sector, so that such initiatives are aimed at expansion, in a sustained form, of the volume of foreign sales, diversification of the guidelines for manufactured products with greater added value, the reduction of dependence on just a few market buyers and the amplification of the number of small- and medium-sized export companies. Some of the difficulties observed are listed below:
  • 12. xii • bureaucratic and tax impediments to the exporting process; • a growing rise in protectionist barriers, including some that are not tax-related; • super-valuation of the real as compared to the US dollar; • a fragile export culture among the exporters; • low intensity of commercial marketing; • concentration upon only a few markets of destination; • the growing participation of China as an export market within the worldwide scenario, affecting Brazil, and Ceará in particular, within the textile industry; • obstacles and high costs relating to logistics, and the marketing of merchandise; • difficulties in doing business and in access to credit1, and • a reduced number of export companies. Products and Corridors Selected For this study, the products shown in the chart below were selected: TABLE 1. SELECTED PRODUCTS Selected Products Pcntge. 2005 (%) Pcntge. 2006 (%) 1 Shoes 22,05% 24,84% 2 Cashew nuts 14,67% 14,23% 3 Shrimp 6,67% 5,35% 4 Melons 4,80% 5,17% 5 Apparel 2,77% 0,94% TOTAL 50,96% 50,53% 6 Cotton(importation) 3,45% 4,36% Source: MIDIC / Secex Shoes, cashew nuts and fruits were immediately chosen. The first two are easily justified by their weight relating to Ceará exports; together, they represented 39% of everything Ceará sold to the rest of the world in 2006. The export of fresh melons, in turn, has been growing quite a bit, and has the peculiarity of requiring refrigerated containers. Ceará exports 50% of all fruits sold by Brazil. Despite the fact that freight is not a significant component of the export price of frozen shrimp, as a function of its high price per kilogram, the sector was chosen for the following reasons: i) its aspects also affect the lobster and fish sectors (important sectors of the Ceará economy); ii) the sector involves small producers; iii) it utilizes reefer containers (the cargo must be frozen), and iv) Ceará has natural features that are favorable to the sector, such as the amount of sun, its waters and the winds. Also with regard to exports, apparel completes the set of products selected. Although it represents only about 3% of Ceará’s total exports, this sector involves micro and small companies; it is a great generator of jobs, it has a freight value that is significant in relation to the merchandise. In addition, this 1 World Bank report, Doing Business in Brazil, 2006, classified Ceará in last place among 13 selected states. The study compares, among others, the processes of creating companies, obtaining credit and the payment of taxes.
  • 13. xiii is a manufactured product, like shoes, and it makes use of air transport, and finally, this is a highly visible job category in our state. The five products selected represented more than 50% of total exports of Ceará in 2006. Considering that the textile industry in Ceará is a large consumer of cotton for the production of thread and cloth, and that it is a sector of great importance to the Ceará economy, the importation of cotton was included in this study. Having chosen the products, we selected the five corridors for exportation and one for importation, as follows: TABLE 2. CORRIDORS STUDIED Products Exp/ Imp Via Origin Destination Shoes Exp Marítime Pecém Altamira (MEX) Cashew nuts Exp Marítime Pecém Norfolk (EUA) Frozen Shrimp Exp Marítime Fortaleza Algeciras (ESP) Melons Exp Marítime Pecém Rotterdam (HOL) Apparel Exp Air Fortaleza Lisboa (POR) Cotton Imp Marítime Houston (USA) Pecém Source: CARANA Corporation Analysis, 2007 Identification of Costs and Times Below, and with the objective of identifying and quantifying the costs and times involved in the logistical chains included in this study, we initially developed a structure with all the steps involved in these selected processes of exportation and importation, grouped in stages, in accordance with the type of transport, which was utilized in obtaining information on costs and times for each activity. Although the processes vary as a function of the mode of transport used, care was given in a search for a standard structure of activities and steps that was adapted to the different characteristics of the corridors. Each structure of the models elaborated shows the movement of the merchandise from the producer to the purchaser, in the case of exports, and from the receiving port to the factory in Ceará, in the case of imports, for each of the products and corridors selected.
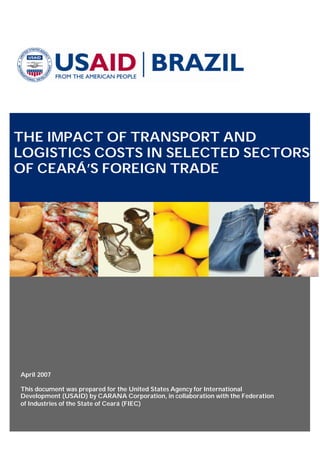
  • 14. 14 Ceará Country Of Origin Ceará Pre-shipping Land Transport Airport Customs Maritime Transport Billing Inventory and Financial Costs Country of Destination Maritime Transport Customs Post- Offloading Land Transport Port BillingLand Transport Airport Customs Maritime Transport Pre-shipping Inventory and Financial Costs Inventory and Financing Costs Ceará Country of Destination Structure of the Exportation Process (Maritime Mode) Structure of the Importation Process (Maritime Mode) Structure of the Exportation Process (Air Mode) FIGURE 1. STRUCTURE OF THE PROCESSES OF IMPORTATION AND EXPORTATION Source: CARANA Corporation, 2007
  • 15. 15 TABLE 3. DEFINITION OF THE LOGISTICAL STAGES STUDIED STAGE DEFINITION Pre-shipping/ Post-offloading The pre-shipping activities include consolidation, packaging and warehousing of the products, and any other actions necessary or performed prior to sending the merchandise to its final destination. In the case of importation of cotton, the post-offloading stage includes payment activities and administration of the operation. Land Transport Refers basically to transport of the empty container to the exporter and the domestic land freight from the exporter’s factory to the port or to any consolidation locale that is part of the process. Port Includes the activities of delivering the loaded container to the port, operation/mooring of the ship and warehousing in the case of importation of cotton. Customs Covers the activities relating to the offloading of merchandise for shipment overseas (exportation) or for nationalization of the merchandise (importation). Includes certifications and inspections required by the client or by the importing country. Transport to Destination (Marítime or Air) Involves transportation to the destination and the processing of the documentation. Invoicing Includes signing the exchange contract, issuance of the letter of credit and the delivery of documents abroad (courier). Source: CARANA Corporation, 2007 The costs generated in the stages and activities described above were classified in accordance with the categories shown in the following chart: TABLE 4. DEFINITION OF THE LOGISTICAL COST CATEGORIES STUDIED COST CATEGORIES DEFINITION Direct Costs Includes amounts actually paid for activities carried out, by stage. Indirect Costs (Inventory and Financial Costs) The indirect costs do not involve the disbursement of amounts. They are divided between inventory and financial costs. They are the result of sitting cargo and of delays (inventory costs) and of lost profits relating to the truck (financial costs). The inventory costs are based upon the study by Hummels, commented upon where appropriate. Extra Costs (Direct and Indirect) Extra costs of the process are those that do not contribute to the achievement of the major logistical goal, which is to transport the product of the exporter to its destination in an efficient fashion. The extra costs are calculated throughout all of the processes of exportation and importation, and include unnecessary direct costs, over and above all indirect costs. Source: CARANA Corporation, 2007 Primary Results
  • 16. 16 The calculated extra costs for the year 2006, for each of the sectors studied, are shown in the following chart; they totaled USD10,553,712.72. TABLE 5. CALCULATED EXTRA COSTS BY STAGES OF THE EXPORTATION AND IMPORTATION PROCESSES (2006) STAGE CALCULATED EXTRA COSTS (IN US$) % Pre-shipment / Post-offloading 439.896,18 4,2% Land Transport 2.859.775,72 27,1% Port / Airport 1.807.981,36 17,1% Customs 1.091.165,46 10,3% Marítime / Air Transport 4.354.894,00 41,3% TOTAL 10.553.712,72 100% Source: CARANA Corporation, 2007 This impact is very significant for Ceará, and represents an obstacle to development, limiting the expansion of the state's foreign trade and its possibilities for the reduction of poverty. These extra costs directly affect the competitiveness of exports, and have a negative impact on Ceará wages, bearing in mind that export companies transfer to their employees and their producers the losses identified here. On the importation side, the extra costs are transferred to final consumers and to products with imported components destined for foreign trade, signifying an additional loss of competitiveness. These extra costs have a strong economic and social impact. In this sense, the proposal of the study is, above all, to offer opportunities for an increase in overseas competitiveness for the companies involved in foreign trade, indicating the stages that should be examined on a priority basis, with a view to the reduction of logistical costs, and a consequent increase in international competitiveness. The study does not exhaust the evaluations of logistical costs, and should be a basis for new studies of this kind, but bearing in mind that, although the study has indicated all of the costs involved in the selected logistical chains, it is limited to an analysis of the extra costs. To provide a better view of the distribution of these extra costs, Chart 6 below presents the most significant extra costs (about 80% of the total of the extra costs) that impact the logistical chain for each of the sectors analyzed. At each step in the process, activities are listed that contributed most to an impact of approximately US$10 million and extra costs for the merchandise moved in 2006 by the sectors studied herein. This analysis provides the exporter/importer with information that permits an orientation toward the concentration of efforts on the principal activities that generate extra costs.
  • 17. 17 TABLE 6. MOST SIGNIFICANT EXTRA COSTS BY PRODUCT / CORRIDOR (2006) Product Corridor Stage Most Significant Extra Costs Estimated Impact on the Volume Moved in 2006 (US$) % of Total Extra Costs Cotton importation / marítime Maritime Transport Demurrage 1.742.143,51 54,8% Port Loading and unloading - warehouse 338.760,70 10,7% Maritime Transport NIC and Release of BL 278.621,16 8,8% Customs ICMS grant to Sefaz/Cesut 226.855,48 7,1% Shoes exportation / marítime Land Transport Logistical operator service 395.290,98 21,4% Land Transport Freight Terminal for Empties > CD > Port 373.923,90 20,3% Maritime Transport Awaiting shipment 291.508,02 15,8% Port Ship mooring / port operation 250.130,50 13,6% Pre-shipping Loading of truck 123.793,40 6,7% Customs Customs inspection/SRF 70.375,70 3,8% Shrimp exportation / marítime Port Ship mooring / port operation 211.415,28 47,6% Pre-shipping Loading of container 83.747,25 18,9% Pre-shipping Issuance – International Certificate (UVAGRO) 32.506,34 7,3% Customs Form A - Certificate of Origin 25.9 30,63 5,8% Customs Health oversight document (MAPA) 25.930,63 5,8% Melons exportation / marítime Land Transport Road conditions - losses 1.334.809,92 60,1% Land Transport Transport of empties > Farm > Port 276.655,58 12,5% Port Ship mooring / port operation 222.176,52 10,0% Cashews exportation / marítime Maritime Transport Waiting for shipment 1.898.995,28 68,2% Port Ship mooring / port operation 343.764,72 12,3% Customs Gathering of inspected containers (13/cont) 68.231,28 2,5% Apparel exportation / air Pre-shipping Processing for remittance 28.928,20 35,9% Customs Form A - Certificate of Origin 26.861,90 33,3% Air Transport Waiting for shipment 22.729,30 28,2% Total - Most Significant Extra Costs 8.694.086,18 82,4% Source: CARANA Corporation analysis, 2007
  • 18. 18 No longer relating to products individually, as in the above chart, Chart 7 below identifies the 15 principal calculated extra costs for all of the products included in this study, which total 92% of everything analyzed. TABLE 7. 15 ACTIVITIES RESPONSIBLE FOR THE MAJOR PORTION OF THE EXTRA COSTS IDENTIFIED IN THE STUDY TOTALACTIVITY STAGE US$ % Waiting for shipment Maritime/Air Transport 2.307.804,98 23,77% Demurrage Maritime/Air Transport 1.742.143,51 17,95% Road conditions - losses Land Transport 1.334.809,92 13,75% Mooring of ship/port operation Port 1.183.545,32 12,19% Transport of Empties > CD (factory) > Port Land Transport 660.199,70 6,80% Logistical service operator Land Transport 395.290,98 4,07% Loading of truck Pre-shipment/ Post-offloading 376.352,45 3,88% Loading and unloading - warehousing Port 338.760,70 3,49% NIC release of BL Maritime/Air Transport 278.621,16 2,87% Granting of ICMS to SEFAZ/Cesut Customs 226.855,48 2,34% Delivery of loaded container Port 201.432,04 2,08% DI registration Customs 183.083,03 1,89% Removal of empty container Land Transport 171.755,54 1,77% Customs Inspection/SRF Customs 155.784,44 1,60% Factory freight > CD or Port Land Transport 150.926,20 1,55% SUBTOTAL OF THE 15 ACTIVITIES RESPONSIBLE FOR THE MAJOR PORTION OF THE IDENTIFIED EXTRA COSTS 9.707.365,45 91,98% TOTAL EXTRA COSTS (31 ACTIVITIES IDENTIFIED IN THE STUDY) 10.553.712,7 2 100,00% Source: CARANA Corporation Analysis, 2007 The amounts of the extra costs identified in the selected corridors were extrapolated for the exports and imports of the state of Ceará in 2006. The extrapolation of the extra costs relating to exports considers those made in both the maritime and air modes, while those relating to imports only take into account those using maritime transportation. Chart 8 below shows the results of the extrapolation for Ceará’s foreign trade. It can be seen that the costs for inventory represent 40.1%, while the extra financial and direct costs represent 59.9%.
  • 19. 19 CHART 8 - CALCULATED EXTRA COSTS IN CEARÁ FOREIGN TRADE – 2006 CALCULATED EXTRA COSTS (US$) CORRIDOR Inventory % Financial & Direct % Total % Importation (1) 6.543.416,16 6.558.141,75 13.101.557,91 Exportation (2) 10.831.112,24 19.348.737,92 30.179.850,16 TOTAL 17.374.528,40 40,1% 25.906.879,67 59,9% 43.281.408,07 100% (1) containerized importation only (2) containerized and air exportation only Source: CARANA Corporation Analysis, 2007 The calculations of the total costs and the extra costs were made on the basis of an intense compilation and processing of crossed data. This set of data, analyzed by the team of consultants, later served as the basis for a critical evaluation with the management of the companies and entities involved. All who were interviewed and involved in the process were then invited for discussions. The discussions were restricted to the models, the conclusions, and the recommendations. The meeting resulted in important changes relating to all of the corridors, made on the basis of the discussions held. All of the results obtained are averages derived from the data supplied, and they serve merely for reference purposes, since the times and costs of each operation involve private and confidential commercial data from each company or entity; it is quite likely that there are no actual operations that have the same values. The values for these results are useful as parameters of reference, since they permit the arrival at conclusions and recommendations based upon the averages. Also, by means of the methodology used, a model for the evaluation and tracking of all logistical costs was made available to the companies. This is not a “laboratory study” developed only by consultants. The development of the task involved the very significant participation of businessmen in the private sector and of representatives of the institutions. The conclusions of the study are based upon a broad range of opinions and data from the private sector and the consultants, which are expressed in this report, with no censorship of any of the sectors involved. The support of the Federation of Industries of the State of Ceará (FIEC) was fundamental. Its openness in exposing all of the problems, without omitting those that derive from inefficiencies in the private sector, is a valuable attitude, and reflects a vocation of service to the general interest.
  • 20. 20 CHART 9. MAIN RECOMMENDATIONS OF THE STUDY – EXTRAPOLATED AMOUNTS FOR THE SECTORS INCLUDED IN THIS STUDY STAGE AREA OF OPPOR-TUNITY TO LOWER COSTS EXTRA COSTS TO BE REDUCED US$ REMARKS MAIN RECOMMENDATIONS Pre-shipment Organization of foreign trade operations See remarks2 There have been cases in which the process of exportation/importation is treated in a way that is similar to that for domestic marketing. When this happens, the entire process is delayed. Regarding foreign trade as an extension of the domestic market is a mistake, and it makes difficult the success of overseas sales and purchases. The lack of planning and training are causes of this mistaken view. In order to prioritize the area of logistics in export companies, it is recommended that a department of foreign trade be established, covering the cells of exportation/importation and company logistics so as to fac ilitate business dealings. The preparation of a list of activities, of a schedule, the indication of those who have responsibility and the control of the processes by means of an organized archive, as well as the production of statistics on costs and time s would be assigned to this department. Loading of Containers 376,352.45 As a result of a lack of planning for the shipment of merchandise overseas, referred to above, it can be seen that the truck/container spends unnecessary time parked at the factory. The price charged by the transporter includes an additional sum in compensation for the down time, since the truck could be used to generate more profit for its owner. ? Negotiate discounts against the prices charged for the utilization of the truck for a shorter time, restricted to what is actually necessary. ? Schedule the request for the truck/container only when the merchandise is ready to be shipped. ? Review the procedure for sending the container to the port, so as to avoid its standing idle at the factory awaiting loading. ? Institute a procedure for recording the waiting times and the stay of the trucks so that goals are set. Land Transport Highway Infrastructure 2,020,892.46 The state highways, with the exception of those that connect factories with the main roads, are in better condition than the federal highways along which travel most of the trucks loaded with merchandise for exportation. As an alternative to improving the highways, we recommend the commissioning of a study of the viability of expanding the railway system for transporting products, since this would avoid losses due to the leveling of the rails, transport large volumes at reduced cost and potentially attract companies by making it easier for them to bring their products to market. Coordination of retrieval of empty containers 171,755.54 The retrieval of empty containers is still considered as slow, since on average, this activity requires 1.5 hours, while the international standard suggests 30 minutes. Better coordination in the process of retrieving empties is recommended, as well as time schedules that quicken the removal of equipment. 2 The lack of organization and planning for overseas operations affects the entire logistical chain, and causes various extra costs. Among others, the following can be cited: extra costs resulting from delays in the loading process (all sectors except apparel), and in the shipping process (apparel), both of these measured in this study. See Item 5.2, “Analysis of Extra Costs by Stage and Activity.”
  • 21. 21 Fruit Consolidation Center 864,812.00 (amount to be saved if a food consolidation center is built)3 As mentioned in the above item, presently there is a need for the removal of empty containers to the factory, creating extra costs for the process. Inspections by the Ministry of Agriculture, Livestock and Supply (MAPA) and by the Secretariat of Federal Revenue (SRF) occur at the port, except for fruits destined for the US. It is recommended that a study be made of the viability of establishing a fruit consolidation center on the outskirts of the port of Pecém, at which fruit will be deposited on pallets and then transferred to containers, as in a cross-docking operation. At this consolidation center it would also be possible to carry out inspections, guaranteeing that additional movements of the container within the port are avoided; the cargo would be delivered to the port already authorized for shipment. With these procedures, a great many of the extra costs relating to the pre-shipment stage, land transport and customs could be avoided. Port Administration and port operations 1,183,545.32 Both the port of Fortaleza and the port of Pecém have a structure that is capable of dealing with an increase in volume of container movement. However, the existing equipment and the infrastructure of the ports limit the speed with which ships are handled, and can cause congestion, and by extension, extra costs. The main suggestion in this case would be the formation, at both Fortaleza and Pecém, of a consortium for the administration of an investment in an integrated container terminal, permitting an adequate return on investment for the management group, better quality of service provided and more intensive usage, making possible a reduction in costs. Alternatives for the development of the ports in the state of Ceará See remarks4 The port of Fortaleza, with respect to the operation of containers, has a tool port operational model. This model is not the best kind for attracting container operations or for reducing the costs of ship owners and users. The tool port model affects the quality and cost of services, since it gives broad access to operating companies and maritime agencies, so that they can participate in port operations (activities alongside the ships and in the yard, reception and delivery of containers), creating a certain level of intra-port competition. At the port of Pecém, despite the fact that loading and unloading operations take place under a landlord model, generating little intra-port competition, and the fact that there is not an operational integration at the port, the benefits are of little significance. Under the landlord model, an operator assumes responsibility for the entire operation (loading and unloading, transfer, the yard, reception and delivery). Do away with intra-port competition, and adopt a model of competition between both ports. Succinctly, they should: ? Discard the tool port model at both ports; ? Discard the intra-port competition; ? Establish a landlord model; ? Lease both ports, or raise public investment; ? Encourage competition between both ports. Access to the port 201,432.04 The delivery of containers at both ports is done with delays that add extra costs to the operation. In a way, both the delivery and the removal could be improved, so that the ports have a constant flow, and the occurrence of bottlenecks is avoided. It is recommended that there be a restructuring of access to the port using information technology, permitting registration in advance of containers, of the operator and of the truck driver prior to their arrival at the port; this would enhance the checking of data in the system, and the identification of the driver. With the information accessible 3 For details, see Item 5.4, “Recommendations” (Consolidation Center for Fruits– Case Study). 4 The low productivity of the port operation and the delay in the delivery of full containers, extra costs measured in this study, are related to the present administration models at the ports of Ceará. See Item 5.2, “Analysis of Extra Costs by Stage and Activity.”
  • 22. 22 at the gate in digital form, and the possibility of checking between the gate operator and the driver, right at the side of the truck, it is estimated that the access time would be reduced to competitive levels, with regional standards. Ports of call in Ceará See remarks5 Since the ports of Ceará are the last ones for lines that pass through Brazil, they suffer from problems relating to faults in Brazilian port logistics. Frequent bottlenecks, principally at the port of Santos, cause delays, and at times, due to the delays, cancellation of services that Ceará provides. There is competition between the ports of Natal and Pernambuco (Suape and Recife) for the cargo generated in the region, causing a dilution of container volume to be shipped, and making some ports of call unviable. The solution for this restriction depends upon improvement in port efficiency, which can be achieved through a reduction in total times for the process, through better tariffs that reduce the total cost of the process and by constant improvement of the human resources that work in support of foreign trade, facilitating the capture and the offloading of cargo at the ports of Ceará. If this occurs, both the ship owners and their agents, as well as the exporters of the region, will evaluate the options for making their shipments using the ports of Ceará, with a resulting increase in the volume of cargo passing through the state, and in the number of arriving ships. Duration of stay of containers in the port 385,958.82 The practice of warehousing cotton containers in the yard has been observed, as well as bales of cotton in the port’s warehouses, after offloading from the ship, for periods that average as much as 50 days. There is a reasonable period of time for both storage and demurrage. The presence of the product in this ambiance could result in inefficiencies of port management, due to the occupation of space designed for rapid circulation of general cargo, and space in the container yard, probably causing a greater number of operations for the stackers. It is recommended that there be a reduction in the tax exemption for storage and demurrage for periods of more than 10 days and 5 days, respectively. Since there is an operations contract entered into by the Union and Cearáportos/Docas, extending the time period for free storage, and ceding a discount on storage taxes, it is suggested in this case that containers be segregated in the yard so as to avoid delays in the daily operation of the ports. Customs Health and customs inspections 313,288.64 The activities of the entities that oversee the process of importation and exportation of the Ceará ports have grown with the evolution of foreign trade; there has been an effort to make the inspections more efficient. This effort is reflected mainly in the sectors of shrimp and melons, studied in this inquiry. However, in the other sectors included in this study, it was observed that the extra costs were higher. In the case of health inspections, it was noted that these originated in the shrimp sector, and that extra costs were eliminated; they were also quite reduced in the fruit sector, particularly melons, which are produced for export, and are inspected by the Ministry of Agriculture at the exporter’s site when the ports of destination are in the US. However, in the case of cotton and cashews, the extra costs have risen due to the lack of a more efficient treatment. We recommend the adoption of health inspec tions at the plant, in the case of cashews, which can be made prior to exportation by means of evaluations of Good Manufacturing Practices (BPF) and Risk Analysis, Identification and Control of Critical Points (ARCPC). With regard to inspections of cotton, it would be necessary only to speed up the process of verification of the containers following their arrival at the port. 5 Delays and cancellations of moorings result in greater waiting times for shipment, an extra cost measured in this study. . See Item 5.2, “Analysis of Extra Costs by Stage and Activity.”
  • 23. 23 Customs inspection at the port for importations 122,182.23 With a view to facilitating trade and international transpor t, consideration must be given to the present worldwide scenario, with a tendency toward the recommendation of a minimization of customs inspections made in a systematic or random manner at the port. Oversight has been transferred to the factory of origin and to the final destination of the goods shipped. In this way, the inspections carried out at the ports are restricted exclusively to those cases where crimes are suspected. For imports, the mode suggested as best is to perform the inspections at the receiving factory or at the deconsolidation center, but in a selective fashion, establishing certain criteria that take into account aspects of risk and intelligence, and abandoning random inspections. The installation of scanner equipment with high resolution at the ports is regarded as the most appropriate and recommendable approach. Certification 137,335.53 It has been observed that the providing of the Certificate of Origin, Form A, generates a logistical bottleneck for the exporter, due to the time needed for its issuance and the necessity for transport and anticipation of at least 24 hours. Although it is similar to other certificates issued during the exportation process, for example, the Health Certificate, it becomes an extra cost to the extent that it generates an unnecessary direct cost for the exporter. The health certificate, in turn, generates an indirect cost, due to the time needed for issuance and the necessity of previously obtaining an international certificate after the container has left the plant for the port. The issuance of certificates can be sped up through the use of information technology. By means of an internet system, the exporter could issue a certificate of origin or a health certificate, starting with the particular requirements for each certificate. After issuance from an electronic site or at the end of the exportation, the exporter would be obligated to send the copies of the documents to the responsible issuing entity, which would record them in the system at the conclusion of the process. If this does not occur, the exporter could not obtain another certificate, and he could not make new shipments. He would also be taxed and fined. Processing of documents 108,420.55 The time taken for the processing of documents at the port or cargo terminal and at the airport is increased both by congestion in the individual response of each entity and by the need to wait for the setting of parameters on fixed schedules. It is recommended that the dealings at the ports and airports be computerized, eliminating physical documentation. Customs agents See remarks6 There are difficulties and delays observed in this study which can be corrected. Errors in filling out documents and faults in communication between the agent and the exporter/importer have entered the process, making it slower. It is recommended that the customs staff provide training for the agents and in the exportation and importation sectors of the companies, by means of groups of instructors who would multiply the knowledge acquired directly from those entities by interested parties and by participants in Ceará’s foreign trade. We would also suggest the inclusion of class registration for activities at the ports and airports after prior approval in an open bidding process. Maritime/air Transport Number of ships/planes 2,307,804.98 Despite the fact that the number of ships anchored in 2006 at Fortaleza was about 500, which represents approximately 10 ships per week, this does not represent an increased number, even with an exported volume by sea The existence of efficient ports, with an infrastructure capable of handling a greater volume of exports catches the attention of the ship owners and permits the broadening of their line of services, serving the exporter or importer with 6 These costs are reflected in other stages of the logistical chains, and especially at the Customs stage, and are measured in this study. It is recommended that a specific study be made for the customs agent. . See Item 5.2, “Analysis of Extra Costs by Stage and Activity.”
  • 24. 24 of almost US$ 900 million in the last year. The time between the offloading of merchandise and the shipping of that merchandise is important, due to the speed of international trade and the needs of the importing client, from the marketing point of view. greater frequency. This, along with governmental actions in broadening the poles for exportation, will lead to an increase in the number of ships and a better frequency/destination ratio. Demurrage 1,742,143.51 The free time of demurrage offered by ship owners for cargo destined for Europe, North America and even some countries in South America is 5 days on average. In Brazil, the practice of ship owners is to offer 10 free days of demurrage, due to the time necessary for customs -related offloading and to certain cultural aspects. In addition, a fact worthy of note in this regard is the utilization of the port as a relatively low cost option for the warehousing of cargo that is not urgent to the production or marketing process of a given industry, or even for purposes of postponing the payment of taxes relating to the importation of the product. It is recommended that the free time for demurrage and port warehousing be reduced, with a view to promoting a more efficient system for the offloading of imported cargo at the ports. Security Application of international practices for the management and security of the ports of Ceará. 1,396,187.54 (The amount that could be saved if recommendable international security practices were applied) With regard to port security, it was verified that at both ports (Pecém and Fortaleza), security relating to merchandise is generally acceptable as compared with local parameters, but it is not at the international level. Amplifying this concept involves approval from the International Ship and Port Facility Security (ISPS); the ports of Ceará do not have certification at higher levels, nor do they have non-intrusive detection equipment (scanners). In addition, the operational models of the state’s ports (toolport) do not make possible the implementation of international security standards in the area of human resources. The Container Security Initiative (CSI) is a treaty that requires agreement among the signatory states. Since Brazil and the United States have already formalized this agreement, it would presumably be viable to advance its implementation in the state of Ceará. With regard to the “Structure of Standards for Assuring and Facilitating International Trade,” of the World Customs Organization (WCO), it is important to go forward in its broadcasting and advertising, as well as in its eventual implementation. This is a primary responsibility of the federal government. There should be promotion of the application of the Customs Trade Partnership Against Terrorism (CTPAT), both at the ports and in the private sector, thus involving all of the agents in the chain: exporter, transporter, port operator, freight forwarder, maritime agency and port terminal. In this respect, there should be propulsion from different angles and orbits of a campaign for clarification, demonstrating the benefits that would derive from its adoption. There is also a need for the establishment of customs mechanisms and security of inspection of the plant of the exporter, thereby avoiding, as much as possible, interference between the physical inspection and the document inspection at the port.