1. Kentucky Agricultural Education Annual Report
Data Totals
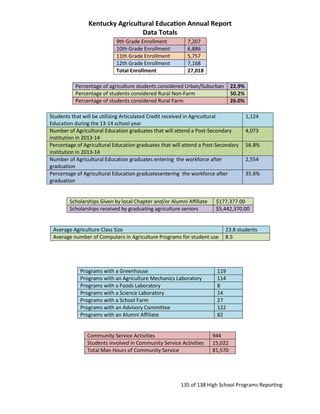
9th Grade Enrollment
10th Grade Enrollment
11th Grade Enrollment
12th Grade Enrollment
Total Enrollment
7,207
6,886
5,757
7,168
27,018
Percentage of agriculture students considered Urban/Suburban
Percentage of students considered Rural Non-Farm
Percentage of students considered Rural Farm
22.9%
50.2%
26.0%
Students that will be utilizing Articulated Credit received in Agricultural
Education during the 13-14 school year
Number of Agricultural Education graduates that will attend a Post-Secondary
institution in 2013-14
Percentage of Agricultural Education graduates that will attend a Post-Secondary
institution in 2013-14
Number of Agricultural Education graduates entering the workforce after
graduation
Percentage of Agricultural Education graduatesentering the workforce after
graduation
Scholarships Given by local Chapter and/or Alumni Affiliate
Scholarships received by graduating agriculture seniors
Community Service Activities
Students involved in Community Service Activities
Total Man Hours of Community Service
4,073
56.8%
2,554
35.6%
$177,377.00
$5,442,370.00
Average Agriculture Class Size
Average number of Computers in Agriculture Programs for student use
Programs with a Greenhouse
Programs with an Agriculture Mechanics Laboratory
Programs with a Foods Laboratory
Programs with a Science Laboratory
Programs with a School Farm
Programs with an Advisory Committee
Programs with an Alumni Affiliate
1,124
23.8 students
8.5
119
114
8
14
27
122
82
944
15,022
81,570
135 of 138 High School Programs Reporting
2. Kentucky Agricultural Education Annual Report
Data Totals
Members attending Leadership Training Center during the Summer of 2013
Members involved in leadership activities other than serving as an
Officer/Committee Chairman
Members attending Washington Leadership Conference in 2012
Members attending National FFA Convention in 2012
Members serving as Chapter Officers or Committee Chairmen
Members attending 212 Conference in 2013
Total Kentucky FFA Membership
Percentage of students that are FFA members
Members receiving the Greenhand FFA Degree
Members receiving the Chapter FFA Degree
Members receiving the State FFA Degree
Members that received the American FFA Degree in 2012
Attendance at Chapter Banquets
News Articles Submitted to local outlets
FFA Week Activities Conducted
Recruitment Activities Conducted
1,418
4,615
42
2,050
3,167
86
14.100
52%
4,448
2,719
395
141
20,924
1,331
911
410
Agribiotechnology
Number of Entrepreneurship Projects
Earnings from Entrepreneurship Projects
Number of Placement Projects
Hours worked in Placement Projects
Earnings from Placement Projects
Number of Service Learning Projects
Hours worked in Service Learning Projects
Number of Research Projects
Hours Worked in Research Projects
29
$8,402
35
4,077
$33,555
61
1,403
65
2,177
Agribusiness
Number of Entrepreneurship Projects
Earnings from Entrepreneurship Projects
Number of Placement Projects
Hours worked in Placement Projects
Earnings from Placement Projects
Number of Service Learning Projects
Hours worked in Service Learning Projects
Number of Research Projects
Hours Worked in Research Projects
433
$872,869.04
1,028
295,304
$2,298,499.62
108
5,887
91
2,574
135 of 138 High School Programs Reporting
3. Kentucky Agricultural Education Annual Report
Data Totals
Agricultural Education, Communications, and Leadership
Number of Entrepreneurship Projects
Earnings from Entrepreneurship Projects
Number of Placement Projects
Hours worked in Placement Projects
Earnings from Placement Projects
Number of Service Learning Projects
Hours worked in Service Learning Projects
Number of Research Projects
Hours Worked in Research Projects
66
$39,657.09
92
17,654
$54,275.03
239
12,536
113
4,124
Agriculture Power, Structural, and Technical Systems
Number of Entrepreneurship Projects
Earnings from Entrepreneurship Projects
Number of Placement Projects
Hours worked in Placement Projects
Earnings from Placement Projects
Number of Service Learning Projects
Hours worked in Service Learning Projects
Number of Research Projects
Hours Worked in Research Projects
430
$569,702.02
657
155,487
$1,130,816.15
168
8,099
117
3,976
Animal Science
Number of Entrepreneurship Projects
Earnings from Entrepreneurship Projects
Number of Placement Projects
Hours worked in Placement Projects
Earnings from Placement Projects
Number of Service Learning Projects
Hours worked in Service Learning Projects
Number of Research Projects
Hours Worked in Research Projects
2,288
$3,600,070.03
2,418
396,587.50
$2,481,911.08
386
179
5,749
37,834
Environmental and Natural Resources
Number of Entrepreneurship Projects
Earnings from Entrepreneurship Projects
Number of Placement Projects
Hours worked in Placement Projects
Earnings from Placement Projects
Number of Service Learning Projects
Hours worked in Service Learning Projects
Number of Research Projects
Hours Worked in Research Projects
277
$112,735.02
257
46,295
$256,471.02
123
5,569
104
9,172
135 of 138 High School Programs Reporting
4. Kentucky Agricultural Education Annual Report
Data Totals
Food Science
Number of Entrepreneurship Projects
Earnings from Entrepreneurship Projects
Number of Placement Projects
Hours worked in Placement Projects
Earnings from Placement Projects
Number of Service Learning Projects
Hours worked in Service Learning Projects
Number of Research Projects
Hours Worked in Research Projects
105
$54,147
3,318
183,117
$1,059,747.60
149
13,765
143
5,261
Horticulture/Plant Science
Number of Entrepreneurship Projects
Earnings from Entrepreneurship Projects
Number of Placement Projects
Hours worked in Placement Projects
Earnings from Placement Projects
Number of Service Learning Projects
Hours worked in Service Learning Projects
Number of Research Projects
Hours Worked in Research Projects
764
$12,35,967.01
1,716
332,782
$1,695,544.03
383
26,925
202
6,403
Total Number of Entrepreneurship Projects
Total Earnings from Entrepreneurship Projects
Total Number of Placement Projects
Total Hours worked in Placement Projects
Total Earnings from Placement Projects
Total Number of Service Learning Projects
Total Hours worked in Service Learning Projects
Total Number of Research Projects
Total Hours Worked in Research Projects
4,392
$6,493,549.21
9,521
1,431,304
$9,010,819.53
1,617
112,018
1,014
39,436
Total Number of All SAE Projects
Total Hours worked on All SAE projects
Total Earning in All SAE Projects
Number of Exploratory SAE projects
SAE Visits Conducted
16,544
1,582,758
$15,504,368.74
2,522
7,187
Student with an SAE
Percentage of students with an SAE
18,315
67.8%
135 of 138 High School Programs Reporting