SlideShare uma empresa Scribd logo
1 de 9
Baixar para ler offline
Tom Campbell
                           CURRENT U.S. ECONOMIC CONDITIONS & CALIFORNIA'S FISCAL SITUATION

Director of Finance, State of California, 2004-5
United States Congressman, 1989-1993; 1995-2001
      Member, Joint Economic Committee
      Member, Banking and Housing Committee
      Member, International Relations Committee
California State Senator, 1993-1995
      Chairman, Housing Committee
      Vice-Chairman, Budget Committee Subcommittee on Education
Professor of Law, Stanford University, 1987-2002
Professor of Business, University of California, Berkeley, 2002-present
Dean, Haas School of Business, University of California, Berkeley, 2002-2008
Director, Bureau of Competition, Federal Trade Commission, 1981-1983
White House Fellow, Office of the Chief of Staff, 1980-1981
Ph.D., economics, University of Chicago, 1980 (Milton Friedman, advisor), 1980
J.D., magna cum laude, Harvard University, 1976
Law clerk, Judge George E. MacKinnon, U.S. Court of Appeals, Washington, D.C. ('76-'77)
            Justice Byron R. White, U.S. Supreme Court ('77-'78)
Presidential Scholar and Visting Professor, Chapman University, Orange, California, 2008-9
Economic Advisor, Gibson, Dunn & Crutcher
tom@campbell.org


Tom Campbell 090429.xlsm                    © 2009 Lucidity™ (fair use permitted) — http://www.painting-with-numbers.com   4/29/2009 3:03 PM p. 1/9
COMPARISON OF RECENT RECESSIONS

                                                                                         GDP Growth Rates
                                10%
GDP Growth Rate (ann. %)


                                 8%
                                 6%
                                 4%                                                                                                                                           Apr '80
                                 2%
                                                                                                                                                                              Oct '90
                                 0%
                                                                                                                                                                              Oct '01
                                (2%) -1        0      1       2       3        4         5         6        7         8         9        10          11   12   13
                                (4%)                                                                                                                                          Apr '08

                                (6%)
                                (8%)
                                                                                     Quarters into Recession


                                                                                       Unemployment Rates
Unemployment Rate (%)


                              10.0%
                                                                                                                                                                             Apr '80
                               8.0%
                                                                                                                                                                             Oct '90
                               6.0%                                                                                                                                          Oct '01

                               4.0%                                                                                                                                          Apr '08
                                                                                                                                                                             CA '08-'09
                               2.0%

                               0.0%
                                       -3      0      3       6       9        12       15        18        21       24        27        30          33   36   39

                                                                                    Months into Recession


                                  Sources: http://www.bls.gov/data/home.htm
                                           http://www.lao.ca.gov/laoapp/laomenus/lao_menu_economics.aspx

                           Tom Campbell 090429.xlsm                   © 2009 Lucidity™ (fair use permitted) — http://www.painting-with-numbers.com                  4/29/2009 3:03 PM p. 2/9
U.S. HOUSING PRICE TRENDS

                                                                       National Average Home Prices vs. CPI (2000-present)
                                     200                                                                                   '06q2, 189.93


                                                                                                                                                                 '08q4, 139.14
    Index Value ('00q1 = 100)


                                     150


                                                                                                                                                                 '08q4, 125.39
                                     100
                                                                                                                                                                                       Case-Shiller
                                                                                                                                                                                       Home Price Index
                                     50                                                                                                                                                Consumer
                                                                                                                                                                                       Price Index


                                       0


                                                                                                                Quarter


                                                                                     Home Prices for Selected U.S. Metropolitan Areas
                                                                                                          272                              278
           Case-Shiller Home Price


                                            250                                                                                                             233                  228
                                                                      215                                                 216
             Index ('00q1 = 100)


                                                                            190
                                            200                                         167
                                                                                                                178                              173
                                                                                              145                               139                                141
                                            150        124 120
                                                                                                                                                                                       134           Jan-00

                                            100                                                                                                                                                      Jun-06
                                                                                                                                                                                                     Oct-08
                                             50

                                              0
                                                      Dallas       New York           Chicago         Los Angeles San Francisco          Miami           Las Vegas          Phoenix
                                                                                                    Metropolitan Area


                                           Source: http://www2.standardandpoors.com (Case-Shiller Index)

Tom Campbell 090429.xlsm                                                          © 2009 Lucidity™ (fair use permitted) — http://www.painting-with-numbers.com                                       4/29/2009 3:03 PM p. 3/9
U.S. PRODUCTIVITY & OIL PRICES


                                                                                                         U.S. Productivity Trends
                                             5.0%
   Productivity (% chg. vs. previous year)


                                             4.0%


                                             3.0%


                                             2.0%


                                             1.0%


                                             0.0%


                                             -1.0%

                                              Definition: Productivity = annual output / worker
                                                     Source: http://www.bls.gov/data/home.htm


Price of Oil:                                                 Fall in price of oil: 6/30/08 -- $4.06/gal. ─→ 4/20/09 -- $2.06/gal
                                                              US gasoline consumption: 320.5 million gals./day
                                                              Annualized savings due to fall in price: $234 billion
                                                              Compare with June 2008 tax rebate quot;stimulusquot;: $160 billion


                                                     Source: http://www.eia.doe.gov/


Tom Campbell 090429.xlsm                                                                 © 2009 Lucidity™ (fair use permitted) — http://www.painting-with-numbers.com   4/29/2009 3:03 PM p. 4/9
U.S. GDP & FEDERAL BUDGET OVERVIEW ($ in billions)

                            2000       2001     2002        2003        2004        2005       2006        2007       2008 2009 (E)

GDP                        10,060 10,378 10,804 11,504                 12,245 13,023 13,670 13,807 14,413                       14,701

Deficit(Surplus)                (86)     32         317        538         568        494         435        344        455         1,800
% of GDP                    (0.9%)     0.3%         2.9%      4.7%        4.6%       3.8%        3.2%       2.5%       3.2%         12.2%

Total Debt                  5,792      6,213    6,783       7,379        7,618      8,170      8,680      9,229 10,700          12,000
% of GDP                        58%     60%         63%       64%          62%        63%        63%         67%        74%          82%

Annual debt service, 2007: $184B
Years to pay back federal debt, at current rate, if NO NEW BORROWING: 293
Mandatory part of federal budget: 61%
Five-year growth in Medicare: 54% Medicaid: 53% Social Security: 28%
Unfunded liabilities (in addition to debt): $58.6 trillion


Annualized
Growth Rates                                 2007                                        2008
                                Q1      Q2          Q3        Q4          Q1          Q2         Q3         Q4

GDP                          0.1%    4.8%    4.8%   (0.2%)                0.9%    2.8%   (0.5%) (6.2%)
Personal consumption         3.9%    2.0%    2.0%    1.0%                 0.9%    1.2%   (3.8%) (4.3%)
Exports                      0.6%    8.8% 23.0%      4.4%                 5.1% 12.3%      3.0% (23.6%)
Residential investment     (16.2%) (11.5%) (20.6%) (27.0%)              (25.1%) (13.3%) (16.0%) (22.2%)


                Sources: http://www.treasurydirect.gov.govt/govt.htm
                         http://www.treasurydirect.gov/govt/reports/pd/pd_debtposactrpt_0907.pdf
                         http://www.cbo.gov/ftpdocs/89xx/doc8917/01-23-2008_BudgetOutlook.pdf
                         http://www.bea.gov/newsreleases/national/gdp/gdpnewsrelease.htm


     Tom Campbell 090429.xlsm                        © 2009 Lucidity™ (fair use permitted) — http://www.painting-with-numbers.com           4/29/2009 3:03 PM p. 5/9
THE MONEY SUPPLY -- AN EXERCISE IN BASIC ECONOMICS

The Basic Principle:           MV = PQ
                               where     M = money supply
                                         V = velocity of money (i.e., how often money changes hands in a year)
                                         P = price level
                                         Q = GDP
                               So. . . If the money supply (M) increases, some combination of the following must occur:
                                                            Comments
                                         a. V decreases     Significant change very unlikely
                                         b. P increases
                                         c. Q increases     Coming out of a recession, 5% would be tremendous
                               In other words, most of a large increase in the money supply must be absorbed through inflation (P).

What has happened to the money supply lately?
          In the last year, Federal spending not offset by revenue sources has included ($ in billions):
                     Mar-09      1,000   Federal Reserve announces additional spending to purchase mortgages and bonds
                     Mar-09        200   Additional amounts in Federal Budget, not offset
                     Feb-09        280   Federal assistance to Freddie, Mac, Fannie Mae, and individual mortgage holders
                     Feb-09        789   Federal stimulus package
                     Aug-08        350   Federal quot;TARPquot; (another $350 authorized but not yet spent)
                      Jul-08       160   Tax rebate quot;stimulusquot; checks
                                2,779 Total increase in money supply

                                8,275 Money supply before the above additions

 Increase ÷ Current Supply =     34% . . . In other words, the Federal spending listed above will increase the money supply by one-third!


          Source: http://www.federalreserve.gov/releases/h6/hist/h6hist1.txt


    Tom Campbell 090429.xlsm                      © 2009 Lucidity™ (fair use permitted) — http://www.painting-with-numbers.com        4/29/2009 3:03 PM p. 6/9
CALIFORNIA'S FISCAL SITUATION

                                                    California State Gov't Revenues & Expenditures (in $ billion)
                                                                                                                                                              102.6 103.6                  104.5
                                                                                                                                              101.4
    100.0                                                                                                            93.5 91.6         95.5                                         93.2

                                                            80.6                                   82.2 81.8
                       78.1                  76.8                  77.5          76.9 76.3
      80.0      71.4                  72.3


      60.0
                                                                                                                                                                                                           Revenue
      40.0                                                                                                                                                                                                 Expenditures
                                                                                                                                                                                                           Surplus(Deficit)
      20.0
                                                                          3.1                0.5               0.4               1.9
       0.0
                                                                                                                                                                            (1.0)
                              (6.6)                 (4.5)                                                                                             (5.9)
     (20.0)                                                                                                                                                                                    (11.3)
                  2000-01               2001-02               2002-03             2003-04           2004-05           2005-06            2006-07                2007-08             2008-09 (E)


 Annual debt service: $3.4 billion
 Total debt: $63 billion. Years to pay off, at current rate,
                          IF NO NEW BORROWING: 84 years

 Mandatory part of California budget: 60%
 Unfunded liabilities (in addition to debt): $99 billion (low estimate)


If we adjusted Gov. Gray Davis' First Budget for Inflation and Population since then—and spent no more – we'd be balanced today!
                                                                          1998         2008
              Expenditures in CA state budget                         $57.8          $103.6
              Population                                             33.3MM          38.0MM

                                Take $57.8 billion. Express it in 2009 dollars: $74.9 billion.
                                Increase it by percentage growth of population since 1998: $85.5 billion
                                Total revenue est. 2008-09: $93.2 billion! ($87.5 excl. transfers/carryforwards)


               Sources: http://www.lao.ca.gov/laoapp/laomenus/lao_menu_economics.aspx
                        http://www.taxfoundation.org/taxdata/show/228.html
                        http://articles.moneycentral.msn.com/Taxes/Advice/PropertyTaxesWhereDoesYourStateRank.aspx

Tom Campbell 090429.xlsm                                              © 2009 Lucidity™ (fair use permitted) — http://www.painting-with-numbers.com                                                      4/29/2009 3:03 PM p. 7/9
CALIFORNIA STATE TAXES, COMPARED TO OTHER STATES

                                                                                    State Tax Levels, by type of tax

             CA                                                                                                                                           MA
  10.0%     9.6%                                                                                                                                         9.5%   5,000                                                   CA
                                  OR                                                                            CA
                                 9.0%                          CA                                              8.8%                                                                                                     AZ
                                                NY
                                                              8.3%                                                                                                                                                      NV
   8.0%                                        7.7%                                                                                                             4,000
                                                                                                                       AZ                          NY                                                                   OR
                                                                                                                      7.0%           OR           7.1%
                                                                             NV
                                                                            6.5%           TX                                       6.6%                                                                   NY
                                                                                                                                                                                                                 MA     TX
                                                                                          6.3%                                                                                                            3,076
                                                                      AZ                                                                                                                                        2,974
   6.0%                                                MA            5.6%                                                                                       3,000                                                   NY
                    AZ                                5.3%                                               MA
                   5.0%                                                                                 5.0%                                                             CA                                             MA
                                                                                                  NY
                                                                                                                                                                        2,278
                                                                                                                                                                                             OR TX
                                                                                                 4.0%                                                                                       1,910 1,926
   4.0%                                                                                                                                                         2,000
                                                                                                                                                                                     NV
                                                                                                                                                                                    1,445
                                                                                                                                                                             AZ
                                                                                                                                                                            1,133

   2.0%                                                                                                                                                         1,000

                           NV            TX                                         OR                                        NV            TX
                          0.0%          0.0%                                       0.0%                                      0.0%          0.0%
   0.0%                                                                                                                                                            -
                          Income Tax                                   State Sales Tax                                   Business Tax                                                Property Tax
                            (top rate)                                  (excl. cities)                                                                                              (median $ pmt.)


            California ranks . . .
                                      -- among --
               Type               the 7         All
                of               states          50
                Tax              shown        States

            Income                        #1                  #1
            Sales                         #1                  #1
            Business                      #2                  #8
            Property                      #3                 #10        Note: California's property tax rate ranks 45th, but its median property tax paid ranks 10th,
                                                                              because of the higher cost of real estate


             Sources: http://www.lao.ca.gov/laoapp/laomenus/lao_menu_economics.aspx
                      http://www.taxfoundation.org/taxdata/show/228.html
                      http://articles.moneycentral.msn.com/Taxes/Advice/PropertyTaxesWhereDoesYourStateRank.aspx
                      http://www.taxfoundation.org/files/bp58.pdf (Table 8)

Tom Campbell 090429.xlsm                                             © 2009 Lucidity™ (fair use permitted) — http://www.painting-with-numbers.com                                                     4/29/2009 3:03 PM p. 8/9
DISTRIBUTION OF U.S. INCOME & TAX PAYMENTS


                                     Share of Individual Income & Taxes Paid (2000 Data)


                       100.0%


                       80.0%
Cumulative Share (%)


                       60.0%
                                                                                                                                                 U.S. Income
                                                                                                                                                 Federal Taxes Paid
                                                                                                                                                 CA Taxes Paid
                       40.0%
                                                                                                                                                 quot;Uniformquot;


                       20.0%


                         0.0%
                                0%                20%                  40%                    60%                   80%                   100%
                                              Percentile of Income (e.g., 5% means top 5% of earners)

California state personal income taxes: 50% is paid by the top 3% of households
                                                                       70% is paid by the top 9%
                                                                       93% is paid by the top one-third


                        Sources: “Effective Federal Tax Rates 1997 to 2000,” CBO (August 2003) p. 27 (data for 2000)
                                 quot;California's Tax System: A Primer,quot; LAO (2001) chapter 2, p. 3


     Tom Campbell 090429.xlsm                                  © 2009 Lucidity™ (fair use permitted) — http://www.painting-with-numbers.com           4/29/2009 3:03 PM p. 9/9

Mais conteúdo relacionado

Mais procurados

The Waterside Convention 2011 Invesco - Volatiliteit: een anomalie?
The Waterside Convention 2011 Invesco - Volatiliteit: een anomalie?The Waterside Convention 2011 Invesco - Volatiliteit: een anomalie?
The Waterside Convention 2011 Invesco - Volatiliteit: een anomalie?Marnix van Eerde
 
Exxon Mobil Corporation at Barclays Capital 2009 CEO Energy Conference
Exxon Mobil Corporation at Barclays Capital 2009 CEO Energy ConferenceExxon Mobil Corporation at Barclays Capital 2009 CEO Energy Conference
Exxon Mobil Corporation at Barclays Capital 2009 CEO Energy Conferenceinvestorrelation
 
The Euro Area Crisis and Reforms Fiscal Discipline and Growth
The Euro Area Crisis and Reforms Fiscal Discipline and GrowthThe Euro Area Crisis and Reforms Fiscal Discipline and Growth
The Euro Area Crisis and Reforms Fiscal Discipline and GrowthIstituto Affari Internazionali
 
The BER's business tendency surveys in South Africa: method and results
The BER's business tendency surveys in South Africa: method and resultsThe BER's business tendency surveys in South Africa: method and results
The BER's business tendency surveys in South Africa: method and resultsGeorge Kershoff
 
Festool [state of the industry] keynote presentation (1)
Festool [state of the industry] keynote presentation (1)Festool [state of the industry] keynote presentation (1)
Festool [state of the industry] keynote presentation (1)ideaslide
 
Us economic outlook micky levy, chief economist - bank of america 25 januar...
Us economic outlook   micky levy, chief economist - bank of america 25 januar...Us economic outlook   micky levy, chief economist - bank of america 25 januar...
Us economic outlook micky levy, chief economist - bank of america 25 januar...Jessica Roch
 
Wealth Teams Primer
Wealth Teams PrimerWealth Teams Primer
Wealth Teams Primerguybee
 
2011 06 15 Risk Management Association V2
2011 06 15 Risk Management Association V22011 06 15 Risk Management Association V2
2011 06 15 Risk Management Association V2johnrcg
 
Tele2 AB Q1 2011 presentation
Tele2 AB Q1 2011 presentationTele2 AB Q1 2011 presentation
Tele2 AB Q1 2011 presentationTele2
 
Sustainable Organisations: Can businesses solve social and environmental issu...
Sustainable Organisations: Can businesses solve social and environmental issu...Sustainable Organisations: Can businesses solve social and environmental issu...
Sustainable Organisations: Can businesses solve social and environmental issu...London Business School
 
4QO7 Results Conference Call Presentation
4QO7 Results Conference Call Presentation4QO7 Results Conference Call Presentation
4QO7 Results Conference Call PresentationTempo Participações
 
CR2 Apresentação - 3Q11
CR2   Apresentação - 3Q11CR2   Apresentação - 3Q11
CR2 Apresentação - 3Q11CR2
 
Carpe Diem: Living in a Post-Durbin World (Credit Union Conference Session Pr...
Carpe Diem: Living in a Post-Durbin World (Credit Union Conference Session Pr...Carpe Diem: Living in a Post-Durbin World (Credit Union Conference Session Pr...
Carpe Diem: Living in a Post-Durbin World (Credit Union Conference Session Pr...NAFCU Services Corporation
 
Product Line Performance Analysis
Product Line Performance AnalysisProduct Line Performance Analysis
Product Line Performance Analysiscahaughey
 
Hong Kong Options Haslett Moran 8 30 08
Hong Kong Options Haslett Moran 8 30 08Hong Kong Options Haslett Moran 8 30 08
Hong Kong Options Haslett Moran 8 30 08Bud Haslett
 

Mais procurados (20)

The Waterside Convention 2011 Invesco - Volatiliteit: een anomalie?
The Waterside Convention 2011 Invesco - Volatiliteit: een anomalie?The Waterside Convention 2011 Invesco - Volatiliteit: een anomalie?
The Waterside Convention 2011 Invesco - Volatiliteit: een anomalie?
 
Exxon Mobil Corporation at Barclays Capital 2009 CEO Energy Conference
Exxon Mobil Corporation at Barclays Capital 2009 CEO Energy ConferenceExxon Mobil Corporation at Barclays Capital 2009 CEO Energy Conference
Exxon Mobil Corporation at Barclays Capital 2009 CEO Energy Conference
 
The Euro Area Crisis and Reforms Fiscal Discipline and Growth
The Euro Area Crisis and Reforms Fiscal Discipline and GrowthThe Euro Area Crisis and Reforms Fiscal Discipline and Growth
The Euro Area Crisis and Reforms Fiscal Discipline and Growth
 
The BER's business tendency surveys in South Africa: method and results
The BER's business tendency surveys in South Africa: method and resultsThe BER's business tendency surveys in South Africa: method and results
The BER's business tendency surveys in South Africa: method and results
 
Festool [state of the industry] keynote presentation (1)
Festool [state of the industry] keynote presentation (1)Festool [state of the industry] keynote presentation (1)
Festool [state of the industry] keynote presentation (1)
 
Outlook Jan 21 2009 - 2009 Economic Outlook
Outlook Jan 21 2009 - 2009 Economic OutlookOutlook Jan 21 2009 - 2009 Economic Outlook
Outlook Jan 21 2009 - 2009 Economic Outlook
 
Us economic outlook micky levy, chief economist - bank of america 25 januar...
Us economic outlook   micky levy, chief economist - bank of america 25 januar...Us economic outlook   micky levy, chief economist - bank of america 25 januar...
Us economic outlook micky levy, chief economist - bank of america 25 januar...
 
Wealth Teams Primer
Wealth Teams PrimerWealth Teams Primer
Wealth Teams Primer
 
2011 06 15 Risk Management Association V2
2011 06 15 Risk Management Association V22011 06 15 Risk Management Association V2
2011 06 15 Risk Management Association V2
 
Q32009 Austin Real Estate Market Report
Q32009 Austin Real Estate Market ReportQ32009 Austin Real Estate Market Report
Q32009 Austin Real Estate Market Report
 
Tele2 AB Q1 2011 presentation
Tele2 AB Q1 2011 presentationTele2 AB Q1 2011 presentation
Tele2 AB Q1 2011 presentation
 
Sustainable Organisations: Can businesses solve social and environmental issu...
Sustainable Organisations: Can businesses solve social and environmental issu...Sustainable Organisations: Can businesses solve social and environmental issu...
Sustainable Organisations: Can businesses solve social and environmental issu...
 
台湾企業信用調査サンプル2
台湾企業信用調査サンプル2台湾企業信用調査サンプル2
台湾企業信用調査サンプル2
 
4QO7 Results Conference Call Presentation
4QO7 Results Conference Call Presentation4QO7 Results Conference Call Presentation
4QO7 Results Conference Call Presentation
 
Ramirent Q4 2011
Ramirent Q4 2011Ramirent Q4 2011
Ramirent Q4 2011
 
CR2 Apresentação - 3Q11
CR2   Apresentação - 3Q11CR2   Apresentação - 3Q11
CR2 Apresentação - 3Q11
 
Carpe Diem: Living in a Post-Durbin World (Credit Union Conference Session Pr...
Carpe Diem: Living in a Post-Durbin World (Credit Union Conference Session Pr...Carpe Diem: Living in a Post-Durbin World (Credit Union Conference Session Pr...
Carpe Diem: Living in a Post-Durbin World (Credit Union Conference Session Pr...
 
Apre 3 t05
Apre 3 t05Apre 3 t05
Apre 3 t05
 
Product Line Performance Analysis
Product Line Performance AnalysisProduct Line Performance Analysis
Product Line Performance Analysis
 
Hong Kong Options Haslett Moran 8 30 08
Hong Kong Options Haslett Moran 8 30 08Hong Kong Options Haslett Moran 8 30 08
Hong Kong Options Haslett Moran 8 30 08
 

Destaque

Buku Panduan Program Pendidikan Pusaka dalam Konteks Kerjasama Internasional
Buku Panduan Program Pendidikan Pusaka dalam Konteks Kerjasama InternasionalBuku Panduan Program Pendidikan Pusaka dalam Konteks Kerjasama Internasional
Buku Panduan Program Pendidikan Pusaka dalam Konteks Kerjasama InternasionalElanto Wijoyono
 
Penerapan Pendidikan Pusaka di SDN Ungaran I Yogyakarta (Maret 2009)
Penerapan Pendidikan Pusaka di SDN Ungaran I Yogyakarta (Maret 2009)Penerapan Pendidikan Pusaka di SDN Ungaran I Yogyakarta (Maret 2009)
Penerapan Pendidikan Pusaka di SDN Ungaran I Yogyakarta (Maret 2009)Elanto Wijoyono
 
Chateau Wedding
Chateau WeddingChateau Wedding
Chateau Weddingluxphotos
 
Hype vs. Reality: The AI Explainer
Hype vs. Reality: The AI ExplainerHype vs. Reality: The AI Explainer
Hype vs. Reality: The AI ExplainerLuminary Labs
 
Study: The Future of VR, AR and Self-Driving Cars
Study: The Future of VR, AR and Self-Driving CarsStudy: The Future of VR, AR and Self-Driving Cars
Study: The Future of VR, AR and Self-Driving CarsLinkedIn
 

Destaque (8)

Life in the Spirit 05
Life in the Spirit 05Life in the Spirit 05
Life in the Spirit 05
 
LinkedIn
LinkedInLinkedIn
LinkedIn
 
Buku Panduan Program Pendidikan Pusaka dalam Konteks Kerjasama Internasional
Buku Panduan Program Pendidikan Pusaka dalam Konteks Kerjasama InternasionalBuku Panduan Program Pendidikan Pusaka dalam Konteks Kerjasama Internasional
Buku Panduan Program Pendidikan Pusaka dalam Konteks Kerjasama Internasional
 
Who's Going To Heaven
Who's Going To HeavenWho's Going To Heaven
Who's Going To Heaven
 
Penerapan Pendidikan Pusaka di SDN Ungaran I Yogyakarta (Maret 2009)
Penerapan Pendidikan Pusaka di SDN Ungaran I Yogyakarta (Maret 2009)Penerapan Pendidikan Pusaka di SDN Ungaran I Yogyakarta (Maret 2009)
Penerapan Pendidikan Pusaka di SDN Ungaran I Yogyakarta (Maret 2009)
 
Chateau Wedding
Chateau WeddingChateau Wedding
Chateau Wedding
 
Hype vs. Reality: The AI Explainer
Hype vs. Reality: The AI ExplainerHype vs. Reality: The AI Explainer
Hype vs. Reality: The AI Explainer
 
Study: The Future of VR, AR and Self-Driving Cars
Study: The Future of VR, AR and Self-Driving CarsStudy: The Future of VR, AR and Self-Driving Cars
Study: The Future of VR, AR and Self-Driving Cars
 

Semelhante a Tom Campbell Budget Presentation 5 04 09 Color 1

Strix Applications Case Studies
Strix  Applications  Case StudiesStrix  Applications  Case Studies
Strix Applications Case Studiestritv
 
Texas Market O Verview Kdh
Texas Market O Verview KdhTexas Market O Verview Kdh
Texas Market O Verview KdhBob Lowery
 
Remote Production Monitoring by Mpower
Remote Production Monitoring by MpowerRemote Production Monitoring by Mpower
Remote Production Monitoring by MpowerAVEVA
 
2002 - Second Annual Analysts & Investors Meeting Airline Market Trends & O...
2002 - Second Annual Analysts & Investors Meeting   Airline Market Trends & O...2002 - Second Annual Analysts & Investors Meeting   Airline Market Trends & O...
2002 - Second Annual Analysts & Investors Meeting Airline Market Trends & O...Embraer RI
 
From suppressed urbanization to inter-city mobility in the Israeli Arab sector
From suppressed urbanization to inter-city mobility in the Israeli Arab sectorFrom suppressed urbanization to inter-city mobility in the Israeli Arab sector
From suppressed urbanization to inter-city mobility in the Israeli Arab sectorNachman Shelef
 
Presentation IACA Agm Dec 2 2009
Presentation IACA Agm Dec 2 2009Presentation IACA Agm Dec 2 2009
Presentation IACA Agm Dec 2 2009hazera01
 
What Are Our Prospects Are Thinking Right Now Michael Starke, Vp Of Research
What Are Our Prospects Are Thinking Right Now   Michael Starke, Vp Of ResearchWhat Are Our Prospects Are Thinking Right Now   Michael Starke, Vp Of Research
What Are Our Prospects Are Thinking Right Now Michael Starke, Vp Of Researchmichaelstarke
 
Martin Barden – The audience centre stage | congres podiumkunsten 2012
Martin Barden – The audience centre stage | congres podiumkunsten 2012Martin Barden – The audience centre stage | congres podiumkunsten 2012
Martin Barden – The audience centre stage | congres podiumkunsten 2012Promotie Podiumkunsten
 
Quick hits 020613 Europe
Quick hits 020613   EuropeQuick hits 020613   Europe
Quick hits 020613 EuropeJoe Morgan
 
Telecom versus Online - Worlds in collision
Telecom versus Online - Worlds in collisionTelecom versus Online - Worlds in collision
Telecom versus Online - Worlds in collisionireijjhhjhut
 

Semelhante a Tom Campbell Budget Presentation 5 04 09 Color 1 (16)

H1 2009 IFRS results
H1 2009 IFRS resultsH1 2009 IFRS results
H1 2009 IFRS results
 
Domestic resource mobilization. Infrastructure
Domestic resource mobilization. InfrastructureDomestic resource mobilization. Infrastructure
Domestic resource mobilization. Infrastructure
 
Strix Applications Case Studies
Strix  Applications  Case StudiesStrix  Applications  Case Studies
Strix Applications Case Studies
 
Energías renovables y eficiencie energética en Marruecos
Energías renovables y eficiencie energética en MarruecosEnergías renovables y eficiencie energética en Marruecos
Energías renovables y eficiencie energética en Marruecos
 
Texas Market O Verview Kdh
Texas Market O Verview KdhTexas Market O Verview Kdh
Texas Market O Verview Kdh
 
4Q09 Presentation
4Q09 Presentation4Q09 Presentation
4Q09 Presentation
 
Remote Production Monitoring by Mpower
Remote Production Monitoring by MpowerRemote Production Monitoring by Mpower
Remote Production Monitoring by Mpower
 
2002 - Second Annual Analysts & Investors Meeting Airline Market Trends & O...
2002 - Second Annual Analysts & Investors Meeting   Airline Market Trends & O...2002 - Second Annual Analysts & Investors Meeting   Airline Market Trends & O...
2002 - Second Annual Analysts & Investors Meeting Airline Market Trends & O...
 
From suppressed urbanization to inter-city mobility in the Israeli Arab sector
From suppressed urbanization to inter-city mobility in the Israeli Arab sectorFrom suppressed urbanization to inter-city mobility in the Israeli Arab sector
From suppressed urbanization to inter-city mobility in the Israeli Arab sector
 
Presentation IACA Agm Dec 2 2009
Presentation IACA Agm Dec 2 2009Presentation IACA Agm Dec 2 2009
Presentation IACA Agm Dec 2 2009
 
What Are Our Prospects Are Thinking Right Now Michael Starke, Vp Of Research
What Are Our Prospects Are Thinking Right Now   Michael Starke, Vp Of ResearchWhat Are Our Prospects Are Thinking Right Now   Michael Starke, Vp Of Research
What Are Our Prospects Are Thinking Right Now Michael Starke, Vp Of Research
 
Manufacturing Economic Update
Manufacturing Economic UpdateManufacturing Economic Update
Manufacturing Economic Update
 
Martin Barden – The audience centre stage | congres podiumkunsten 2012
Martin Barden – The audience centre stage | congres podiumkunsten 2012Martin Barden – The audience centre stage | congres podiumkunsten 2012
Martin Barden – The audience centre stage | congres podiumkunsten 2012
 
Quick hits 020613 Europe
Quick hits 020613   EuropeQuick hits 020613   Europe
Quick hits 020613 Europe
 
Telecom versus Online - Worlds in collision
Telecom versus Online - Worlds in collisionTelecom versus Online - Worlds in collision
Telecom versus Online - Worlds in collision
 
Smarter Planet: Airlines
Smarter Planet: AirlinesSmarter Planet: Airlines
Smarter Planet: Airlines
 

Último

HARNESSING AI FOR ENHANCED MEDIA ANALYSIS A CASE STUDY ON CHATGPT AT DRONE EM...
HARNESSING AI FOR ENHANCED MEDIA ANALYSIS A CASE STUDY ON CHATGPT AT DRONE EM...HARNESSING AI FOR ENHANCED MEDIA ANALYSIS A CASE STUDY ON CHATGPT AT DRONE EM...
HARNESSING AI FOR ENHANCED MEDIA ANALYSIS A CASE STUDY ON CHATGPT AT DRONE EM...Ismail Fahmi
 
AI as Research Assistant: Upscaling Content Analysis to Identify Patterns of ...
AI as Research Assistant: Upscaling Content Analysis to Identify Patterns of ...AI as Research Assistant: Upscaling Content Analysis to Identify Patterns of ...
AI as Research Assistant: Upscaling Content Analysis to Identify Patterns of ...Axel Bruns
 
如何办理(BU学位证书)美国贝翰文大学毕业证学位证书
如何办理(BU学位证书)美国贝翰文大学毕业证学位证书如何办理(BU学位证书)美国贝翰文大学毕业证学位证书
如何办理(BU学位证书)美国贝翰文大学毕业证学位证书Fi L
 
Enjoy Night⚡Call Girls Iffco Chowk Gurgaon >༒8448380779 Escort Service
Enjoy Night⚡Call Girls Iffco Chowk Gurgaon >༒8448380779 Escort ServiceEnjoy Night⚡Call Girls Iffco Chowk Gurgaon >༒8448380779 Escort Service
Enjoy Night⚡Call Girls Iffco Chowk Gurgaon >༒8448380779 Escort ServiceDelhi Call girls
 
Nara Chandrababu Naidu's Visionary Policies For Andhra Pradesh's Development
Nara Chandrababu Naidu's Visionary Policies For Andhra Pradesh's DevelopmentNara Chandrababu Naidu's Visionary Policies For Andhra Pradesh's Development
Nara Chandrababu Naidu's Visionary Policies For Andhra Pradesh's Developmentnarsireddynannuri1
 
Pakistan PMLN Election Manifesto 2024.pdf
Pakistan PMLN Election Manifesto 2024.pdfPakistan PMLN Election Manifesto 2024.pdf
Pakistan PMLN Election Manifesto 2024.pdfFahimUddin61
 
Kishan Reddy Report To People (2019-24).pdf
Kishan Reddy Report To People (2019-24).pdfKishan Reddy Report To People (2019-24).pdf
Kishan Reddy Report To People (2019-24).pdfKISHAN REDDY OFFICE
 
TDP As the Party of Hope For AP Youth Under N Chandrababu Naidu’s Leadership
TDP As the Party of Hope For AP Youth Under N Chandrababu Naidu’s LeadershipTDP As the Party of Hope For AP Youth Under N Chandrababu Naidu’s Leadership
TDP As the Party of Hope For AP Youth Under N Chandrababu Naidu’s Leadershipanjanibaddipudi1
 
28042024_First India Newspaper Jaipur.pdf
28042024_First India Newspaper Jaipur.pdf28042024_First India Newspaper Jaipur.pdf
28042024_First India Newspaper Jaipur.pdfFIRST INDIA
 
How Europe Underdeveloped Africa_walter.pdf
How Europe Underdeveloped Africa_walter.pdfHow Europe Underdeveloped Africa_walter.pdf
How Europe Underdeveloped Africa_walter.pdfLorenzo Lemes
 
2024 02 15 AZ GOP LD4 Gen Meeting Minutes_FINAL_20240228.docx
2024 02 15 AZ GOP LD4 Gen Meeting Minutes_FINAL_20240228.docx2024 02 15 AZ GOP LD4 Gen Meeting Minutes_FINAL_20240228.docx
2024 02 15 AZ GOP LD4 Gen Meeting Minutes_FINAL_20240228.docxkfjstone13
 
Embed-4.pdf lkdiinlajeklhndklheduhuekjdh
Embed-4.pdf lkdiinlajeklhndklheduhuekjdhEmbed-4.pdf lkdiinlajeklhndklheduhuekjdh
Embed-4.pdf lkdiinlajeklhndklheduhuekjdhbhavenpr
 
2024 03 13 AZ GOP LD4 Gen Meeting Minutes_FINAL.docx
2024 03 13 AZ GOP LD4 Gen Meeting Minutes_FINAL.docx2024 03 13 AZ GOP LD4 Gen Meeting Minutes_FINAL.docx
2024 03 13 AZ GOP LD4 Gen Meeting Minutes_FINAL.docxkfjstone13
 
Nurturing Families, Empowering Lives: TDP's Vision for Family Welfare in Andh...
Nurturing Families, Empowering Lives: TDP's Vision for Family Welfare in Andh...Nurturing Families, Empowering Lives: TDP's Vision for Family Welfare in Andh...
Nurturing Families, Empowering Lives: TDP's Vision for Family Welfare in Andh...narsireddynannuri1
 
Lorenzo D'Emidio_Lavoro sullaNorth Korea .pptx
Lorenzo D'Emidio_Lavoro sullaNorth Korea .pptxLorenzo D'Emidio_Lavoro sullaNorth Korea .pptx
Lorenzo D'Emidio_Lavoro sullaNorth Korea .pptxlorenzodemidio01
 
BDSM⚡Call Girls in Sector 143 Noida Escorts >༒8448380779 Escort Service
BDSM⚡Call Girls in Sector 143 Noida Escorts >༒8448380779 Escort ServiceBDSM⚡Call Girls in Sector 143 Noida Escorts >༒8448380779 Escort Service
BDSM⚡Call Girls in Sector 143 Noida Escorts >༒8448380779 Escort ServiceDelhi Call girls
 
Defensa de JOH insiste que testimonio de analista de la DEA es falso y solici...
Defensa de JOH insiste que testimonio de analista de la DEA es falso y solici...Defensa de JOH insiste que testimonio de analista de la DEA es falso y solici...
Defensa de JOH insiste que testimonio de analista de la DEA es falso y solici...AlexisTorres963861
 
Enjoy Night⚡Call Girls Rajokri Delhi >༒8448380779 Escort Service
Enjoy Night⚡Call Girls Rajokri Delhi >༒8448380779 Escort ServiceEnjoy Night⚡Call Girls Rajokri Delhi >༒8448380779 Escort Service
Enjoy Night⚡Call Girls Rajokri Delhi >༒8448380779 Escort ServiceDelhi Call girls
 
WhatsApp 📞 8448380779 ✅Call Girls In Chaura Sector 22 ( Noida)
WhatsApp 📞 8448380779 ✅Call Girls In Chaura Sector 22 ( Noida)WhatsApp 📞 8448380779 ✅Call Girls In Chaura Sector 22 ( Noida)
WhatsApp 📞 8448380779 ✅Call Girls In Chaura Sector 22 ( Noida)Delhi Call girls
 
2024 04 03 AZ GOP LD4 Gen Meeting Minutes FINAL.docx
2024 04 03 AZ GOP LD4 Gen Meeting Minutes FINAL.docx2024 04 03 AZ GOP LD4 Gen Meeting Minutes FINAL.docx
2024 04 03 AZ GOP LD4 Gen Meeting Minutes FINAL.docxkfjstone13
 

Último (20)

HARNESSING AI FOR ENHANCED MEDIA ANALYSIS A CASE STUDY ON CHATGPT AT DRONE EM...
HARNESSING AI FOR ENHANCED MEDIA ANALYSIS A CASE STUDY ON CHATGPT AT DRONE EM...HARNESSING AI FOR ENHANCED MEDIA ANALYSIS A CASE STUDY ON CHATGPT AT DRONE EM...
HARNESSING AI FOR ENHANCED MEDIA ANALYSIS A CASE STUDY ON CHATGPT AT DRONE EM...
 
AI as Research Assistant: Upscaling Content Analysis to Identify Patterns of ...
AI as Research Assistant: Upscaling Content Analysis to Identify Patterns of ...AI as Research Assistant: Upscaling Content Analysis to Identify Patterns of ...
AI as Research Assistant: Upscaling Content Analysis to Identify Patterns of ...
 
如何办理(BU学位证书)美国贝翰文大学毕业证学位证书
如何办理(BU学位证书)美国贝翰文大学毕业证学位证书如何办理(BU学位证书)美国贝翰文大学毕业证学位证书
如何办理(BU学位证书)美国贝翰文大学毕业证学位证书
 
Enjoy Night⚡Call Girls Iffco Chowk Gurgaon >༒8448380779 Escort Service
Enjoy Night⚡Call Girls Iffco Chowk Gurgaon >༒8448380779 Escort ServiceEnjoy Night⚡Call Girls Iffco Chowk Gurgaon >༒8448380779 Escort Service
Enjoy Night⚡Call Girls Iffco Chowk Gurgaon >༒8448380779 Escort Service
 
Nara Chandrababu Naidu's Visionary Policies For Andhra Pradesh's Development
Nara Chandrababu Naidu's Visionary Policies For Andhra Pradesh's DevelopmentNara Chandrababu Naidu's Visionary Policies For Andhra Pradesh's Development
Nara Chandrababu Naidu's Visionary Policies For Andhra Pradesh's Development
 
Pakistan PMLN Election Manifesto 2024.pdf
Pakistan PMLN Election Manifesto 2024.pdfPakistan PMLN Election Manifesto 2024.pdf
Pakistan PMLN Election Manifesto 2024.pdf
 
Kishan Reddy Report To People (2019-24).pdf
Kishan Reddy Report To People (2019-24).pdfKishan Reddy Report To People (2019-24).pdf
Kishan Reddy Report To People (2019-24).pdf
 
TDP As the Party of Hope For AP Youth Under N Chandrababu Naidu’s Leadership
TDP As the Party of Hope For AP Youth Under N Chandrababu Naidu’s LeadershipTDP As the Party of Hope For AP Youth Under N Chandrababu Naidu’s Leadership
TDP As the Party of Hope For AP Youth Under N Chandrababu Naidu’s Leadership
 
28042024_First India Newspaper Jaipur.pdf
28042024_First India Newspaper Jaipur.pdf28042024_First India Newspaper Jaipur.pdf
28042024_First India Newspaper Jaipur.pdf
 
How Europe Underdeveloped Africa_walter.pdf
How Europe Underdeveloped Africa_walter.pdfHow Europe Underdeveloped Africa_walter.pdf
How Europe Underdeveloped Africa_walter.pdf
 
2024 02 15 AZ GOP LD4 Gen Meeting Minutes_FINAL_20240228.docx
2024 02 15 AZ GOP LD4 Gen Meeting Minutes_FINAL_20240228.docx2024 02 15 AZ GOP LD4 Gen Meeting Minutes_FINAL_20240228.docx
2024 02 15 AZ GOP LD4 Gen Meeting Minutes_FINAL_20240228.docx
 
Embed-4.pdf lkdiinlajeklhndklheduhuekjdh
Embed-4.pdf lkdiinlajeklhndklheduhuekjdhEmbed-4.pdf lkdiinlajeklhndklheduhuekjdh
Embed-4.pdf lkdiinlajeklhndklheduhuekjdh
 
2024 03 13 AZ GOP LD4 Gen Meeting Minutes_FINAL.docx
2024 03 13 AZ GOP LD4 Gen Meeting Minutes_FINAL.docx2024 03 13 AZ GOP LD4 Gen Meeting Minutes_FINAL.docx
2024 03 13 AZ GOP LD4 Gen Meeting Minutes_FINAL.docx
 
Nurturing Families, Empowering Lives: TDP's Vision for Family Welfare in Andh...
Nurturing Families, Empowering Lives: TDP's Vision for Family Welfare in Andh...Nurturing Families, Empowering Lives: TDP's Vision for Family Welfare in Andh...
Nurturing Families, Empowering Lives: TDP's Vision for Family Welfare in Andh...
 
Lorenzo D'Emidio_Lavoro sullaNorth Korea .pptx
Lorenzo D'Emidio_Lavoro sullaNorth Korea .pptxLorenzo D'Emidio_Lavoro sullaNorth Korea .pptx
Lorenzo D'Emidio_Lavoro sullaNorth Korea .pptx
 
BDSM⚡Call Girls in Sector 143 Noida Escorts >༒8448380779 Escort Service
BDSM⚡Call Girls in Sector 143 Noida Escorts >༒8448380779 Escort ServiceBDSM⚡Call Girls in Sector 143 Noida Escorts >༒8448380779 Escort Service
BDSM⚡Call Girls in Sector 143 Noida Escorts >༒8448380779 Escort Service
 
Defensa de JOH insiste que testimonio de analista de la DEA es falso y solici...
Defensa de JOH insiste que testimonio de analista de la DEA es falso y solici...Defensa de JOH insiste que testimonio de analista de la DEA es falso y solici...
Defensa de JOH insiste que testimonio de analista de la DEA es falso y solici...
 
Enjoy Night⚡Call Girls Rajokri Delhi >༒8448380779 Escort Service
Enjoy Night⚡Call Girls Rajokri Delhi >༒8448380779 Escort ServiceEnjoy Night⚡Call Girls Rajokri Delhi >༒8448380779 Escort Service
Enjoy Night⚡Call Girls Rajokri Delhi >༒8448380779 Escort Service
 
WhatsApp 📞 8448380779 ✅Call Girls In Chaura Sector 22 ( Noida)
WhatsApp 📞 8448380779 ✅Call Girls In Chaura Sector 22 ( Noida)WhatsApp 📞 8448380779 ✅Call Girls In Chaura Sector 22 ( Noida)
WhatsApp 📞 8448380779 ✅Call Girls In Chaura Sector 22 ( Noida)
 
2024 04 03 AZ GOP LD4 Gen Meeting Minutes FINAL.docx
2024 04 03 AZ GOP LD4 Gen Meeting Minutes FINAL.docx2024 04 03 AZ GOP LD4 Gen Meeting Minutes FINAL.docx
2024 04 03 AZ GOP LD4 Gen Meeting Minutes FINAL.docx
 

Tom Campbell Budget Presentation 5 04 09 Color 1

  • 1. Tom Campbell CURRENT U.S. ECONOMIC CONDITIONS & CALIFORNIA'S FISCAL SITUATION Director of Finance, State of California, 2004-5 United States Congressman, 1989-1993; 1995-2001 Member, Joint Economic Committee Member, Banking and Housing Committee Member, International Relations Committee California State Senator, 1993-1995 Chairman, Housing Committee Vice-Chairman, Budget Committee Subcommittee on Education Professor of Law, Stanford University, 1987-2002 Professor of Business, University of California, Berkeley, 2002-present Dean, Haas School of Business, University of California, Berkeley, 2002-2008 Director, Bureau of Competition, Federal Trade Commission, 1981-1983 White House Fellow, Office of the Chief of Staff, 1980-1981 Ph.D., economics, University of Chicago, 1980 (Milton Friedman, advisor), 1980 J.D., magna cum laude, Harvard University, 1976 Law clerk, Judge George E. MacKinnon, U.S. Court of Appeals, Washington, D.C. ('76-'77) Justice Byron R. White, U.S. Supreme Court ('77-'78) Presidential Scholar and Visting Professor, Chapman University, Orange, California, 2008-9 Economic Advisor, Gibson, Dunn & Crutcher tom@campbell.org Tom Campbell 090429.xlsm © 2009 Lucidity™ (fair use permitted) — http://www.painting-with-numbers.com 4/29/2009 3:03 PM p. 1/9
  • 2. COMPARISON OF RECENT RECESSIONS GDP Growth Rates 10% GDP Growth Rate (ann. %) 8% 6% 4% Apr '80 2% Oct '90 0% Oct '01 (2%) -1 0 1 2 3 4 5 6 7 8 9 10 11 12 13 (4%) Apr '08 (6%) (8%) Quarters into Recession Unemployment Rates Unemployment Rate (%) 10.0% Apr '80 8.0% Oct '90 6.0% Oct '01 4.0% Apr '08 CA '08-'09 2.0% 0.0% -3 0 3 6 9 12 15 18 21 24 27 30 33 36 39 Months into Recession Sources: http://www.bls.gov/data/home.htm http://www.lao.ca.gov/laoapp/laomenus/lao_menu_economics.aspx Tom Campbell 090429.xlsm © 2009 Lucidity™ (fair use permitted) — http://www.painting-with-numbers.com 4/29/2009 3:03 PM p. 2/9
  • 3. U.S. HOUSING PRICE TRENDS National Average Home Prices vs. CPI (2000-present) 200 '06q2, 189.93 '08q4, 139.14 Index Value ('00q1 = 100) 150 '08q4, 125.39 100 Case-Shiller Home Price Index 50 Consumer Price Index 0 Quarter Home Prices for Selected U.S. Metropolitan Areas 272 278 Case-Shiller Home Price 250 233 228 215 216 Index ('00q1 = 100) 190 200 167 178 173 145 139 141 150 124 120 134 Jan-00 100 Jun-06 Oct-08 50 0 Dallas New York Chicago Los Angeles San Francisco Miami Las Vegas Phoenix Metropolitan Area Source: http://www2.standardandpoors.com (Case-Shiller Index) Tom Campbell 090429.xlsm © 2009 Lucidity™ (fair use permitted) — http://www.painting-with-numbers.com 4/29/2009 3:03 PM p. 3/9
  • 4. U.S. PRODUCTIVITY & OIL PRICES U.S. Productivity Trends 5.0% Productivity (% chg. vs. previous year) 4.0% 3.0% 2.0% 1.0% 0.0% -1.0% Definition: Productivity = annual output / worker Source: http://www.bls.gov/data/home.htm Price of Oil: Fall in price of oil: 6/30/08 -- $4.06/gal. ─→ 4/20/09 -- $2.06/gal US gasoline consumption: 320.5 million gals./day Annualized savings due to fall in price: $234 billion Compare with June 2008 tax rebate quot;stimulusquot;: $160 billion Source: http://www.eia.doe.gov/ Tom Campbell 090429.xlsm © 2009 Lucidity™ (fair use permitted) — http://www.painting-with-numbers.com 4/29/2009 3:03 PM p. 4/9
  • 5. U.S. GDP & FEDERAL BUDGET OVERVIEW ($ in billions) 2000 2001 2002 2003 2004 2005 2006 2007 2008 2009 (E) GDP 10,060 10,378 10,804 11,504 12,245 13,023 13,670 13,807 14,413 14,701 Deficit(Surplus) (86) 32 317 538 568 494 435 344 455 1,800 % of GDP (0.9%) 0.3% 2.9% 4.7% 4.6% 3.8% 3.2% 2.5% 3.2% 12.2% Total Debt 5,792 6,213 6,783 7,379 7,618 8,170 8,680 9,229 10,700 12,000 % of GDP 58% 60% 63% 64% 62% 63% 63% 67% 74% 82% Annual debt service, 2007: $184B Years to pay back federal debt, at current rate, if NO NEW BORROWING: 293 Mandatory part of federal budget: 61% Five-year growth in Medicare: 54% Medicaid: 53% Social Security: 28% Unfunded liabilities (in addition to debt): $58.6 trillion Annualized Growth Rates 2007 2008 Q1 Q2 Q3 Q4 Q1 Q2 Q3 Q4 GDP 0.1% 4.8% 4.8% (0.2%) 0.9% 2.8% (0.5%) (6.2%) Personal consumption 3.9% 2.0% 2.0% 1.0% 0.9% 1.2% (3.8%) (4.3%) Exports 0.6% 8.8% 23.0% 4.4% 5.1% 12.3% 3.0% (23.6%) Residential investment (16.2%) (11.5%) (20.6%) (27.0%) (25.1%) (13.3%) (16.0%) (22.2%) Sources: http://www.treasurydirect.gov.govt/govt.htm http://www.treasurydirect.gov/govt/reports/pd/pd_debtposactrpt_0907.pdf http://www.cbo.gov/ftpdocs/89xx/doc8917/01-23-2008_BudgetOutlook.pdf http://www.bea.gov/newsreleases/national/gdp/gdpnewsrelease.htm Tom Campbell 090429.xlsm © 2009 Lucidity™ (fair use permitted) — http://www.painting-with-numbers.com 4/29/2009 3:03 PM p. 5/9
  • 6. THE MONEY SUPPLY -- AN EXERCISE IN BASIC ECONOMICS The Basic Principle: MV = PQ where M = money supply V = velocity of money (i.e., how often money changes hands in a year) P = price level Q = GDP So. . . If the money supply (M) increases, some combination of the following must occur: Comments a. V decreases Significant change very unlikely b. P increases c. Q increases Coming out of a recession, 5% would be tremendous In other words, most of a large increase in the money supply must be absorbed through inflation (P). What has happened to the money supply lately? In the last year, Federal spending not offset by revenue sources has included ($ in billions): Mar-09 1,000 Federal Reserve announces additional spending to purchase mortgages and bonds Mar-09 200 Additional amounts in Federal Budget, not offset Feb-09 280 Federal assistance to Freddie, Mac, Fannie Mae, and individual mortgage holders Feb-09 789 Federal stimulus package Aug-08 350 Federal quot;TARPquot; (another $350 authorized but not yet spent) Jul-08 160 Tax rebate quot;stimulusquot; checks 2,779 Total increase in money supply 8,275 Money supply before the above additions Increase ÷ Current Supply = 34% . . . In other words, the Federal spending listed above will increase the money supply by one-third! Source: http://www.federalreserve.gov/releases/h6/hist/h6hist1.txt Tom Campbell 090429.xlsm © 2009 Lucidity™ (fair use permitted) — http://www.painting-with-numbers.com 4/29/2009 3:03 PM p. 6/9
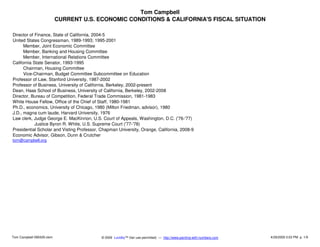
  • 7. CALIFORNIA'S FISCAL SITUATION California State Gov't Revenues & Expenditures (in $ billion) 102.6 103.6 104.5 101.4 100.0 93.5 91.6 95.5 93.2 80.6 82.2 81.8 78.1 76.8 77.5 76.9 76.3 80.0 71.4 72.3 60.0 Revenue 40.0 Expenditures Surplus(Deficit) 20.0 3.1 0.5 0.4 1.9 0.0 (1.0) (6.6) (4.5) (5.9) (20.0) (11.3) 2000-01 2001-02 2002-03 2003-04 2004-05 2005-06 2006-07 2007-08 2008-09 (E) Annual debt service: $3.4 billion Total debt: $63 billion. Years to pay off, at current rate, IF NO NEW BORROWING: 84 years Mandatory part of California budget: 60% Unfunded liabilities (in addition to debt): $99 billion (low estimate) If we adjusted Gov. Gray Davis' First Budget for Inflation and Population since then—and spent no more – we'd be balanced today! 1998 2008 Expenditures in CA state budget $57.8 $103.6 Population 33.3MM 38.0MM Take $57.8 billion. Express it in 2009 dollars: $74.9 billion. Increase it by percentage growth of population since 1998: $85.5 billion Total revenue est. 2008-09: $93.2 billion! ($87.5 excl. transfers/carryforwards) Sources: http://www.lao.ca.gov/laoapp/laomenus/lao_menu_economics.aspx http://www.taxfoundation.org/taxdata/show/228.html http://articles.moneycentral.msn.com/Taxes/Advice/PropertyTaxesWhereDoesYourStateRank.aspx Tom Campbell 090429.xlsm © 2009 Lucidity™ (fair use permitted) — http://www.painting-with-numbers.com 4/29/2009 3:03 PM p. 7/9
  • 8. CALIFORNIA STATE TAXES, COMPARED TO OTHER STATES State Tax Levels, by type of tax CA MA 10.0% 9.6% 9.5% 5,000 CA OR CA 9.0% CA 8.8% AZ NY 8.3% NV 8.0% 7.7% 4,000 AZ NY OR 7.0% OR 7.1% NV 6.5% TX 6.6% NY MA TX 6.3% 3,076 AZ 2,974 6.0% MA 5.6% 3,000 NY AZ 5.3% MA 5.0% 5.0% CA MA NY 2,278 OR TX 4.0% 1,910 1,926 4.0% 2,000 NV 1,445 AZ 1,133 2.0% 1,000 NV TX OR NV TX 0.0% 0.0% 0.0% 0.0% 0.0% 0.0% - Income Tax State Sales Tax Business Tax Property Tax (top rate) (excl. cities) (median $ pmt.) California ranks . . . -- among -- Type the 7 All of states 50 Tax shown States Income #1 #1 Sales #1 #1 Business #2 #8 Property #3 #10 Note: California's property tax rate ranks 45th, but its median property tax paid ranks 10th, because of the higher cost of real estate Sources: http://www.lao.ca.gov/laoapp/laomenus/lao_menu_economics.aspx http://www.taxfoundation.org/taxdata/show/228.html http://articles.moneycentral.msn.com/Taxes/Advice/PropertyTaxesWhereDoesYourStateRank.aspx http://www.taxfoundation.org/files/bp58.pdf (Table 8) Tom Campbell 090429.xlsm © 2009 Lucidity™ (fair use permitted) — http://www.painting-with-numbers.com 4/29/2009 3:03 PM p. 8/9
  • 9. DISTRIBUTION OF U.S. INCOME & TAX PAYMENTS Share of Individual Income & Taxes Paid (2000 Data) 100.0% 80.0% Cumulative Share (%) 60.0% U.S. Income Federal Taxes Paid CA Taxes Paid 40.0% quot;Uniformquot; 20.0% 0.0% 0% 20% 40% 60% 80% 100% Percentile of Income (e.g., 5% means top 5% of earners) California state personal income taxes: 50% is paid by the top 3% of households 70% is paid by the top 9% 93% is paid by the top one-third Sources: “Effective Federal Tax Rates 1997 to 2000,” CBO (August 2003) p. 27 (data for 2000) quot;California's Tax System: A Primer,quot; LAO (2001) chapter 2, p. 3 Tom Campbell 090429.xlsm © 2009 Lucidity™ (fair use permitted) — http://www.painting-with-numbers.com 4/29/2009 3:03 PM p. 9/9