SlideShare uma empresa Scribd logo
1 de 42
Baixar para ler offline
Austin Association of Realtors MLS
                                     Summary MLS Report for: February 2011


                                             % Change        Dollar        % Change     Average     % Change
Property Type                      Sales     Year Ago        Volume        Year Ago      Price      Year Ago
Single Family                      1,112         0%       $271,752,784             0%   $244,382        0%
Townhouse/Condominium                102       -24%        $21,889,506             5%   $214,603       38%
Farm/Ranches                          26       -16%         $8,844,238         29%      $340,163       53%
Multifamily                           37        28%         $6,213,817             6%   $167,941      -17%
Lots                                  80       -15%         $8,831,040        -21%      $110,388       -7%
Commercial                            12       -25%         $3,213,696        -14%      $267,808       14%
Lease                              1,117         5%         $1,429,760         12%        $1,280        7%
Commercial Lease                      12       -20%            $15,252        -25%        $1,271       -7%


                                Median       % Change             Price/    % Change                % Change
Property Type                    Price       Year Ago              Sqft     Year Ago       DOM      Year Ago
Single Family                  $193,000          2%              $110          -2%           98        27%
Townhouse/Condominiu           $156,650         10%              $184          40%          110        57%
Farm/Ranches                   $221,000         36%              $150          42%          218        20%
Multifamily                    $160,000         -9%                $75         -7%           42       -26%
Lots                             $53,000         1%                                         242        34%
Commercial                     $200,000         11%                $73         76%          179       -39%
Lease                             $1,200         9%                $68             2%        48       -20%
Commercial Lease                    $950       -21%                $33             2%       207       -11%


                                 Pending     % Change            New       % Change       Active    % Change
Property Type                     Sales      Year Ago           Listings   Year Ago      Listings   Year Ago
Single Family                       1,543      -11%               2,335       -24%         8,605       -8%
Townhouse/Condominium                153       -23%                 294       -31%         1,190      -20%
Farm/Ranches                           44       19%                 145        15%         1,088       0%
Multifamily                            41      -21%                   72      -33%           317      -19%
Lots                                 117        30%                 524        12%         4,499       -3%
Commercial                             13      -61%                  98         0%           991       -2%
Lease                               1,130        5%                 996        -2%         1,162      -31%
Commercial Lease                       11      -31%                   43      -16%           270      -14%


Note: Current month sales are preliminary
15-Mar-11                    Real Estate Center at Texas A&M University and ABoR                       Page 1-1
Austin Association of Realtors MLS
                             Year-to-Date Summary MLS Report for: February 2011


                                           % Change         Dollar         % Change     Average     % Change
Property Type                    Sales     Year Ago         Volume         Year Ago      Price      Year Ago
Single Family                    2,058          4%        $508,916,876            5%    $247,287        1%
Townhouse/Condominium              195        -25%         $37,866,627            -5%   $194,188       27%
Farm/Ranches                        52          2%         $17,583,228        32%       $338,139       30%
Multifamily                         74         35%         $12,520,282        24%       $169,193        -8%
Lots                               154         -9%         $15,602,188        -21%      $101,313       -14%
Commercial                          26          8%          $6,156,384            -7%   $236,784       -14%
Lease                            2,279          4%          $2,906,662        11%         $1,275        7%
Commercial Lease                    27          4%             $41,562        19%         $1,539       14%


                               Median      % Change              Price/    % Change                 % Change
Property Type                   Price      Year Ago               Sqft     Year Ago        DOM      Year Ago
Single Family                 $191,120          3%               $111             0%         96        20%
Townhouse/Condominiu          $155,000         11%               $161         24%           104        24%
Farm/Ranches                  $211,750         18%               $147         23%           268        71%
Multifamily                   $162,930         -5%                $72             -5%        56        -12%
Lots                           $56,000         -3%                                          229        22%
Commercial                    $195,000        -24%                $71        107%           177        -38%
Lease                           $1,150          5%                $66             3%         50        -19%
Commercial Lease                $1,150         -8%                $54         67%           174         -6%


                               Pending     % Change             New       % Change        Active    % Change
Property Type                   Sales      Year Ago            Listings   Year Ago       Listings   Year Ago
Single Family                     2,953        -6%               4,738        -19%         8,375       -6%
Townhouse/Condominium               278       -31%                 626        -33%         1,167      -18%
Farm/Ranches                         80        10%                 283            -3%      1,061       -3%
Multifamily                          85        -7%                 171        -26%           326      -17%
Lots                               226         18%                 974         -3%         4,452       -2%
Commercial                          32        -29%                 208        -11%           967       -4%
Lease                             2,385         3%               2,220            1%       1,240      -30%
Commercial Lease                     25       -24%                  80        -22%           269      -12%


Note: Current month sales are preliminary
15-Mar-11                   Real Estate Center at Texas A&M University and ABoR                       Page 2-1
Austin Association of Realtors MLS
Sales Closed by Month: February 2011
Single Family
                                     Average        Median       Price per     New          Active    Pending          Sold to
   Year      Month       Sales        Price          Price         Sqft       Listings     Listings    Sales    DOM   List Price
   2009     Jan           840        $231,006       $176,750       $107          2,693       8,738      1,327    86      94.3%
   2009     Feb         1,106        $241,262       $189,900       $110          2,647       9,373      1,406    89      94.7%
   2009     Mar         1,404        $230,931       $180,000       $107          3,238       9,704      1,846    87      95.1%
   2009     Apr         1,561        $233,868       $190,000       $109          3,221       9,889      1,919    79      95.6%
   2009     May         1,675        $253,691       $195,000       $115          3,065       9,939      2,132    79      95.7%
   2009     Jun         2,072        $251,920       $199,920       $114          3,232      10,107      2,084    81      95.9%
   2009     Jul         2,034        $246,026       $193,250       $113          3,247       9,988      1,996    75      96.3%
   2009     Aug         1,757        $244,666       $190,000       $112          2,918       9,555      1,980    76      96.2%
   2009     Sep         1,738        $242,432       $188,190       $113          2,692       9,148      1,886    71      95.7%
   2009     Oct         1,778        $237,778       $180,000       $113          2,670       8,948      1,811    73      95.8%
   2009     Nov         1,557        $238,891       $178,000       $113          2,193       8,551      1,232    77      95.8%
   2009     Dec         1,355        $259,225       $192,000       $114          1,731       8,079      1,073    87      95.6%
   2010     Jan           858        $246,716       $179,590       $112          2,805       8,569      1,417    84      95.3%
   2010     Feb         1,115        $244,220       $190,000       $112          3,067       9,335      1,738    77      95.3%
   2010     Mar         1,771        $236,569       $181,000       $111          4,170      10,300      2,421    73      96.3%
   2010     Apr         2,019        $235,590       $190,000       $111          4,415      10,749      2,813    69      96.6%
   2010     May         2,059        $242,745       $190,640       $113          3,072      11,230      1,405    64      96.8%
   2010     Jun         1,962        $275,623       $205,700       $122          3,287      11,749      1,610    70      95.9%
   2010     Jul         1,499        $284,125       $220,000       $122          3,238      11,774      1,556    73      95.6%
   2010     Aug         1,489        $265,605       $199,900       $117          2,621      11,106      1,502    77      95.8%
   2010     Sep         1,280        $248,211       $192,000       $112          2,406      10,453      1,371    81      95.4%
   2010     Oct         1,218        $260,472       $196,020       $115          2,235       9,703      1,402    93      94.9%
   2010     Nov         1,223        $248,964       $183,240       $114          1,819       8,741      1,260    91      95.1%
   2010     Dec         1,419        $247,926       $190,000       $111          1,577       8,182      1,102    98      95.5%
   2011     Jan           946        $250,702       $190,000       $113          2,403       8,144      1,410    93      95.3%
   2011     Feb         1,112        $244,382       $193,000       $110          2,335       8,605      1,543    98      96.0%


Note: Current month data are preliminary
15-Mar-11                            Real Estate Center at Texas A&M University and ABoR                                 Page 3-1
Austin Association of Realtors MLS
Sales Closed by Month: February 2011
Townhouse/Condominium
                                     Average        Median       Price per     New          Active    Pending           Sold to
   Year      Month       Sales        Price          Price         Sqft       Listings     Listings    Sales    DOM    List Price
   2009     Jan            74        $154,965       $140,000       $137            446       1,635       129      88      95.3%
   2009     Feb            86        $170,713       $138,850       $149            415       1,556       122      87      95.2%
   2009     Mar            94        $177,769       $151,650       $154            421       1,576       158      91      96.1%
   2009     Apr           131        $173,887       $159,900       $140            403       1,573       199      89      95.7%
   2009     May           177        $192,359       $159,000       $157            400       1,596       231      88      95.9%
   2009     Jun           182        $178,344       $153,890       $153            415       1,574       214      76      94.1%
   2009     Jul           229        $178,944       $158,400       $156            441       1,461       236      89      96.0%
   2009     Aug           202        $170,306       $156,000       $150            357       1,385       209      82      95.9%
   2009     Sep           196        $181,315       $151,500       $158            324       1,338       191      81      96.1%
   2009     Oct           175        $183,070       $155,000       $155            345       1,352       192      97      96.2%
   2009     Nov           172        $169,830       $150,500       $147            289       1,285       137     94       96.7%
   2009     Dec           152        $165,983       $135,500       $141            238       1,287       143     63       96.0%
   2010     Jan           127        $150,526       $139,000       $129            511       1,362       205     99       96.9%
   2010     Feb           134        $155,079       $142,750       $132            425       1,490       198      70      95.9%
   2010     Mar           216        $195,686       $157,750       $158            488       1,546       256      77      96.2%
   2010     Apr           211        $177,567       $158,800       $147            491       1,521       338      75      96.2%
   2010     May           227        $191,393       $157,850       $158            352       1,556       167      83      96.5%
   2010     Jun           228        $190,694       $158,050       $156            455       1,604       165      79      96.4%
   2010     Jul           141        $199,153       $159,900       $164            388       1,562       189      90      97.1%
   2010     Aug           186        $199,855       $162,840       $160            303       1,469       150      82      96.3%
   2010     Sep           126        $193,721       $162,700       $150            246       1,381       134      93      96.7%
   2010     Oct           117        $205,962       $160,000       $151            260       1,300       123      99      96.0%
   2010     Nov           102        $197,616       $156,440       $154            224       1,165       124     102      96.2%
   2010     Dec           131        $226,974       $178,830       $171            181       1,102       122     91       95.8%
   2011     Jan            93        $171,797       $153,000       $138            332       1,143       125     98       97.3%
   2011     Feb           102        $214,603       $156,650       $184            294       1,190       153     110      96.2%


Note: Current month data are preliminary
15-Mar-11                            Real Estate Center at Texas A&M University and ABoR                                  Page 3-2
Austin Association of Realtors MLS
Sales Closed by Month: February 2011
Farm/Ranches
                                     Average        Median       Price per     New          Active    Pending           Sold to
   Year      Month       Sales        Price          Price         Sqft       Listings     Listings    Sales    DOM    List Price
   2009     Jan            26        $477,614       $184,500       $296            150         996        41     132      92.0%
   2009     Feb            24        $417,217       $180,000       $201            128       1,015        20     162      80.4%
   2009     Mar            23        $251,450       $166,100       $139            142       1,037        29     175      92.7%
   2009     Apr            17        $183,939       $131,000        $91            141       1,069        37      96      90.7%
   2009     May            39        $345,797       $210,000       $182            147       1,109        45     183      90.2%
   2009     Jun            35        $390,032       $247,000       $115            154       1,151        39     141      81.9%
   2009     Jul            32        $250,037       $173,200       $130            156       1,181        43     156      88.0%
   2009     Aug            33        $260,247       $200,000       $131            155       1,190        38     155      92.6%
   2009     Sep            30        $319,660       $242,000       $141            119       1,177        26     172      87.0%
   2009     Oct            19        $205,519       $130,620        $93            139       1,173        29     168      81.7%
   2009     Nov            24        $544,374       $188,000       $199             98       1,133        24     127      82.8%
   2009     Dec            33        $292,980       $225,000       $136             96       1,080        31     204      83.4%
   2010     Jan            20        $320,846       $188,010       $138            167       1,100        36     118      85.1%
   2010     Feb            31        $221,613       $163,000       $106            126       1,088        37     182      86.9%
   2010     Mar            35        $322,814       $190,000       $132            162       1,113        41     182      85.6%
   2010     Apr            38        $299,739       $227,000       $140            150       1,154        61     158      84.1%
   2010     May            41        $361,677       $265,000       $144            183       1,192        44     171      92.3%
   2010     Jun            46        $352,470       $245,500       $138            140       1,182        38     219      89.6%
   2010     Jul            36        $578,212       $200,000       $306            133       1,191        32     151      75.5%
   2010     Aug            37        $280,966       $190,000       $150            130       1,176        41     162      85.9%
   2010     Sep            26        $453,627       $265,000       $201            127       1,155        31     187      93.0%
   2010     Oct            29        $232,590        $97,000        $88            118       1,147        46     152      93.6%
   2010     Nov            29        $442,914       $272,500       $192            112       1,103        24     199      88.2%
   2010     Dec            42        $445,316       $180,000       $308             76       1,027        27     244      84.9%
   2011     Jan            26        $336,115       $196,570       $144            138       1,033        36     318      87.7%
   2011     Feb            26        $340,163       $221,000       $150            145       1,088        44     218      88.1%


Note: Current month data are preliminary
15-Mar-11                            Real Estate Center at Texas A&M University and ABoR                                  Page 3-3
Austin Association of Realtors MLS
Sales Closed by Month: February 2011
Multifamily
                                     Average        Median       Price per     New          Active    Pending           Sold to
   Year      Month       Sales        Price          Price         Sqft       Listings     Listings    Sales    DOM    List Price
   2009     Jan            22        $232,677       $186,750        $91             99         376        28      42      96.3%
   2009     Feb            25        $185,884       $180,000        $79             87         405        28     123      94.6%
   2009     Mar            33        $165,092       $162,000        $69            125         425        50      81      97.9%
   2009     Apr            41        $204,150       $170,000        $78            113         406        55      56      96.3%
   2009     May            41        $197,421       $178,800        $80            103         410        46      58      96.7%
   2009     Jun            43        $197,440       $169,900        $71             97         415        50      87      96.5%
   2009     Jul            48        $172,360       $152,500        $78             97         425        25      71      95.8%
   2009     Aug            26        $185,092       $165,500        $84            108         442        45     126      96.0%
   2009     Sep            31        $211,414       $192,900        $92            105         433        44      67      96.5%
   2009     Oct            37        $191,270       $168,400        $79            112         417        60     80       95.0%
   2009     Nov            51        $199,534       $175,000        $88             77         385        31     64       95.4%
   2009     Dec            38        $195,434       $175,500        $79             73         348        37     71       96.2%
   2010     Jan            26        $163,008       $156,000        $70            124         391        39     71       96.2%
   2010     Feb            29        $202,497       $175,000        $81            107         393        52      57      94.8%
   2010     Mar            44        $163,070       $162,500        $72            119         427        58      82      95.5%
   2010     Apr            50        $184,204       $164,350        $82            140         433        71      47      96.7%
   2010     May            38        $184,166       $166,250        $78            101         457        44      78      96.6%
   2010     Jun            48        $181,317       $159,000        $74             85         462        35      80      96.5%
   2010     Jul            29        $211,619       $170,000        $80            108         471        44      73      94.3%
   2010     Aug            40        $163,721       $164,950        $71             91         429        50      68      95.9%
   2010     Sep            49        $172,486       $152,000        $73            111         416        49     84       96.0%
   2010     Oct            42        $201,340       $187,250        $83            100         411        48     73       94.0%
   2010     Nov            37        $184,991       $179,000        $81             65         376        46     59       96.0%
   2010     Dec            48        $143,061       $135,750        $57             68         326        50     71       94.3%
   2011     Jan            37        $170,445       $166,340        $70             99         334        44     70       95.6%
   2011     Feb            37        $167,941       $160,000        $75             72         317        41      42      96.9%


Note: Current month data are preliminary
15-Mar-11                            Real Estate Center at Texas A&M University and ABoR                                  Page 3-4
Austin Association of Realtors MLS
Sales Closed by Month: February 2011
Lots
                                     Average        Median       Price per     New          Active    Pending           Sold to
   Year      Month       Sales        Price          Price         Sqft       Listings     Listings    Sales    DOM    List Price
   2009     Jan            54         $72,733        $45,000                       517       4,013        79     143      89.7%
   2009     Feb            75         $87,852        $44,500                       486       4,199        86     135      82.8%
   2009     Mar            77         $96,272        $45,000                       535       4,238        91     183      86.6%
   2009     Apr            82        $102,665        $49,000                       416       4,370        91     150      89.2%
   2009     May            74        $126,565        $59,500                       540       4,461        97     141      89.3%
   2009     Jun            81         $86,410        $60,500                       440       4,583       116     167      88.5%
   2009     Jul           110        $127,855        $60,000                       652       4,708       113     139      88.9%
   2009     Aug           107         $98,857        $35,000                       438       4,755       107     129      89.5%
   2009     Sep           100         $85,253        $44,000                       379       4,725       102     146      90.3%
   2009     Oct            88        $117,585        $50,000                       384       4,724       105     170      91.7%
   2009     Nov            78         $79,320        $50,380                       343       4,657        72     180      90.8%
   2009     Dec            85        $127,976        $52,000                       243       4,352        97     174      87.7%
   2010     Jan            75        $116,336        $60,000                       533       4,470       101     198      88.5%
   2010     Feb            94        $118,354        $52,500                       469       4,618        90     180      88.9%
   2010     Mar            85         $78,891        $54,300                       559       4,738       121     189      91.6%
   2010     Apr           109        $116,439        $60,000                       445       4,776       120     190      88.8%
   2010     May            94        $115,411        $54,000                       554       4,803        99     175      88.1%
   2010     Jun           109        $131,402        $65,000                       506       4,805       126     187      89.1%
   2010     Jul            99        $102,619        $52,000                       456       4,868       100     182      91.5%
   2010     Aug           105        $112,928        $37,250                       467       4,818       117     219      85.3%
   2010     Sep            91         $72,639        $54,000                       392       4,798        96     170      87.7%
   2010     Oct           120         $79,061        $50,000                       295       4,667        99     227      85.2%
   2010     Nov            84        $128,730        $65,000                       294       4,497       102     160      89.8%
   2010     Dec            93        $129,427        $60,000                       239       4,255        86     192      85.6%
   2011     Jan            74         $91,502        $60,000                       450       4,405       109     215      89.3%
   2011     Feb            80        $110,388        $53,000                       524       4,499       117     242      85.2%


Note: Current month data are preliminary
15-Mar-11                            Real Estate Center at Texas A&M University and ABoR                                  Page 3-5
Austin Association of Realtors MLS
Sales Closed by Month: February 2011
Commercial
                                     Average        Median       Price per     New          Active    Pending           Sold to
   Year      Month       Sales        Price          Price         Sqft       Listings     Listings    Sales    DOM    List Price
   2009     Jan            13        $228,632       $177,000     $9,614            125       1,001        25     123      82.1%
   2009     Feb            12        $321,000       $286,000     $8,084            115       1,068        14     165      85.8%
   2009     Mar            18        $330,617       $284,300     $7,019            115       1,064        20     122      85.8%
   2009     Apr            14        $363,291       $355,000     $6,353            105       1,085        18     165      82.7%
   2009     May            13        $405,923       $300,000     $5,015            106       1,062        18     100      80.0%
   2009     Jun              8       $374,488       $290,500     $8,159            103       1,062        27     187      89.2%
   2009     Jul            24        $392,790       $199,500     $6,953            101       1,047        27     144      88.2%
   2009     Aug            19        $335,778       $215,000     $7,978            110       1,052        20     198      85.0%
   2009     Sep            13        $286,538       $200,000    $11,119            121       1,071        15     125      80.7%
   2009     Oct            14        $365,779       $392,500     $9,256             87       1,048        23     186      85.0%
   2009     Nov            14        $352,307       $155,000    $12,732             92       1,038        19     200      87.4%
   2009     Dec            23        $382,956       $283,750     $6,218             82         968        19     152      79.9%
   2010     Jan              8       $354,336       $305,340     $2,759            136       1,012        12     280      89.7%
   2010     Feb            16        $234,798       $180,490     $4,151             98       1,008        33     292      74.0%
   2010     Mar            20        $242,188       $132,000     $4,769            105       1,019        20     194      92.5%
   2010     Apr            25        $436,461       $220,000    $14,549            100         990        31     139      84.9%
   2010     May            10        $452,000       $272,500     $8,235             92         991        17     142      91.7%
   2010     Jun            13        $369,781       $205,000     $5,210             90         992        18     195      83.0%
   2010     Jul            22        $770,727       $277,500    $19,283            119       1,004        20     246      72.5%
   2010     Aug            12        $283,412       $205,750     $3,127            115       1,007        18     216      84.8%
   2010     Sep            17        $356,853       $325,000     $8,670             97       1,002        23     199      86.4%
   2010     Oct            19        $222,188       $178,000     $7,557             85         997        19     153      77.6%
   2010     Nov            13        $562,569       $363,000    $11,153             79       1,018        13     157      88.4%
   2010     Dec            23        $397,012       $250,000    $10,203             63         944        16     287      89.3%
   2011     Jan            14        $210,192       $177,500     $6,856            110         942        19     176      87.2%
   2011     Feb            12        $267,808       $200,000     $7,289             98         991        13     179      88.9%


Note: Current month data are preliminary
15-Mar-11                            Real Estate Center at Texas A&M University and ABoR                                  Page 3-6
Austin Association of Realtors MLS
Sales Closed by Month: February 2011
Lease
                                    Average         Median       Price per     New          Active    Pending          Sold to
   Year      Month     Leases        Rent            Rent        100 Sqft     Listings     Listings    Sales    DOM   List Price
   2009     Jan         1,071          $1,272         $1,150        $67          1,375       2,381      1,150    62      98.7%
   2009     Feb           981          $1,223         $1,150        $65          1,221       2,301      1,004    60      98.8%
   2009     Mar         1,050          $1,226         $1,150        $63          1,306       2,232      1,064    57      99.0%
   2009     Apr         1,030          $1,318         $1,200        $68          1,352       2,339      1,141    59      99.1%
   2009     May         1,168          $1,346         $1,200        $69          1,705       2,665      1,268    54      99.3%
   2009     Jun         1,379          $1,349         $1,200        $70          1,997       2,837      1,438    52      99.0%
   2009     Jul         1,740          $1,362         $1,240        $71          2,088       2,740      1,891    47      99.2%
   2009     Aug         1,694          $1,314         $1,200        $71          1,803       2,782      1,411    49      99.1%
   2009     Sep         1,107          $1,260         $1,150        $64          1,430       2,851      1,120    53      98.7%
   2009     Oct         1,057          $1,270         $1,150        $67          1,379       2,720      1,049    56      98.6%
   2009     Nov           929          $1,202         $1,100        $65          1,191       2,623       907     61      98.7%
   2009     Dec         1,049          $1,244         $1,100        $66          1,161       2,222      1,058    64      98.6%
   2010     Jan         1,128          $1,185         $1,100        $62          1,175       1,862      1,250    63      98.8%
   2010     Feb         1,062          $1,201         $1,100        $66          1,014       1,676      1,072    60      99.0%
   2010     Mar         1,079          $1,252         $1,150        $66          1,286       1,625      1,130    57      98.6%
   2010     Apr         1,147          $1,311         $1,180        $69          1,447       1,785      1,233    49      99.3%
   2010     May         1,216          $1,295         $1,200        $70          1,726       2,048      1,354    43      99.5%
   2010     Jun         1,492          $1,378         $1,220        $68          2,106       2,202      1,605    40      99.2%
   2010     Jul         1,869          $1,375         $1,250        $72          2,188       2,225      1,980    41      99.3%
   2010     Aug         1,897          $1,351         $1,220        $69          1,924       2,308      1,576    42      99.1%
   2010     Sep         1,223          $1,305         $1,200        $66          1,469       2,226      1,239    44      98.8%
   2010     Oct         1,205          $1,293         $1,200        $66          1,332       2,038      1,179    48      99.1%
   2010     Nov         1,098          $1,290         $1,200        $67          1,206       1,914      1,097    53      99.2%
   2010     Dec         1,096          $1,264         $1,150        $66          1,065       1,626      1,100    55      99.3%
   2011     Jan         1,162          $1,271         $1,150        $65          1,224       1,317      1,255    52      99.2%
   2011     Feb         1,117          $1,280         $1,200        $68            996       1,162      1,130    48      99.3%


Note: Current month data are preliminary
15-Mar-11                            Real Estate Center at Texas A&M University and ABoR                                 Page 3-7
Austin Association of Realtors MLS
Sales Closed by Month: February 2011
Commercial Lease
                                    Average         Median       Price per     New          Active    Pending           Sold to
   Year      Month     Leases        Rent            Rent        100 Sqft     Listings     Listings    Sales    DOM    List Price
   2009     Jan              9         $1,163         $1,250        $35             40         221        10     119      97.0%
   2009     Feb            11          $1,104         $1,050        $48             51         230        12     103      96.3%
   2009     Mar            10          $1,200         $1,400        $55             44         240        10     149      99.7%
   2009     Apr            11          $1,099         $1,200        $36             40         242        11     153      94.8%
   2009     May            10          $2,034         $1,880        $45             28         242        14     182      94.4%
   2009     Jun            13          $1,875         $1,350        $33             32         242        12     149      94.0%
   2009     Jul            15          $1,143         $1,200        $33             40         242        13     144      93.2%
   2009     Aug            14          $1,462         $1,300        $26             33         242        12     163     100.3%
   2009     Sep            14          $1,558         $1,200        $44             44         247        15     161      88.8%
   2009     Oct            13          $7,965         $2,000       $170             31         263        13     143      91.2%
   2009     Nov            11          $1,043         $1,140        $22             49         288        16     181      99.9%
   2009     Dec            11          $1,635         $1,700       $106             54         293         5     117      94.3%
   2010     Jan            11          $1,321         $1,350        $32             52         296        17     123      96.4%
   2010     Feb            15          $1,362         $1,200        $32             51         313        16     232      98.1%
   2010     Mar            18          $1,101           $990        $10             46         316        16     129      96.3%
   2010     Apr            14          $1,599         $1,310        $35             27         306        14     191     100.5%
   2010     May            12          $1,211         $1,250        $32             34         310        15     153      94.8%
   2010     Jun             6          $1,233         $1,100        $10             25         296         7     138      97.0%
   2010     Jul            14          $1,739         $1,670        $54             31         278        12     131      94.4%
   2010     Aug            13          $1,119         $1,010        $70             26         267        19     122      88.5%
   2010     Sep            18          $1,214         $1,020        $28             44         269        14     160      97.7%
   2010     Oct            16          $1,222         $1,380        $41             55         278        19     206      93.6%
   2010     Nov            12          $1,640         $1,610        $47             33         279        12     220      96.9%
   2010     Dec            18          $1,187         $1,080        $36             32         248        18     308      94.7%
   2011     Jan            15          $1,754         $1,250        $84             37         268        14     148      97.8%
   2011     Feb            12          $1,271           $950        $33             43         270        11     207      93.5%


Note: Current month data are preliminary
15-Mar-11                            Real Estate Center at Texas A&M University and ABoR                                  Page 3-8
Austin Association of Realtors MLS
Sales Closed by Price Class for: February 2011
Single Family
                                                     Percent            Sales              % Change    Active    Estimated
               Price Class                 Sales   Distribution      Year-to-Date          Year Ago   Listings   Days to Sell

            $1 to $19,999                      2         0.2%                   4             300%           1             8
      $20,000 to $29,999                       1         0.1%                   4              33%           3            23
      $30,000 to $39,999                       2         0.2%                   5              -17%         20          122
      $40,000 to $49,999                       6         0.5%                  11              -21%         38          105
      $50,000 to $59,999                      17         1.5%                  30              76%          60            61
      $60,000 to $69,999                      18         1.6%                  31              48%          74            73
      $70,000 to $79,999                      13         1.2%                  28              -24%        108          117
      $80,000 to $89,999                      25         2.2%                  45              50%         142            96
      $90,000 to $99,999                      25         2.2%                  46              44%         180          119
   $100,000 to $109,999                       32         2.9%                  55               -8%        166            92
   $110,000 to $119,999                       47         4.2%                  94              19%         280            91
   $120,000 to $129,999                       61         5.5%                 108               2%         320            90
   $130,000 to $139,999                       49         4.4%                  93              -20%        365          119
   $140,000 to $149,999                       52         4.7%                  93               -6%        386          126
   $150,000 to $159,999                       56         5.0%                 102              -19%        356          106
   $160,000 to $169,999                       57         5.1%                 103               -5%        348          103
   $170,000 to $179,999                       41         3.7%                  89              -10%        374          128
   $180,000 to $189,999                       37         3.3%                  72              31%         306          129
   $190,000 to $199,999                       39         3.5%                  67              -15%        269          122
   $200,000 to $249,999                      158        14.2%                 279               2%       1,092          119
   $250,000 to $299,999                      119        10.7%                 223              27%         758          103
   $300,000 to $399,999                      120        10.8%                 242              13%         961          121
   $400,000 to $499,999                       50         4.5%                  88              -11%        555          192
   $500,000 to $599,999                       31         2.8%                  52              24%         372          218
   $600,000 to $699,999                       16         1.4%                  25              32%         211          257
   $700,000 to $799,999                       14         1.3%                  19               0%         141          226
   $800,000 to $899,999                        6         0.5%                   8              -38%        120          456
   $900,000 to $999,999                        6         0.5%                  12             500%         101          256
    $1,000,000 and more                       10         0.9%                  28               0%         498          541

                    Total                  1,112                            2,058               4%       8,605          127


Note: Current month data are preliminary
15-Mar-11                            Real Estate Center at Texas A&M University and ABoR                               Page 4-1
Austin Association of Realtors MLS
Sales Closed by Price Class for: February 2011
Townhouse/Condominium
                                                     Percent            Sales              % Change    Active    Estimated
               Price Class                 Sales   Distribution      Year-to-Date          Year Ago   Listings   Days to Sell

            $1 to $19,999                      0         0.0%                   0                            0
      $20,000 to $29,999                       0         0.0%                   1              -67%          0             0
      $30,000 to $39,999                       0         0.0%                   4              -69%         10            76
      $40,000 to $49,999                       2         2.0%                   3              -86%         13          132
      $50,000 to $59,999                       6         5.9%                  10              -52%         10            30
      $60,000 to $69,999                       4         3.9%                  10             100%          27            82
      $70,000 to $79,999                       2         2.0%                   3              -25%         25          254
      $80,000 to $89,999                       5         4.9%                   5              -38%         42          256
      $90,000 to $99,999                       6         5.9%                  11               0%          35            97
   $100,000 to $109,999                        0         0.0%                   1              -88%         34         1034
   $110,000 to $119,999                        2         2.0%                   8              14%          59          224
   $120,000 to $129,999                        6         5.9%                  11              -35%         56          155
   $130,000 to $139,999                        5         4.9%                  12               -8%         46          117
   $140,000 to $149,999                        6         5.9%                   9              13%          58          196
   $150,000 to $159,999                        7         6.9%                  13              -19%         51          119
   $160,000 to $169,999                        8         7.8%                  16               -6%         55          105
   $170,000 to $179,999                        2         2.0%                   5              -17%         39          237
   $180,000 to $189,999                        3         2.9%                   8              33%          33          125
   $190,000 to $199,999                        2         2.0%                   7              -30%         57          248
   $200,000 to $249,999                        5         4.9%                  10              -71%        139          423
   $250,000 to $299,999                      11         10.8%                  19              46%         125          200
   $300,000 to $399,999                      11         10.8%                  16               7%         129          245
   $400,000 to $499,999                        3         2.9%                   4              33%          61          464
   $500,000 to $599,999                        2         2.0%                   4             300%          25          190
   $600,000 to $699,999                        1         1.0%                   2             100%          19          289
   $700,000 to $799,999                        0         0.0%                   0                           13
   $800,000 to $899,999                        0         0.0%                   0                            7
   $900,000 to $999,999                        1         1.0%                   1                            4          122
    $1,000,000 and more                        1         1.0%                   1                           18          548

                    Total                   102                               195              -25%      1,190          186


Note: Current month data are preliminary
15-Mar-11                            Real Estate Center at Texas A&M University and ABoR                               Page 4-2
Austin Association of Realtors MLS
Sales Closed by Price Class for: February 2011
Lots
                                                     Percent            Sales              % Change    Active    Estimated
               Price Class                 Sales   Distribution      Year-to-Date          Year Ago   Listings   Days to Sell

            $1 to $19,999                    14         17.5%                  26               -4%        792          927
       $20,000 to $29,999                      7         8.8%                  16               0%         357          679
       $30,000 to $39,999                    10         12.5%                  17               0%         330          591
       $40,000 to $49,999                      7         8.8%                  12              -14%        263          667
       $50,000 to $59,999                      7         8.8%                  10              -23%        249          757
       $60,000 to $69,999                      6         7.5%                  12              33%         230          583
       $70,000 to $79,999                      2         2.5%                   7              -13%        211          917
       $80,000 to $89,999                      5         6.3%                   7               0%         182          791
       $90,000 to $99,999                      3         3.8%                   5              -38%        163          992
   $100,000 to $109,999                        0         0.0%                   4               0%          59          449
   $110,000 to $119,999                        2         2.5%                   4             100%         113          859
   $120,000 to $129,999                        1         1.3%                   4              -33%        129          981
   $130,000 to $139,999                        0         0.0%                   2              -50%         87         1323
   $140,000 to $149,999                        3         3.8%                   3             200%         112         1136
   $150,000 to $159,999                        1         1.3%                   2             100%          94         1430
   $160,000 to $169,999                        0         0.0%                   2              -33%         60          913
   $170,000 to $179,999                        1         1.3%                   2              -33%         95         1445
   $180,000 to $189,999                        0         0.0%                   0             -100%         68
   $190,000 to $199,999                        1         1.3%                   1               0%          99         3012
   $200,000 to $249,999                        4         5.0%                   8              60%         173          658
   $250,000 to $299,999                        2         2.5%                   3              50%         147         1491
   $300,000 to $399,999                        2         2.5%                   3               0%         162         1643
   $400,000 to $499,999                        0         0.0%                   1              -50%         96         2920
   $500,000 to $599,999                        0         0.0%                   0             -100%         57
   $600,000 to $699,999                        1         1.3%                   1               0%          44         1338
   $700,000 to $799,999                        1         1.3%                   1               0%          32          973
   $800,000 to $899,999                        0         0.0%                   1               0%          24          730
   $900,000 to $999,999                        0         0.0%                   0                           14
    $1,000,000 and more                        1         1.3%                   1              -50%         57         1734

                    Total                    80                               154               -9%      4,499          889


Note: Current month data are preliminary
15-Mar-11                            Real Estate Center at Texas A&M University and ABoR                               Page 4-3
Austin Association of Realtors MLS
Residential Sales Closed by Area, Ranked by Hotness for:                 February 2011

                                                                   Hotness         Pending                          Active     Estimated
     Area       Area Name                                          Ratio*           Sales                Sales     Listings   Days-to-Sell

7               7                                                       37.8             14                    5        37           79
SWW             Southwest West                                          36.9            41                 32          111           37
CLN             Cedar Park/Leander North                                34.7           104                 50          300           58
1A              1A                                                      34.5             20                16           58           55
1N              1N                                                      31.5             40                26          127           57
2               2                                                       30.8             28                26           91           53
NE              Suburban Northeast                                      29.0             27                11           93           66
NW              Suburban Northwest                                      27.7             38                29          137           46
SWE             Southwest East                                          27.2             50                36          184           58
HU              Hutto ISD                                               26.7             46                21          172           70
3E              3E                                                      26.4             14                10           53           95
MA              Manor                                                   26.0             32                16          123           92
RRW             Round Rock West                                         25.6             90                66          352           63
SE              Suburban Southeast                                      25.0             11                12           44           59
3               3                                                       24.0             25                18          104           66
10S             10S                                                     22.7             42                23          185           67
CLS             Cedar Park/Leander South                                21.6             66                47          306           67
N               Suburban North                                          20.7             17                14           82           51
5E              5E                                                      20.4             11                 6           54          103
HH              Hays County/Hays CSD                                    20.3             82                50          404           89
RRE             Round Rock East                                         19.7             79                57          401           72
8W              8W                                                      19.5             23                10          118           88
PF              Pflugerville                                            19.2             82                61          426           75
9               9                                                       19.0              4                    4        21           66
BW              Bastrop County West                                     18.5             17                    7        92          123
OT              Other                                                   18.2              8                    4        44          287
6               6                                                       17.8             18                15          101           84
SC              Suburban South Central                                  17.5             14                10           80           94
11              11                                                      17.2             16                11           93           94
8E              8E                                                      17.0             18                17          106           91
W               Suburban West                                           16.4             18                15          110           77
5               5                                                       16.0             24                20          150          118
1B              1B                                                      16.0             23                20          144           88
10N             10N                                                     15.9             14                17           88           61
2N              2N                                                      15.9             14                12           88           71
RN              River North                                             15.9             36                30          227           97
GTE             Georgetown East                                         15.7             24                17          153          109
4               4                                                       15.7             18                11          115           88
BA              Bastrop County                                          14.8             24                13          162          120
GTW             Georgetown West                                         13.9             62                55          446          109
HD              Hays County/Dripping Springs ISD                        13.6             30                25          221          123
BL              Blanco County                                           12.8              5                    5        39          145
FC              Fayette County                                          11.8              2                    1        17          443
EL              Elgin                                                   11.6             11                12           95           98
LH              Liberty Hill School District                            11.3              9                    8        80          111
LS              S. Travis Lake                                          10.4             59                54          568          131
SV              Smithville School District                              10.1              7                 7           69          173
JA              Jarrell School District                                 10.0              3                    2        30          130

Note: Current month data are preliminary. The hotness ratio is pending sales as a percent of active listings
15-Mar-11                                 Real Estate Center at Texas A&M University and ABoR                                      Page 5-1
Austin Association of Realtors MLS
Residential Sales Closed by Area, Ranked by Hotness for:                 February 2011

                                                                   Hotness         Pending                          Active     Estimated
     Area       Area Name                                          Ratio*           Sales                Sales     Listings   Days-to-Sell

UT              UT Area                                                  9.1              2                    1        22          125
HW              Hays County/Wimberley ISD                                8.0             13                12          162          156
HS              Hays County/San Marcos ISD                               7.7              5                10           65           91
LN              N. Travis Lake                                           7.4             20                15          269          205
LW              Lake West                                                7.4              6                 3           81          217
CC              Caldwell County                                          7.0              9                10          129          157
MC              Milam County                                             6.3              5                    3        79          328
WE              E. Williamson County                                     6.3              1                    4        16           94
BU              Burnet County                                            5.9             12                13          202          213
LL              LL                                                       4.6              6                    2       131          427
CM              Comal County                                             4.4              2                    3        45          147
LC              Lee County                                                                                     2        38          210


Note: Current month data are preliminary. The hotness ratio is pending sales as a percent of active listings
15-Mar-11                              Real Estate Center at Texas A&M University and ABoR                                         Page 5-2
Austin Association of Realtors MLS
Sales Closed by Area for: February 2011
Single Family
                                                       Sales      Sold                                                    Estimated
                           Average         Median      Price     to List    Coop       New        Active    Pending        Days-to-
 Year Mont       Sales      Price           Price     per Sqft    Price     Sales     Listings   Listings    Sales    DOM    Sell
 Area:   10N
  2010   Feb        19    $181,881         $160,000    $119        97%                     51       87         30       35       58
  2011   Feb        17    $160,016         $147,750    $114        96%                     24       88         14       91       61
 Area:   10S
  2010   Feb        32    $185,017         $174,380    $110        99%                     87      156         49       46       46
  2011   Feb        23    $177,704         $180,850     $95        95%                     58      185         42      105       67
 Area:   11
  2010   Feb        10    $116,601         $125,000     $70        97%                     31       82         21       35       70
  2011   Feb        11     $90,249          $71,750     $69        96%                     21       93         16       92       94
 Area:   1A
  2010   Feb        11    $453,684         $430,000    $187        95%                     21       68         15       71       72
  2011   Feb        16    $399,013         $390,000    $153        95%                     26       58         20       70       55
 Area:   1B
  2010   Feb        16    $723,388         $685,350    $259        95%                     53      185         22       78      137
  2011   Feb        20    $622,553         $500,000    $260        94%                     41      144         23      136       88
 Area:   1N
  2010   Feb        20    $291,620         $240,750    $136        98%                     46      137         29       56       63
  2011   Feb        26    $290,282         $260,000    $136        96%                     50      127         40       78       57
 Area:   2
  2010   Feb        10    $267,050         $281,000    $183        97%                     44      125         20       47       70
  2011   Feb        26    $235,658         $225,000    $160        96%                     45       91         28       89       53
 Area:   2N
  2010   Feb        12    $140,358         $130,150     $88        95%                     39       95         20       68       69
  2011   Feb        12    $130,960         $133,440     $87        95%                     21       88         14      108       71
 Area:   3
  2010   Feb        12    $202,208         $198,500    $132        97%                     55      152         22       48       89
  2011   Feb        18    $172,821         $162,500    $109        96%                     30      104         25       73       66
 Area:   3E
  2010   Feb        12    $111,413         $105,000     $74        96%                     18       55         17       60       73
  2011   Feb        10     $94,974         $101,960     $62        95%                     19       53         14       36       95
 Area:   4
  2010   Feb        11    $325,683         $320,000    $204        96%                     59      148         19      100      113
  2011   Feb        11    $317,980         $285,500    $224        97%                     33      115         18       69       88
 Area:   5
  2010   Feb        18    $152,358         $127,200    $126        95%                     58      168         35       95      126
  2011   Feb        20    $166,634         $161,500    $138        97%                     34      150         24       72      118
 Area:   5E
  2010   Feb        11    $117,084         $105,000     $77       100%                     25       58         17       59       90
  2011   Feb         6    $116,924         $114,300     $73       100%                     13       54         11      112      103
 Area:   6
  2010   Feb        13    $397,408         $321,500    $240        94%                     41      126         25       48      132
  2011   Feb        15    $294,814         $247,500    $212        96%                     31      101         18      106       84
 Area:   7
  2010   Feb         5    $341,279         $300,000    $230        94%                     11       29          4      101       68
  2011   Feb         5    $383,400         $395,000    $198        94%                     15       37         14      111       79
 Area:   8E
  2010   Feb        19    $679,171         $702,200    $217        95%                     40      122         20       93      112
  2011   Feb        17    $656,434         $550,000    $193        94%                     25      106         18       90       91


Note: Current month data are preliminary
15-Mar-11                            Real Estate Center at Texas A&M University and ABoR                                     Page 6-1
Austin Association of Realtors MLS
Sales Closed by Area for: February 2011
Single Family
                                                       Sales      Sold                                                    Estimated
                           Average         Median      Price     to List    Coop       New        Active    Pending        Days-to-
 Year Mont       Sales      Price           Price     per Sqft    Price     Sales     Listings   Listings    Sales    DOM    Sell
 Area:   8W
  2010   Feb        13    $717,931         $450,000    $222        83%                     36      136         21       90      107
  2011   Feb        10    $481,133         $510,000    $168        95%                     35      118         23       90       88
 Area:   9
  2010   Feb         6    $132,242         $131,750     $88        92%                      9       27          9       88       86
  2011   Feb         4    $160,100          $79,950    $123        98%                      9       21          4       34       66
 Area:   BA
  2010   Feb        18    $140,386         $136,400     $79        99%                      58     149         31       87      107
  2011   Feb        13    $180,339         $132,380     $73        96%                      40     162         24      129      120
 Area:   BL
  2010   Feb         2    $420,710         $420,710    $314        91%                     10       43          4       80      212
  2011   Feb         5    $187,225         $209,000    $119        94%                      7       39          5      141      145
 Area:   BU
  2010   Feb         8    $148,739         $136,250     $74        98%                     45      214         10       61      268
  2011   Feb        13    $264,842         $246,000    $116        94%                     32      202         12      109      213
 Area:   BW
  2010   Feb         8    $134,838         $110,500     $76        96%                      30     117         12      148      141
  2011   Feb         7    $183,000         $156,000     $82       100%                      23      92         17       55      123
 Area:   CC
  2010   Feb        10    $129,590         $100,000     $69        95%                      32     126         14      115      128
  2011   Feb        10     $90,600          $96,000     $53        92%                      15     129          9      116      157
 Area:   CLN
  2010   Feb        67    $191,164         $147,500     $87        95%                     130     374        112       75       73
  2011   Feb        50    $199,848         $150,000     $84        96%                     111     300        104       86       58
 Area:   CLS
  2010   Feb        51    $243,171         $212,700    $101        95%                     130     337         88       73       63
  2011   Feb        47    $244,217         $217,460     $96        97%                     113     306         66       88       67
 Area:   CM
  2011   Feb         3    $115,333         $116,000     $89        93%                      9       45          2      146      147
 Area:   EL
  2010   Feb        18    $119,467         $102,000     $71        95%                     25      106         21       96       89
  2011   Feb        12    $108,573          $97,000     $62        95%                     33       95         11       84       98
 Area:   FC
  2010   Feb         5    $180,350         $163,850     $87        94%                       4      13          1      221      119
  2011   Feb         1     $85,000          $85,000     $67       106%                              17          2       56      443
 Area:   GP
  2010   Feb         3    $127,512         $134,000     $92        97%                       1      12          1       58      548
 Area:   GTE
  2010   Feb         6    $115,817         $124,500     $76        96%                      31     150         19       51      111
  2011   Feb        17    $146,162         $146,440     $77        96%                      38     153         24       66      109
 Area:   GTW
  2010   Feb        52    $260,199         $218,250    $106        96%                     114     416         59      117       99
  2011   Feb        55    $203,093         $169,380    $104        97%                      92     446         62       90      109
 Area:   GZ
  2010   Feb         1    $250,000         $250,000    $163       100%                       1       9                 202      164
 Area:   HD
  2010   Feb        21    $295,033         $280,000    $110        95%                     62      224         27       61      111
  2011   Feb        25    $333,541         $311,430    $117        96%                     54      221         30      106      123


Note: Current month data are preliminary
15-Mar-11                            Real Estate Center at Texas A&M University and ABoR                                     Page 6-2
Austin Association of Realtors MLS
Sales Closed by Area for: February 2011
Single Family
                                                         Sales      Sold                                                   Estimated
                           Average           Median      Price     to List   Coop       New        Active    Pending        Days-to-
 Year Mont       Sales      Price             Price     per Sqft    Price    Sales     Listings   Listings    Sales    DOM    Sell
 Area:   HH
  2010   Feb        59    $165,818          $143,000      $82       96%                     138     376         87       76       78
  2011   Feb        50    $140,726          $135,900      $74       97%                     106     404         82      106       89
 Area:   HS
  2010   Feb         8    $145,256          $139,000      $88       96%                      14      59         11       53      100
  2011   Feb        10    $244,867          $260,000     $100       96%                      16      65          5       86       91
 Area:   HU
  2010   Feb        31    $146,086          $137,500      $69       97%                      59     182         52       65       73
  2011   Feb        21    $152,573          $150,000      $76      100%                      39     172         46       73       70
 Area:   HW
  2010   Feb        12    $268,783          $241,250     $133       90%                      37     169          9      164      153
  2011   Feb        12    $204,318          $198,500     $104       91%                      32     162         13       99      156
 Area:   JA
  2010   Feb         4     $93,650           $99,800      $63       98%                       4      30          2       38       91
  2011   Feb         2    $152,995          $153,000      $79      100%                       7      30          3      346      130
 Area:   LC
  2010   Feb         2    $182,500          $182,500      $76       89%                       8      30          2       52      161
  2011   Feb         2    $176,625          $176,620      $47       92%                       5      38                 338      210
 Area:   LH
  2010   Feb         5    $283,000          $243,000     $116       97%                      24      83         11       74      122
  2011   Feb         8    $245,981          $258,500      $97       95%                      18      80          9      128      111
 Area:   LL
  2010   Feb         1   $3,950,000        $3,950,000    $731       88%                      17      81          5       10      211
  2011   Feb         2     $125,500          $125,500     $85       96%                      23     131          6       90      427
 Area:   LN
  2010   Feb        13    $215,771          $170,000      $97       95%                      55     257         17      112      241
  2011   Feb        15    $196,664          $174,650     $106       96%                      58     269         20      136      205
 Area:   LS
  2010   Feb        40    $404,065          $333,750     $142       96%                     151     662         53      110      174
  2011   Feb        54    $429,876          $357,000     $146       95%                     118     568         59      143      131
 Area:   LW
  2011   Feb         3    $251,500          $276,500     $140       96%                     13       81          6      232      217
 Area:   MA
  2010   Feb        10    $116,920           $98,750      $58       98%                      50     101         26       63       75
  2011   Feb        16    $125,424           $92,000      $66       98%                      33     123         32      125       92
 Area:   MC
  2010   Feb         2    $107,160          $107,160      $44       88%                      10      62          2       94      298
  2011   Feb         3    $181,667          $185,000      $66       92%                       8      79          5       78      328
 Area:   N
  2010   Feb        19    $188,002          $180,000      $96       98%                      49      82         28       63       46
  2011   Feb        14    $181,627          $175,000      $90       97%                      27      82         17       54       51
 Area:   NE
  2010   Feb        20    $145,383          $146,740      $84       95%                      44     130         28       62       79
  2011   Feb        11    $140,500          $131,000      $74       98%                      28      93         27      115       66
 Area:   NW
  2010   Feb        34    $234,343          $201,000     $106       97%                      69     165         47       65       48
  2011   Feb        29    $252,024          $202,500     $106       97%                      59     137         38       61       46
 Area:   OT
  2011   Feb         4    $337,740          $271,250     $155       89%                       3      44          8      229      287


Note: Current month data are preliminary
15-Mar-11                             Real Estate Center at Texas A&M University and ABoR                                     Page 6-3
Austin Association of Realtors MLS
Sales Closed by Area for: February 2011
Single Family
                                                       Sales      Sold                                                    Estimated
                           Average         Median      Price     to List    Coop       New        Active    Pending        Days-to-
 Year Mont       Sales      Price           Price     per Sqft    Price     Sales     Listings   Listings    Sales    DOM    Sell
 Area:   PF
  2010   Feb        62    $157,853         $151,900     $73        97%                     195     447        116       65       71
  2011   Feb        61    $153,922         $147,000     $71        96%                     121     426         82      103       75
 Area:   RN
  2010   Feb        25    $377,768         $300,000    $126        98%                     50      241         34       87      108
  2011   Feb        30    $610,815         $512,500    $162        94%                     72      227         36      120       97
 Area:   RRE
  2010   Feb        55    $187,979         $177,500     $79        97%                     165     455        106       75       74
  2011   Feb        57    $169,823         $154,630     $75        98%                     108     401         79       90       72
 Area:   RRW
  2010   Feb        62    $237,802         $232,500     $94        97%                     148     357         90       66       59
  2011   Feb        66    $243,780         $234,500     $93        97%                     133     352         90      101       63
 Area:   SC
  2010   Feb        14    $164,691         $140,680     $77        93%                      29      83         17       66       83
  2011   Feb        10    $141,294         $115,000     $73        98%                      17      80         14       79       94
 Area:   SE
  2010   Feb         3    $100,300         $113,500     $47        99%                      27      60         18       56       79
  2011   Feb        12     $95,048          $87,550     $58        98%                      11      44         11       81       59
 Area:   SH
  2010   Feb         1     $44,000          $44,000     $19        96%                       1       4                   6       73
 Area:   SV
  2010   Feb         5     $98,200          $80,000     $67        95%                      14      64          4      125      128
  2011   Feb         7    $126,779         $116,000     $70        97%                      17      69          7      197      173
 Area:   SWE
  2010   Feb        40    $221,739         $201,410    $104        96%                     102     203         60       91       59
  2011   Feb        36    $238,907         $231,240    $101        98%                      52     184         50       87       58
 Area:   SWW
  2010   Feb        39    $287,628         $275,000    $117        98%                     82      151         45       59       47
  2011   Feb        32    $292,825         $277,000    $122        98%                     59      111         41       85       37
 Area:   UT
  2010   Feb         4    $436,000         $427,500    $264        97%                      9       22          1      145      112
  2011   Feb         1    $226,000         $226,000    $149       100%                      6       22          2        2      125
 Area:   W
  2010   Feb        22    $372,768         $324,100    $139        95%                      35     124         29       86       85
  2011   Feb        15    $351,625         $362,500    $131        98%                      40     110         18       83       77
 Area:   WE
  2010   Feb         2    $101,500         $101,500     $73        95%                      14      54          3       36      282
  2011   Feb         4    $146,475         $167,750     $97        99%                       2      16          1      199       94
 Area:   WW
  2010   Feb         1    $190,000         $190,000    $110        99%                       2      25          4      104      228


Note: Current month data are preliminary
15-Mar-11                            Real Estate Center at Texas A&M University and ABoR                                     Page 6-4
Austin Association of Realtors MLS
Sales Closed by Area for: February 2011
Townhouse/Condominium
                                                       Sales      Sold                                                    Estimated
                           Average         Median      Price     to List    Coop       New        Active    Pending        Days-to-
 Year Mont       Sales      Price           Price     per Sqft    Price     Sales     Listings   Listings    Sales    DOM    Sell
 Area:   10N
  2010   Feb         3    $184,233         $182,900    $142        97%                     8        40          6       61      103
  2011   Feb         1    $250,000         $250,000    $132        96%                     4        30          1       42      101
 Area:   10S
  2011   Feb         2    $170,380         $170,380    $119        97%                      5       12          3      132      104
 Area:   1A
  2010   Feb        14    $195,886         $207,000    $142        96%                     27       62         16       89       80
  2011   Feb        10    $169,094         $157,500    $141        95%                     11       71         12       74       97
 Area:   1B
  2010   Feb         6    $178,000         $178,500    $200        95%                     27       88         13       59      217
  2011   Feb         6    $272,833         $169,000    $207        94%                      5       55          3      128       93
 Area:   1N
  2010   Feb         1    $179,500         $179,500    $152        97%                     10       21          2      129      110
  2011   Feb         1    $262,000         $262,000    $145        97%                      2       30          2       31      166
 Area:   2
  2010   Feb         5    $167,290         $143,000    $149        97%                     17       46          9      146       94
  2011   Feb         1     $72,000          $72,000    $120       100%                      5       44          8       35      143
 Area:   2N
  2010   Feb         6     $59,179          $45,590     $78        98%                      7       46          8       39       69
  2011   Feb         8     $75,925          $74,950     $87        99%                      6       39          7       64       73
 Area:   3
  2010   Feb         3     $48,333          $51,500     $49        92%                      7       19          6      146       91
  2011   Feb         1    $291,400         $291,400    $185        97%                      9       16          5       49      101
 Area:   4
  2010   Feb         2    $153,500         $153,500    $190        98%                      6       36          4        3      115
  2011   Feb         1    $253,500         $253,500    $170        96%                     12       40          3       73      178
 Area:   5
  2010   Feb         4    $239,311         $152,250    $229        95%                     7        42          9       52      118
  2011   Feb         3    $197,667         $168,000    $178        97%                     9        28          6       93      100
 Area:   5E
  2011   Feb         1     $45,000          $45,000     $41        90%                                                 192
 Area:   6
  2010   Feb        12    $205,271         $190,500    $176        94%                     29      115         16       96      161
  2011   Feb        11    $229,730         $151,000    $208        98%                     18       46          7       63       56
 Area:   7
  2010   Feb         1    $222,500         $222,500    $252        99%                     10       48          2       68      186
  2011   Feb         2    $315,000         $315,000    $209        96%                     10       38          3      111      131
 Area:   8E
  2010   Feb         2    $265,000         $265,000    $184       100%                     8        28          4       50      150
  2011   Feb         1    $162,000         $162,000    $206        99%                     8        26          6       19      132
 Area:   9
  2010   Feb         9     $65,798          $40,470     $68        94%                     22       54         10       42       83
  2011   Feb         5    $108,500         $124,500    $123        97%                      9       52          4      129      122
 Area:   BU
  2011   Feb         1     $90,990          $90,990     $68       121%                               1                   5       91
 Area:   CLN
  2010   Feb         1    $111,000         $111,000     $81        99%                      1        4          1       47       56
 Area:   CLS
  2010   Feb         5    $149,429         $152,000    $101        96%                     26       40          8       85      138
  2011   Feb         1    $172,102         $172,100    $118        96%                     20       34          2       66      102

Note: Current month data are preliminary
15-Mar-11                            Real Estate Center at Texas A&M University and ABoR                                     Page 6-5
Austin Association of Realtors MLS
Sales Closed by Area for: February 2011
Townhouse/Condominium
                                                       Sales      Sold                                                    Estimated
                           Average         Median      Price     to List    Coop       New        Active    Pending        Days-to-
 Year Mont       Sales      Price           Price     per Sqft    Price     Sales     Listings   Listings    Sales    DOM    Sell
 Area:   DT
  2010   Feb         8    $291,938         $266,000    $291        94%                     41      172         19       55      236
  2011   Feb        15    $460,327         $308,800    $408        97%                     32      115         14      139      116
 Area:   GTE
  2011   Feb         1    $256,250         $256,250    $153        97%                               7          3      873       98
 Area:   HH
  2010   Feb         1    $138,500         $138,500     $89        99%                      3        7          1       61      213
 Area:   HS
  2011   Feb         1     $50,000          $50,000     $69        88%                      2        7          2       19       91
 Area:   HW
  2010   Feb         3    $106,667         $105,000     $81        93%                               7          4       76      116
  2011   Feb         1     $76,800          $76,800     $57        97%                      1        9          1      110      137
 Area:   LL
  2011   Feb         2    $127,182         $127,180    $126        77%                      1       16                 110      195
 Area:   LN
  2010   Feb         3    $151,333         $161,500    $100        95%                      3       62          5       26      213
  2011   Feb         1    $230,000         $230,000    $160       100%                     14       51          1      165      133
 Area:   LS
  2010   Feb         5    $200,300         $160,000    $100        94%                     26       87          8      208      198
  2011   Feb         5    $149,920         $139,000     $96        92%                     13       42         12      241       93
 Area:   N
  2010   Feb         2    $146,000         $146,000    $111        98%                     8        16          4       66       91
  2011   Feb         1    $155,000         $155,000    $111        97%                     1        14          5       66       64
 Area:   NE
  2010   Feb         3    $141,567         $137,800    $110        96%                     3        24                  55      146
  2011   Feb         3    $101,300          $89,000    $106        99%                     7        16          4       82      112
 Area:   NW
  2010   Feb        22     $75,075          $49,750     $73       101%                     16       23         19       22       34
  2011   Feb         3    $198,515         $156,650    $113        97%                     10       52          8      153       98
 Area:   PF
  2010   Feb         2    $105,000         $105,000     $91       100%                      4       23          1       38      105
 Area:   RN
  2011   Feb         3    $157,000         $162,000    $151       100%                     5        19          3       23      105
 Area:   RRE
  2010   Feb         1     $98,700          $98,700     $71        90%                      2       14                  26      365
 Area:   SC
  2010   Feb         1    $214,050         $214,050    $133        98%                     8        20          1       24      281
 Area:   SWW
  2010   Feb         1    $196,000         $196,000    $140        98%                     9        16          1       94       77
  2011   Feb         1    $163,000         $163,000    $165        99%                     3        10          4        5       51
 Area:   UT
  2010   Feb         6    $197,500         $208,750    $207        97%                     46      171          8      127      200
  2011   Feb         8    $171,481         $156,000    $204        95%                     43      142         16      121      199
 Area:   W
  2010   Feb         2    $224,750         $224,750    $124        95%                      6       20          5       24      111
  2011   Feb         1    $355,000         $355,000    $209        97%                     12       27          5        0      159


Note: Current month data are preliminary
15-Mar-11                            Real Estate Center at Texas A&M University and ABoR                                     Page 6-6
Austin Association of Realtors MLS
Sales Closed by Area for: February 2011
Lots
                                                       Sales       Sold                                                    Estimated
                           Average         Median      Price      to List    Coop       New        Active    Pending        Days-to-
 Year Mont       Sales      Price           Price     per Sqft     Price     Sales     Listings   Listings    Sales    DOM    Sell
 Area:   1A
  2010   Feb         1    $180,000         $180,000                 92%                      2       14          1      262      852
  2011   Feb         1    $115,000         $115,000                 68%                      1       19          1        9     1156
 Area:   1B
  2010   Feb         2    $535,000         $535,000                 90%                      1       20          4      148      406
  2011   Feb         1    $367,500         $367,500                 82%                      5       21          1      386      274
 Area:   1N
  2010   Feb         1    $125,000         $125,000                100%                      2        8                 339      365
 Area:   3
  2010   Feb         1     $55,000          $55,000                 92%                      5       17                  28      388
 Area:   3E
  2010   Feb         2     $99,750          $99,750                 75%                               8                  14      183
 Area:   5
  2010   Feb         4     $76,000          $82,500                 99%                     14       98          3       44     1052
  2011   Feb         1     $95,000          $95,000                100%                     15       81          4      732      569
 Area:   6
  2010   Feb         1    $160,000         $160,000                 97%                      3       26          2        2      527
  2011   Feb         2    $259,000         $259,000                 79%                              27                  62      448
 Area:   7
  2010   Feb         1    $235,000         $235,000                 94%                               3                  54      183
 Area:   8E
  2010   Feb         1    $410,000         $410,000                 94%                     6        32          3      286      307
  2011   Feb         2    $293,500         $293,500                 94%                     5        42          3      449      295
 Area:   8W
  2010   Feb         1    $330,000         $330,000                100%                     8        72          3      663      730
  2011   Feb         2     $86,300          $86,300                 89%                     6        76          7      380      660
 Area:   9
  2011   Feb         1       $7,000          $7,000                 90%                              14                 802      319
 Area:   BA
  2010   Feb         5     $13,300           $2,250                 80%                      9      121          3      127      298
  2011   Feb         3     $16,167           $5,500                 89%                     12      134          5      289      365
 Area:   BL
  2011   Feb         1     $16,000          $16,000                 53%                      4       57          4      121      867
 Area:   BU
  2010   Feb         1      $1,995           $2,000                100%                     53      272          3      259     1601
  2011   Feb         2    $113,750         $113,750                 85%                     10      246          2       44     1548
 Area:   BW
  2010   Feb         3     $55,000          $53,000                 91%                      6       79          1       41      370
  2011   Feb         2     $69,500          $69,500                 98%                     14       97          4      344      571
 Area:   CC
  2010   Feb         1     $28,000          $28,000                 70%                      3       48                 133      626
 Area:   CLN
  2010   Feb         2     $91,250          $91,250                 89%                      6      158          3      213      848
  2011   Feb         4    $105,238          $75,980                 92%                     12       71          8      339      480
 Area:   CLS
  2010   Feb         2     $62,000          $62,000                 80%                              64          2      280      730
  2011   Feb         1     $60,000          $60,000                 80%                              15                 598      342
 Area:   CM
  2010   Feb         1      $5,000           $5,000                 67%                      5       52                  23      949
  2011   Feb         2     $64,500          $64,500                 90%                     71      177          6       64     2019

Note: Current month data are preliminary
15-Mar-11                             Real Estate Center at Texas A&M University and ABoR                                     Page 6-7
Austin Association of Realtors MLS
Sales Closed by Area for: February 2011
Lots
                                                         Sales      Sold                                                   Estimated
                           Average           Median      Price     to List   Coop       New        Active    Pending        Days-to-
 Year Mont       Sales      Price             Price     per Sqft    Price    Sales     Listings   Listings    Sales    DOM    Sell
 Area:   EL
  2010   Feb         3     $24,333           $22,500                88%                       8      55          2      189      456
 Area:   GTE
  2010   Feb         1     $65,800           $65,800                92%                       3      33                  55      402
 Area:   GTW
  2010   Feb         7     $77,929           $90,000                84%                     21      189          4      184      932
  2011   Feb         1    $270,000          $270,000                90%                     21      176          5      286      683
 Area:   HD
  2010   Feb         6    $110,883          $114,250                92%                     12      140          7      188      691
  2011   Feb         6     $67,000           $66,000                90%                     11      137          5      148      521
 Area:   HH
  2011   Feb         4     $39,875           $40,750                87%                      9       85          3      406      597
 Area:   HS
  2010   Feb         1     $59,000           $59,000                95%                      3       18                  62      274
  2011   Feb         1     $89,000           $89,000                74%                      4       24          1      206      487
 Area:   HU
  2010   Feb         1     $49,900           $49,900               100%                              26          1       19      593
 Area:   HW
  2010   Feb         6     $81,833           $61,500                84%                     16      138          7       83      442
  2011   Feb         3     $39,833           $44,000                86%                     15      116          2      108      326
 Area:   KL
  2011   Feb         2     $61,500           $61,500                92%                               1                 215       61
 Area:   LH
  2010   Feb         2     $56,250           $56,250               101%                      5       79          2      206      515
  2011   Feb         3     $27,633           $23,900                70%                      7       73                 307      459
 Area:   LL
  2010   Feb         1       $8,700           $8,700                58%                       3      87          1      179     1443
 Area:   LN
  2010   Feb        12    $185,719           $14,750                89%                      90   1,109          8      205     1632
  2011   Feb         7     $35,405           $14,140                80%                      84   1,148          9      327     1445
 Area:   LS
  2010   Feb        15    $102,533           $24,500                90%                      62     737         14      263      868
  2011   Feb        14     $65,769           $41,000                91%                     100     686         15       97      599
 Area:   LW
  2010   Feb         2     $77,500           $77,500                86%                     15      162                 487     1183
  2011   Feb         6     $88,067           $59,000                86%                     16      167          3      225      802
 Area:   RN
  2010   Feb         1     $750,000          $750,000               75%                       3      97          2      202      656
  2011   Feb         1   $1,300,000        $1,300,000               87%                      28     103          1      404      817
 Area:   RRE
  2010   Feb         1     $30,000           $30,000                84%                       1      46          1      348     1199
  2011   Feb         2     $31,875           $31,880                88%                       1      34          5       84      621
 Area:   RRW
  2011   Feb         1    $120,000          $120,000                95%                      2        4          1        0      104
 Area:   SV
  2010   Feb         2     $50,500           $50,500                92%                      6       31          3       56      218
  2011   Feb         1     $16,750           $16,750                81%                              31                  81      246
 Area:   SWE
  2011   Feb         1     $90,000           $90,000                95%                              23          1      681      466


Note: Current month data are preliminary
15-Mar-11                             Real Estate Center at Texas A&M University and ABoR                                     Page 6-8
Austin Association of Realtors MLS
Sales Closed by Area for: February 2011
Lots
                                                       Sales      Sold                                                    Estimated
                           Average         Median      Price     to List    Coop       New        Active    Pending        Days-to-
 Year Mont       Sales      Price           Price     per Sqft    Price     Sales     Listings   Listings    Sales    DOM    Sell
 Area:   SWW
  2010   Feb         1     $36,100          $36,100               103%                     15       56                  47      681
 Area:   W
  2010   Feb         1    $472,390         $472,390                95%                      6       88                 264     2294
  2011   Feb         2    $675,000         $675,000                77%                     20       93         14      338     1543
 Area:   WW
  2010   Feb         1    $102,000         $102,000                89%                     3        13          1       28      475


Note: Current month data are preliminary
15-Mar-11                            Real Estate Center at Texas A&M University and ABoR                                     Page 6-9
February 2011 Austin Real Estate Stats

Mais conteúdo relacionado

Mais procurados

Federal Budget Outlays
Federal Budget OutlaysFederal Budget Outlays
Federal Budget Outlaysbrucekaufman
 
Global Taxation Arbitrage
Global Taxation ArbitrageGlobal Taxation Arbitrage
Global Taxation ArbitrageMark Nottingham
 
2019 Economic & Market Forecast
2019 Economic & Market Forecast2019 Economic & Market Forecast
2019 Economic & Market ForecastRonny Budiutama
 
Website jan-apr 2012 florida keys real estate market
Website   jan-apr 2012 florida keys real estate marketWebsite   jan-apr 2012 florida keys real estate market
Website jan-apr 2012 florida keys real estate marketJamie Engel
 
Force Mileage
Force MileageForce Mileage
Force Mileagebeamdaddy
 
2010 State Of The Company Recruiting
2010 State Of The Company   Recruiting2010 State Of The Company   Recruiting
2010 State Of The Company RecruitingMatthew Haviland
 

Mais procurados (17)

Coldwell Banker C&C Properties Sales Dec 2010
Coldwell Banker C&C Properties Sales Dec 2010Coldwell Banker C&C Properties Sales Dec 2010
Coldwell Banker C&C Properties Sales Dec 2010
 
Houston Market Report July 2010
Houston Market Report July 2010Houston Market Report July 2010
Houston Market Report July 2010
 
Aoc63
Aoc63Aoc63
Aoc63
 
Houston Market Report January 2010
Houston Market Report January 2010Houston Market Report January 2010
Houston Market Report January 2010
 
Houston Market Report March 2010
Houston Market Report March 2010Houston Market Report March 2010
Houston Market Report March 2010
 
Houston Market Report August 2010
Houston Market Report August 2010Houston Market Report August 2010
Houston Market Report August 2010
 
Federal Budget Outlays
Federal Budget OutlaysFederal Budget Outlays
Federal Budget Outlays
 
Q2 2009 Earning Report of Knoll Inc.
Q2 2009 Earning Report of Knoll Inc.Q2 2009 Earning Report of Knoll Inc.
Q2 2009 Earning Report of Knoll Inc.
 
May2010 residentialfocus
May2010 residentialfocusMay2010 residentialfocus
May2010 residentialfocus
 
Global Taxation Arbitrage
Global Taxation ArbitrageGlobal Taxation Arbitrage
Global Taxation Arbitrage
 
2019 Economic & Market Forecast
2019 Economic & Market Forecast2019 Economic & Market Forecast
2019 Economic & Market Forecast
 
Website jan-apr 2012 florida keys real estate market
Website   jan-apr 2012 florida keys real estate marketWebsite   jan-apr 2012 florida keys real estate market
Website jan-apr 2012 florida keys real estate market
 
Leslie Appleton-Young Year-end presentation
Leslie Appleton-Young Year-end presentationLeslie Appleton-Young Year-end presentation
Leslie Appleton-Young Year-end presentation
 
3025 finch
3025 finch3025 finch
3025 finch
 
Force Mileage
Force MileageForce Mileage
Force Mileage
 
2010 State Of The Company Recruiting
2010 State Of The Company   Recruiting2010 State Of The Company   Recruiting
2010 State Of The Company Recruiting
 
Demographics & Housing - Lake Elsinore CA 8-20-15
Demographics & Housing - Lake Elsinore CA 8-20-15Demographics & Housing - Lake Elsinore CA 8-20-15
Demographics & Housing - Lake Elsinore CA 8-20-15
 

Semelhante a February 2011 Austin Real Estate Stats

Houston marketreport sep12_sf
Houston marketreport sep12_sfHouston marketreport sep12_sf
Houston marketreport sep12_sfToni Moss
 
Toronto EAST Real Estate statistics september 2011
Toronto EAST Real Estate statistics september 2011Toronto EAST Real Estate statistics september 2011
Toronto EAST Real Estate statistics september 2011John Helfrich
 
Fraser Valley Real Estate Statistics - Dec 2011
Fraser Valley Real Estate Statistics - Dec 2011Fraser Valley Real Estate Statistics - Dec 2011
Fraser Valley Real Estate Statistics - Dec 2011Andrew Hudson
 
Fraser Valley Real Estate Statistics - Dec 2011
Fraser Valley Real Estate Statistics - Dec 2011Fraser Valley Real Estate Statistics - Dec 2011
Fraser Valley Real Estate Statistics - Dec 2011Andrew Hudson
 
Fraser Valley Real Estate Statistics Dec 2011
Fraser Valley Real Estate Statistics Dec 2011Fraser Valley Real Estate Statistics Dec 2011
Fraser Valley Real Estate Statistics Dec 2011Andrew Hudson
 
2012.07.york simcoe market watch
2012.07.york simcoe market watch2012.07.york simcoe market watch
2012.07.york simcoe market watchSteven Silva
 
Fairfax Housing Report 2008
Fairfax Housing Report 2008Fairfax Housing Report 2008
Fairfax Housing Report 2008Betty Plashal
 
2009 Economic Forecast by Hexter Fair
2009 Economic Forecast by Hexter Fair2009 Economic Forecast by Hexter Fair
2009 Economic Forecast by Hexter FairSuzy Britz
 
Hexter Fair Economic Forecast 012809
Hexter Fair Economic Forecast 012809Hexter Fair Economic Forecast 012809
Hexter Fair Economic Forecast 012809Suzy Britz
 
Florida Keys Market Stats - January to April 2012
Florida Keys Market Stats - January to April 2012Florida Keys Market Stats - January to April 2012
Florida Keys Market Stats - January to April 2012Jamie Engel
 
Vancouver real estate february 2012 stats package rebgv
Vancouver real estate february 2012 stats package rebgvVancouver real estate february 2012 stats package rebgv
Vancouver real estate february 2012 stats package rebgvMatt Collinge
 
April 2021 - TRREB Market Report
April 2021 - TRREB Market Report April 2021 - TRREB Market Report
April 2021 - TRREB Market Report Michelle Makos
 

Semelhante a February 2011 Austin Real Estate Stats (20)

Houston marketreport sep12_sf
Houston marketreport sep12_sfHouston marketreport sep12_sf
Houston marketreport sep12_sf
 
Toronto EAST Real Estate statistics september 2011
Toronto EAST Real Estate statistics september 2011Toronto EAST Real Estate statistics september 2011
Toronto EAST Real Estate statistics september 2011
 
Dalkeith
DalkeithDalkeith
Dalkeith
 
Fraser Valley Real Estate Statistics - Dec 2011
Fraser Valley Real Estate Statistics - Dec 2011Fraser Valley Real Estate Statistics - Dec 2011
Fraser Valley Real Estate Statistics - Dec 2011
 
Fraser Valley Real Estate Statistics - Dec 2011
Fraser Valley Real Estate Statistics - Dec 2011Fraser Valley Real Estate Statistics - Dec 2011
Fraser Valley Real Estate Statistics - Dec 2011
 
Fraser Valley Real Estate Statistics Dec 2011
Fraser Valley Real Estate Statistics Dec 2011Fraser Valley Real Estate Statistics Dec 2011
Fraser Valley Real Estate Statistics Dec 2011
 
Stats oct 11
Stats oct 11Stats oct 11
Stats oct 11
 
Toronto Market Watch East
Toronto Market Watch EastToronto Market Watch East
Toronto Market Watch East
 
Toronto Central Market Watch
Toronto Central Market WatchToronto Central Market Watch
Toronto Central Market Watch
 
2012.07.york simcoe market watch
2012.07.york simcoe market watch2012.07.york simcoe market watch
2012.07.york simcoe market watch
 
Total Market Overview
Total Market OverviewTotal Market Overview
Total Market Overview
 
Fairfax Housing Report 2008
Fairfax Housing Report 2008Fairfax Housing Report 2008
Fairfax Housing Report 2008
 
2009 Economic Forecast by Hexter Fair
2009 Economic Forecast by Hexter Fair2009 Economic Forecast by Hexter Fair
2009 Economic Forecast by Hexter Fair
 
Hexter Fair Economic Forecast 012809
Hexter Fair Economic Forecast 012809Hexter Fair Economic Forecast 012809
Hexter Fair Economic Forecast 012809
 
Florida Keys Market Stats - January to April 2012
Florida Keys Market Stats - January to April 2012Florida Keys Market Stats - January to April 2012
Florida Keys Market Stats - January to April 2012
 
Houston Market Report February 2010
Houston Market Report February 2010Houston Market Report February 2010
Houston Market Report February 2010
 
Vancouver real estate february 2012 stats package rebgv
Vancouver real estate february 2012 stats package rebgvVancouver real estate february 2012 stats package rebgv
Vancouver real estate february 2012 stats package rebgv
 
April 2021 - TRREB Market Report
April 2021 - TRREB Market Report April 2021 - TRREB Market Report
April 2021 - TRREB Market Report
 
Houston Market Report May 2010
Houston Market Report May 2010Houston Market Report May 2010
Houston Market Report May 2010
 
Rebgv june 2012 stats
Rebgv june 2012 statsRebgv june 2012 stats
Rebgv june 2012 stats
 

February 2011 Austin Real Estate Stats

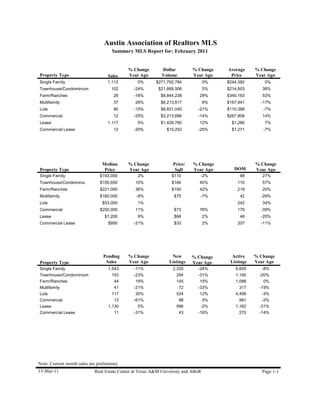
  • 1. Austin Association of Realtors MLS Summary MLS Report for: February 2011 % Change Dollar % Change Average % Change Property Type Sales Year Ago Volume Year Ago Price Year Ago Single Family 1,112 0% $271,752,784 0% $244,382 0% Townhouse/Condominium 102 -24% $21,889,506 5% $214,603 38% Farm/Ranches 26 -16% $8,844,238 29% $340,163 53% Multifamily 37 28% $6,213,817 6% $167,941 -17% Lots 80 -15% $8,831,040 -21% $110,388 -7% Commercial 12 -25% $3,213,696 -14% $267,808 14% Lease 1,117 5% $1,429,760 12% $1,280 7% Commercial Lease 12 -20% $15,252 -25% $1,271 -7% Median % Change Price/ % Change % Change Property Type Price Year Ago Sqft Year Ago DOM Year Ago Single Family $193,000 2% $110 -2% 98 27% Townhouse/Condominiu $156,650 10% $184 40% 110 57% Farm/Ranches $221,000 36% $150 42% 218 20% Multifamily $160,000 -9% $75 -7% 42 -26% Lots $53,000 1% 242 34% Commercial $200,000 11% $73 76% 179 -39% Lease $1,200 9% $68 2% 48 -20% Commercial Lease $950 -21% $33 2% 207 -11% Pending % Change New % Change Active % Change Property Type Sales Year Ago Listings Year Ago Listings Year Ago Single Family 1,543 -11% 2,335 -24% 8,605 -8% Townhouse/Condominium 153 -23% 294 -31% 1,190 -20% Farm/Ranches 44 19% 145 15% 1,088 0% Multifamily 41 -21% 72 -33% 317 -19% Lots 117 30% 524 12% 4,499 -3% Commercial 13 -61% 98 0% 991 -2% Lease 1,130 5% 996 -2% 1,162 -31% Commercial Lease 11 -31% 43 -16% 270 -14% Note: Current month sales are preliminary 15-Mar-11 Real Estate Center at Texas A&M University and ABoR Page 1-1
  • 2. Austin Association of Realtors MLS Year-to-Date Summary MLS Report for: February 2011 % Change Dollar % Change Average % Change Property Type Sales Year Ago Volume Year Ago Price Year Ago Single Family 2,058 4% $508,916,876 5% $247,287 1% Townhouse/Condominium 195 -25% $37,866,627 -5% $194,188 27% Farm/Ranches 52 2% $17,583,228 32% $338,139 30% Multifamily 74 35% $12,520,282 24% $169,193 -8% Lots 154 -9% $15,602,188 -21% $101,313 -14% Commercial 26 8% $6,156,384 -7% $236,784 -14% Lease 2,279 4% $2,906,662 11% $1,275 7% Commercial Lease 27 4% $41,562 19% $1,539 14% Median % Change Price/ % Change % Change Property Type Price Year Ago Sqft Year Ago DOM Year Ago Single Family $191,120 3% $111 0% 96 20% Townhouse/Condominiu $155,000 11% $161 24% 104 24% Farm/Ranches $211,750 18% $147 23% 268 71% Multifamily $162,930 -5% $72 -5% 56 -12% Lots $56,000 -3% 229 22% Commercial $195,000 -24% $71 107% 177 -38% Lease $1,150 5% $66 3% 50 -19% Commercial Lease $1,150 -8% $54 67% 174 -6% Pending % Change New % Change Active % Change Property Type Sales Year Ago Listings Year Ago Listings Year Ago Single Family 2,953 -6% 4,738 -19% 8,375 -6% Townhouse/Condominium 278 -31% 626 -33% 1,167 -18% Farm/Ranches 80 10% 283 -3% 1,061 -3% Multifamily 85 -7% 171 -26% 326 -17% Lots 226 18% 974 -3% 4,452 -2% Commercial 32 -29% 208 -11% 967 -4% Lease 2,385 3% 2,220 1% 1,240 -30% Commercial Lease 25 -24% 80 -22% 269 -12% Note: Current month sales are preliminary 15-Mar-11 Real Estate Center at Texas A&M University and ABoR Page 2-1
  • 3. Austin Association of Realtors MLS Sales Closed by Month: February 2011 Single Family Average Median Price per New Active Pending Sold to Year Month Sales Price Price Sqft Listings Listings Sales DOM List Price 2009 Jan 840 $231,006 $176,750 $107 2,693 8,738 1,327 86 94.3% 2009 Feb 1,106 $241,262 $189,900 $110 2,647 9,373 1,406 89 94.7% 2009 Mar 1,404 $230,931 $180,000 $107 3,238 9,704 1,846 87 95.1% 2009 Apr 1,561 $233,868 $190,000 $109 3,221 9,889 1,919 79 95.6% 2009 May 1,675 $253,691 $195,000 $115 3,065 9,939 2,132 79 95.7% 2009 Jun 2,072 $251,920 $199,920 $114 3,232 10,107 2,084 81 95.9% 2009 Jul 2,034 $246,026 $193,250 $113 3,247 9,988 1,996 75 96.3% 2009 Aug 1,757 $244,666 $190,000 $112 2,918 9,555 1,980 76 96.2% 2009 Sep 1,738 $242,432 $188,190 $113 2,692 9,148 1,886 71 95.7% 2009 Oct 1,778 $237,778 $180,000 $113 2,670 8,948 1,811 73 95.8% 2009 Nov 1,557 $238,891 $178,000 $113 2,193 8,551 1,232 77 95.8% 2009 Dec 1,355 $259,225 $192,000 $114 1,731 8,079 1,073 87 95.6% 2010 Jan 858 $246,716 $179,590 $112 2,805 8,569 1,417 84 95.3% 2010 Feb 1,115 $244,220 $190,000 $112 3,067 9,335 1,738 77 95.3% 2010 Mar 1,771 $236,569 $181,000 $111 4,170 10,300 2,421 73 96.3% 2010 Apr 2,019 $235,590 $190,000 $111 4,415 10,749 2,813 69 96.6% 2010 May 2,059 $242,745 $190,640 $113 3,072 11,230 1,405 64 96.8% 2010 Jun 1,962 $275,623 $205,700 $122 3,287 11,749 1,610 70 95.9% 2010 Jul 1,499 $284,125 $220,000 $122 3,238 11,774 1,556 73 95.6% 2010 Aug 1,489 $265,605 $199,900 $117 2,621 11,106 1,502 77 95.8% 2010 Sep 1,280 $248,211 $192,000 $112 2,406 10,453 1,371 81 95.4% 2010 Oct 1,218 $260,472 $196,020 $115 2,235 9,703 1,402 93 94.9% 2010 Nov 1,223 $248,964 $183,240 $114 1,819 8,741 1,260 91 95.1% 2010 Dec 1,419 $247,926 $190,000 $111 1,577 8,182 1,102 98 95.5% 2011 Jan 946 $250,702 $190,000 $113 2,403 8,144 1,410 93 95.3% 2011 Feb 1,112 $244,382 $193,000 $110 2,335 8,605 1,543 98 96.0% Note: Current month data are preliminary 15-Mar-11 Real Estate Center at Texas A&M University and ABoR Page 3-1
  • 4. Austin Association of Realtors MLS Sales Closed by Month: February 2011 Townhouse/Condominium Average Median Price per New Active Pending Sold to Year Month Sales Price Price Sqft Listings Listings Sales DOM List Price 2009 Jan 74 $154,965 $140,000 $137 446 1,635 129 88 95.3% 2009 Feb 86 $170,713 $138,850 $149 415 1,556 122 87 95.2% 2009 Mar 94 $177,769 $151,650 $154 421 1,576 158 91 96.1% 2009 Apr 131 $173,887 $159,900 $140 403 1,573 199 89 95.7% 2009 May 177 $192,359 $159,000 $157 400 1,596 231 88 95.9% 2009 Jun 182 $178,344 $153,890 $153 415 1,574 214 76 94.1% 2009 Jul 229 $178,944 $158,400 $156 441 1,461 236 89 96.0% 2009 Aug 202 $170,306 $156,000 $150 357 1,385 209 82 95.9% 2009 Sep 196 $181,315 $151,500 $158 324 1,338 191 81 96.1% 2009 Oct 175 $183,070 $155,000 $155 345 1,352 192 97 96.2% 2009 Nov 172 $169,830 $150,500 $147 289 1,285 137 94 96.7% 2009 Dec 152 $165,983 $135,500 $141 238 1,287 143 63 96.0% 2010 Jan 127 $150,526 $139,000 $129 511 1,362 205 99 96.9% 2010 Feb 134 $155,079 $142,750 $132 425 1,490 198 70 95.9% 2010 Mar 216 $195,686 $157,750 $158 488 1,546 256 77 96.2% 2010 Apr 211 $177,567 $158,800 $147 491 1,521 338 75 96.2% 2010 May 227 $191,393 $157,850 $158 352 1,556 167 83 96.5% 2010 Jun 228 $190,694 $158,050 $156 455 1,604 165 79 96.4% 2010 Jul 141 $199,153 $159,900 $164 388 1,562 189 90 97.1% 2010 Aug 186 $199,855 $162,840 $160 303 1,469 150 82 96.3% 2010 Sep 126 $193,721 $162,700 $150 246 1,381 134 93 96.7% 2010 Oct 117 $205,962 $160,000 $151 260 1,300 123 99 96.0% 2010 Nov 102 $197,616 $156,440 $154 224 1,165 124 102 96.2% 2010 Dec 131 $226,974 $178,830 $171 181 1,102 122 91 95.8% 2011 Jan 93 $171,797 $153,000 $138 332 1,143 125 98 97.3% 2011 Feb 102 $214,603 $156,650 $184 294 1,190 153 110 96.2% Note: Current month data are preliminary 15-Mar-11 Real Estate Center at Texas A&M University and ABoR Page 3-2
  • 5. Austin Association of Realtors MLS Sales Closed by Month: February 2011 Farm/Ranches Average Median Price per New Active Pending Sold to Year Month Sales Price Price Sqft Listings Listings Sales DOM List Price 2009 Jan 26 $477,614 $184,500 $296 150 996 41 132 92.0% 2009 Feb 24 $417,217 $180,000 $201 128 1,015 20 162 80.4% 2009 Mar 23 $251,450 $166,100 $139 142 1,037 29 175 92.7% 2009 Apr 17 $183,939 $131,000 $91 141 1,069 37 96 90.7% 2009 May 39 $345,797 $210,000 $182 147 1,109 45 183 90.2% 2009 Jun 35 $390,032 $247,000 $115 154 1,151 39 141 81.9% 2009 Jul 32 $250,037 $173,200 $130 156 1,181 43 156 88.0% 2009 Aug 33 $260,247 $200,000 $131 155 1,190 38 155 92.6% 2009 Sep 30 $319,660 $242,000 $141 119 1,177 26 172 87.0% 2009 Oct 19 $205,519 $130,620 $93 139 1,173 29 168 81.7% 2009 Nov 24 $544,374 $188,000 $199 98 1,133 24 127 82.8% 2009 Dec 33 $292,980 $225,000 $136 96 1,080 31 204 83.4% 2010 Jan 20 $320,846 $188,010 $138 167 1,100 36 118 85.1% 2010 Feb 31 $221,613 $163,000 $106 126 1,088 37 182 86.9% 2010 Mar 35 $322,814 $190,000 $132 162 1,113 41 182 85.6% 2010 Apr 38 $299,739 $227,000 $140 150 1,154 61 158 84.1% 2010 May 41 $361,677 $265,000 $144 183 1,192 44 171 92.3% 2010 Jun 46 $352,470 $245,500 $138 140 1,182 38 219 89.6% 2010 Jul 36 $578,212 $200,000 $306 133 1,191 32 151 75.5% 2010 Aug 37 $280,966 $190,000 $150 130 1,176 41 162 85.9% 2010 Sep 26 $453,627 $265,000 $201 127 1,155 31 187 93.0% 2010 Oct 29 $232,590 $97,000 $88 118 1,147 46 152 93.6% 2010 Nov 29 $442,914 $272,500 $192 112 1,103 24 199 88.2% 2010 Dec 42 $445,316 $180,000 $308 76 1,027 27 244 84.9% 2011 Jan 26 $336,115 $196,570 $144 138 1,033 36 318 87.7% 2011 Feb 26 $340,163 $221,000 $150 145 1,088 44 218 88.1% Note: Current month data are preliminary 15-Mar-11 Real Estate Center at Texas A&M University and ABoR Page 3-3
  • 6. Austin Association of Realtors MLS Sales Closed by Month: February 2011 Multifamily Average Median Price per New Active Pending Sold to Year Month Sales Price Price Sqft Listings Listings Sales DOM List Price 2009 Jan 22 $232,677 $186,750 $91 99 376 28 42 96.3% 2009 Feb 25 $185,884 $180,000 $79 87 405 28 123 94.6% 2009 Mar 33 $165,092 $162,000 $69 125 425 50 81 97.9% 2009 Apr 41 $204,150 $170,000 $78 113 406 55 56 96.3% 2009 May 41 $197,421 $178,800 $80 103 410 46 58 96.7% 2009 Jun 43 $197,440 $169,900 $71 97 415 50 87 96.5% 2009 Jul 48 $172,360 $152,500 $78 97 425 25 71 95.8% 2009 Aug 26 $185,092 $165,500 $84 108 442 45 126 96.0% 2009 Sep 31 $211,414 $192,900 $92 105 433 44 67 96.5% 2009 Oct 37 $191,270 $168,400 $79 112 417 60 80 95.0% 2009 Nov 51 $199,534 $175,000 $88 77 385 31 64 95.4% 2009 Dec 38 $195,434 $175,500 $79 73 348 37 71 96.2% 2010 Jan 26 $163,008 $156,000 $70 124 391 39 71 96.2% 2010 Feb 29 $202,497 $175,000 $81 107 393 52 57 94.8% 2010 Mar 44 $163,070 $162,500 $72 119 427 58 82 95.5% 2010 Apr 50 $184,204 $164,350 $82 140 433 71 47 96.7% 2010 May 38 $184,166 $166,250 $78 101 457 44 78 96.6% 2010 Jun 48 $181,317 $159,000 $74 85 462 35 80 96.5% 2010 Jul 29 $211,619 $170,000 $80 108 471 44 73 94.3% 2010 Aug 40 $163,721 $164,950 $71 91 429 50 68 95.9% 2010 Sep 49 $172,486 $152,000 $73 111 416 49 84 96.0% 2010 Oct 42 $201,340 $187,250 $83 100 411 48 73 94.0% 2010 Nov 37 $184,991 $179,000 $81 65 376 46 59 96.0% 2010 Dec 48 $143,061 $135,750 $57 68 326 50 71 94.3% 2011 Jan 37 $170,445 $166,340 $70 99 334 44 70 95.6% 2011 Feb 37 $167,941 $160,000 $75 72 317 41 42 96.9% Note: Current month data are preliminary 15-Mar-11 Real Estate Center at Texas A&M University and ABoR Page 3-4
  • 7. Austin Association of Realtors MLS Sales Closed by Month: February 2011 Lots Average Median Price per New Active Pending Sold to Year Month Sales Price Price Sqft Listings Listings Sales DOM List Price 2009 Jan 54 $72,733 $45,000 517 4,013 79 143 89.7% 2009 Feb 75 $87,852 $44,500 486 4,199 86 135 82.8% 2009 Mar 77 $96,272 $45,000 535 4,238 91 183 86.6% 2009 Apr 82 $102,665 $49,000 416 4,370 91 150 89.2% 2009 May 74 $126,565 $59,500 540 4,461 97 141 89.3% 2009 Jun 81 $86,410 $60,500 440 4,583 116 167 88.5% 2009 Jul 110 $127,855 $60,000 652 4,708 113 139 88.9% 2009 Aug 107 $98,857 $35,000 438 4,755 107 129 89.5% 2009 Sep 100 $85,253 $44,000 379 4,725 102 146 90.3% 2009 Oct 88 $117,585 $50,000 384 4,724 105 170 91.7% 2009 Nov 78 $79,320 $50,380 343 4,657 72 180 90.8% 2009 Dec 85 $127,976 $52,000 243 4,352 97 174 87.7% 2010 Jan 75 $116,336 $60,000 533 4,470 101 198 88.5% 2010 Feb 94 $118,354 $52,500 469 4,618 90 180 88.9% 2010 Mar 85 $78,891 $54,300 559 4,738 121 189 91.6% 2010 Apr 109 $116,439 $60,000 445 4,776 120 190 88.8% 2010 May 94 $115,411 $54,000 554 4,803 99 175 88.1% 2010 Jun 109 $131,402 $65,000 506 4,805 126 187 89.1% 2010 Jul 99 $102,619 $52,000 456 4,868 100 182 91.5% 2010 Aug 105 $112,928 $37,250 467 4,818 117 219 85.3% 2010 Sep 91 $72,639 $54,000 392 4,798 96 170 87.7% 2010 Oct 120 $79,061 $50,000 295 4,667 99 227 85.2% 2010 Nov 84 $128,730 $65,000 294 4,497 102 160 89.8% 2010 Dec 93 $129,427 $60,000 239 4,255 86 192 85.6% 2011 Jan 74 $91,502 $60,000 450 4,405 109 215 89.3% 2011 Feb 80 $110,388 $53,000 524 4,499 117 242 85.2% Note: Current month data are preliminary 15-Mar-11 Real Estate Center at Texas A&M University and ABoR Page 3-5
  • 8. Austin Association of Realtors MLS Sales Closed by Month: February 2011 Commercial Average Median Price per New Active Pending Sold to Year Month Sales Price Price Sqft Listings Listings Sales DOM List Price 2009 Jan 13 $228,632 $177,000 $9,614 125 1,001 25 123 82.1% 2009 Feb 12 $321,000 $286,000 $8,084 115 1,068 14 165 85.8% 2009 Mar 18 $330,617 $284,300 $7,019 115 1,064 20 122 85.8% 2009 Apr 14 $363,291 $355,000 $6,353 105 1,085 18 165 82.7% 2009 May 13 $405,923 $300,000 $5,015 106 1,062 18 100 80.0% 2009 Jun 8 $374,488 $290,500 $8,159 103 1,062 27 187 89.2% 2009 Jul 24 $392,790 $199,500 $6,953 101 1,047 27 144 88.2% 2009 Aug 19 $335,778 $215,000 $7,978 110 1,052 20 198 85.0% 2009 Sep 13 $286,538 $200,000 $11,119 121 1,071 15 125 80.7% 2009 Oct 14 $365,779 $392,500 $9,256 87 1,048 23 186 85.0% 2009 Nov 14 $352,307 $155,000 $12,732 92 1,038 19 200 87.4% 2009 Dec 23 $382,956 $283,750 $6,218 82 968 19 152 79.9% 2010 Jan 8 $354,336 $305,340 $2,759 136 1,012 12 280 89.7% 2010 Feb 16 $234,798 $180,490 $4,151 98 1,008 33 292 74.0% 2010 Mar 20 $242,188 $132,000 $4,769 105 1,019 20 194 92.5% 2010 Apr 25 $436,461 $220,000 $14,549 100 990 31 139 84.9% 2010 May 10 $452,000 $272,500 $8,235 92 991 17 142 91.7% 2010 Jun 13 $369,781 $205,000 $5,210 90 992 18 195 83.0% 2010 Jul 22 $770,727 $277,500 $19,283 119 1,004 20 246 72.5% 2010 Aug 12 $283,412 $205,750 $3,127 115 1,007 18 216 84.8% 2010 Sep 17 $356,853 $325,000 $8,670 97 1,002 23 199 86.4% 2010 Oct 19 $222,188 $178,000 $7,557 85 997 19 153 77.6% 2010 Nov 13 $562,569 $363,000 $11,153 79 1,018 13 157 88.4% 2010 Dec 23 $397,012 $250,000 $10,203 63 944 16 287 89.3% 2011 Jan 14 $210,192 $177,500 $6,856 110 942 19 176 87.2% 2011 Feb 12 $267,808 $200,000 $7,289 98 991 13 179 88.9% Note: Current month data are preliminary 15-Mar-11 Real Estate Center at Texas A&M University and ABoR Page 3-6
  • 9. Austin Association of Realtors MLS Sales Closed by Month: February 2011 Lease Average Median Price per New Active Pending Sold to Year Month Leases Rent Rent 100 Sqft Listings Listings Sales DOM List Price 2009 Jan 1,071 $1,272 $1,150 $67 1,375 2,381 1,150 62 98.7% 2009 Feb 981 $1,223 $1,150 $65 1,221 2,301 1,004 60 98.8% 2009 Mar 1,050 $1,226 $1,150 $63 1,306 2,232 1,064 57 99.0% 2009 Apr 1,030 $1,318 $1,200 $68 1,352 2,339 1,141 59 99.1% 2009 May 1,168 $1,346 $1,200 $69 1,705 2,665 1,268 54 99.3% 2009 Jun 1,379 $1,349 $1,200 $70 1,997 2,837 1,438 52 99.0% 2009 Jul 1,740 $1,362 $1,240 $71 2,088 2,740 1,891 47 99.2% 2009 Aug 1,694 $1,314 $1,200 $71 1,803 2,782 1,411 49 99.1% 2009 Sep 1,107 $1,260 $1,150 $64 1,430 2,851 1,120 53 98.7% 2009 Oct 1,057 $1,270 $1,150 $67 1,379 2,720 1,049 56 98.6% 2009 Nov 929 $1,202 $1,100 $65 1,191 2,623 907 61 98.7% 2009 Dec 1,049 $1,244 $1,100 $66 1,161 2,222 1,058 64 98.6% 2010 Jan 1,128 $1,185 $1,100 $62 1,175 1,862 1,250 63 98.8% 2010 Feb 1,062 $1,201 $1,100 $66 1,014 1,676 1,072 60 99.0% 2010 Mar 1,079 $1,252 $1,150 $66 1,286 1,625 1,130 57 98.6% 2010 Apr 1,147 $1,311 $1,180 $69 1,447 1,785 1,233 49 99.3% 2010 May 1,216 $1,295 $1,200 $70 1,726 2,048 1,354 43 99.5% 2010 Jun 1,492 $1,378 $1,220 $68 2,106 2,202 1,605 40 99.2% 2010 Jul 1,869 $1,375 $1,250 $72 2,188 2,225 1,980 41 99.3% 2010 Aug 1,897 $1,351 $1,220 $69 1,924 2,308 1,576 42 99.1% 2010 Sep 1,223 $1,305 $1,200 $66 1,469 2,226 1,239 44 98.8% 2010 Oct 1,205 $1,293 $1,200 $66 1,332 2,038 1,179 48 99.1% 2010 Nov 1,098 $1,290 $1,200 $67 1,206 1,914 1,097 53 99.2% 2010 Dec 1,096 $1,264 $1,150 $66 1,065 1,626 1,100 55 99.3% 2011 Jan 1,162 $1,271 $1,150 $65 1,224 1,317 1,255 52 99.2% 2011 Feb 1,117 $1,280 $1,200 $68 996 1,162 1,130 48 99.3% Note: Current month data are preliminary 15-Mar-11 Real Estate Center at Texas A&M University and ABoR Page 3-7
  • 10. Austin Association of Realtors MLS Sales Closed by Month: February 2011 Commercial Lease Average Median Price per New Active Pending Sold to Year Month Leases Rent Rent 100 Sqft Listings Listings Sales DOM List Price 2009 Jan 9 $1,163 $1,250 $35 40 221 10 119 97.0% 2009 Feb 11 $1,104 $1,050 $48 51 230 12 103 96.3% 2009 Mar 10 $1,200 $1,400 $55 44 240 10 149 99.7% 2009 Apr 11 $1,099 $1,200 $36 40 242 11 153 94.8% 2009 May 10 $2,034 $1,880 $45 28 242 14 182 94.4% 2009 Jun 13 $1,875 $1,350 $33 32 242 12 149 94.0% 2009 Jul 15 $1,143 $1,200 $33 40 242 13 144 93.2% 2009 Aug 14 $1,462 $1,300 $26 33 242 12 163 100.3% 2009 Sep 14 $1,558 $1,200 $44 44 247 15 161 88.8% 2009 Oct 13 $7,965 $2,000 $170 31 263 13 143 91.2% 2009 Nov 11 $1,043 $1,140 $22 49 288 16 181 99.9% 2009 Dec 11 $1,635 $1,700 $106 54 293 5 117 94.3% 2010 Jan 11 $1,321 $1,350 $32 52 296 17 123 96.4% 2010 Feb 15 $1,362 $1,200 $32 51 313 16 232 98.1% 2010 Mar 18 $1,101 $990 $10 46 316 16 129 96.3% 2010 Apr 14 $1,599 $1,310 $35 27 306 14 191 100.5% 2010 May 12 $1,211 $1,250 $32 34 310 15 153 94.8% 2010 Jun 6 $1,233 $1,100 $10 25 296 7 138 97.0% 2010 Jul 14 $1,739 $1,670 $54 31 278 12 131 94.4% 2010 Aug 13 $1,119 $1,010 $70 26 267 19 122 88.5% 2010 Sep 18 $1,214 $1,020 $28 44 269 14 160 97.7% 2010 Oct 16 $1,222 $1,380 $41 55 278 19 206 93.6% 2010 Nov 12 $1,640 $1,610 $47 33 279 12 220 96.9% 2010 Dec 18 $1,187 $1,080 $36 32 248 18 308 94.7% 2011 Jan 15 $1,754 $1,250 $84 37 268 14 148 97.8% 2011 Feb 12 $1,271 $950 $33 43 270 11 207 93.5% Note: Current month data are preliminary 15-Mar-11 Real Estate Center at Texas A&M University and ABoR Page 3-8
  • 11. Austin Association of Realtors MLS Sales Closed by Price Class for: February 2011 Single Family Percent Sales % Change Active Estimated Price Class Sales Distribution Year-to-Date Year Ago Listings Days to Sell $1 to $19,999 2 0.2% 4 300% 1 8 $20,000 to $29,999 1 0.1% 4 33% 3 23 $30,000 to $39,999 2 0.2% 5 -17% 20 122 $40,000 to $49,999 6 0.5% 11 -21% 38 105 $50,000 to $59,999 17 1.5% 30 76% 60 61 $60,000 to $69,999 18 1.6% 31 48% 74 73 $70,000 to $79,999 13 1.2% 28 -24% 108 117 $80,000 to $89,999 25 2.2% 45 50% 142 96 $90,000 to $99,999 25 2.2% 46 44% 180 119 $100,000 to $109,999 32 2.9% 55 -8% 166 92 $110,000 to $119,999 47 4.2% 94 19% 280 91 $120,000 to $129,999 61 5.5% 108 2% 320 90 $130,000 to $139,999 49 4.4% 93 -20% 365 119 $140,000 to $149,999 52 4.7% 93 -6% 386 126 $150,000 to $159,999 56 5.0% 102 -19% 356 106 $160,000 to $169,999 57 5.1% 103 -5% 348 103 $170,000 to $179,999 41 3.7% 89 -10% 374 128 $180,000 to $189,999 37 3.3% 72 31% 306 129 $190,000 to $199,999 39 3.5% 67 -15% 269 122 $200,000 to $249,999 158 14.2% 279 2% 1,092 119 $250,000 to $299,999 119 10.7% 223 27% 758 103 $300,000 to $399,999 120 10.8% 242 13% 961 121 $400,000 to $499,999 50 4.5% 88 -11% 555 192 $500,000 to $599,999 31 2.8% 52 24% 372 218 $600,000 to $699,999 16 1.4% 25 32% 211 257 $700,000 to $799,999 14 1.3% 19 0% 141 226 $800,000 to $899,999 6 0.5% 8 -38% 120 456 $900,000 to $999,999 6 0.5% 12 500% 101 256 $1,000,000 and more 10 0.9% 28 0% 498 541 Total 1,112 2,058 4% 8,605 127 Note: Current month data are preliminary 15-Mar-11 Real Estate Center at Texas A&M University and ABoR Page 4-1
  • 12. Austin Association of Realtors MLS Sales Closed by Price Class for: February 2011 Townhouse/Condominium Percent Sales % Change Active Estimated Price Class Sales Distribution Year-to-Date Year Ago Listings Days to Sell $1 to $19,999 0 0.0% 0 0 $20,000 to $29,999 0 0.0% 1 -67% 0 0 $30,000 to $39,999 0 0.0% 4 -69% 10 76 $40,000 to $49,999 2 2.0% 3 -86% 13 132 $50,000 to $59,999 6 5.9% 10 -52% 10 30 $60,000 to $69,999 4 3.9% 10 100% 27 82 $70,000 to $79,999 2 2.0% 3 -25% 25 254 $80,000 to $89,999 5 4.9% 5 -38% 42 256 $90,000 to $99,999 6 5.9% 11 0% 35 97 $100,000 to $109,999 0 0.0% 1 -88% 34 1034 $110,000 to $119,999 2 2.0% 8 14% 59 224 $120,000 to $129,999 6 5.9% 11 -35% 56 155 $130,000 to $139,999 5 4.9% 12 -8% 46 117 $140,000 to $149,999 6 5.9% 9 13% 58 196 $150,000 to $159,999 7 6.9% 13 -19% 51 119 $160,000 to $169,999 8 7.8% 16 -6% 55 105 $170,000 to $179,999 2 2.0% 5 -17% 39 237 $180,000 to $189,999 3 2.9% 8 33% 33 125 $190,000 to $199,999 2 2.0% 7 -30% 57 248 $200,000 to $249,999 5 4.9% 10 -71% 139 423 $250,000 to $299,999 11 10.8% 19 46% 125 200 $300,000 to $399,999 11 10.8% 16 7% 129 245 $400,000 to $499,999 3 2.9% 4 33% 61 464 $500,000 to $599,999 2 2.0% 4 300% 25 190 $600,000 to $699,999 1 1.0% 2 100% 19 289 $700,000 to $799,999 0 0.0% 0 13 $800,000 to $899,999 0 0.0% 0 7 $900,000 to $999,999 1 1.0% 1 4 122 $1,000,000 and more 1 1.0% 1 18 548 Total 102 195 -25% 1,190 186 Note: Current month data are preliminary 15-Mar-11 Real Estate Center at Texas A&M University and ABoR Page 4-2
  • 13. Austin Association of Realtors MLS Sales Closed by Price Class for: February 2011 Lots Percent Sales % Change Active Estimated Price Class Sales Distribution Year-to-Date Year Ago Listings Days to Sell $1 to $19,999 14 17.5% 26 -4% 792 927 $20,000 to $29,999 7 8.8% 16 0% 357 679 $30,000 to $39,999 10 12.5% 17 0% 330 591 $40,000 to $49,999 7 8.8% 12 -14% 263 667 $50,000 to $59,999 7 8.8% 10 -23% 249 757 $60,000 to $69,999 6 7.5% 12 33% 230 583 $70,000 to $79,999 2 2.5% 7 -13% 211 917 $80,000 to $89,999 5 6.3% 7 0% 182 791 $90,000 to $99,999 3 3.8% 5 -38% 163 992 $100,000 to $109,999 0 0.0% 4 0% 59 449 $110,000 to $119,999 2 2.5% 4 100% 113 859 $120,000 to $129,999 1 1.3% 4 -33% 129 981 $130,000 to $139,999 0 0.0% 2 -50% 87 1323 $140,000 to $149,999 3 3.8% 3 200% 112 1136 $150,000 to $159,999 1 1.3% 2 100% 94 1430 $160,000 to $169,999 0 0.0% 2 -33% 60 913 $170,000 to $179,999 1 1.3% 2 -33% 95 1445 $180,000 to $189,999 0 0.0% 0 -100% 68 $190,000 to $199,999 1 1.3% 1 0% 99 3012 $200,000 to $249,999 4 5.0% 8 60% 173 658 $250,000 to $299,999 2 2.5% 3 50% 147 1491 $300,000 to $399,999 2 2.5% 3 0% 162 1643 $400,000 to $499,999 0 0.0% 1 -50% 96 2920 $500,000 to $599,999 0 0.0% 0 -100% 57 $600,000 to $699,999 1 1.3% 1 0% 44 1338 $700,000 to $799,999 1 1.3% 1 0% 32 973 $800,000 to $899,999 0 0.0% 1 0% 24 730 $900,000 to $999,999 0 0.0% 0 14 $1,000,000 and more 1 1.3% 1 -50% 57 1734 Total 80 154 -9% 4,499 889 Note: Current month data are preliminary 15-Mar-11 Real Estate Center at Texas A&M University and ABoR Page 4-3
  • 14. Austin Association of Realtors MLS Residential Sales Closed by Area, Ranked by Hotness for: February 2011 Hotness Pending Active Estimated Area Area Name Ratio* Sales Sales Listings Days-to-Sell 7 7 37.8 14 5 37 79 SWW Southwest West 36.9 41 32 111 37 CLN Cedar Park/Leander North 34.7 104 50 300 58 1A 1A 34.5 20 16 58 55 1N 1N 31.5 40 26 127 57 2 2 30.8 28 26 91 53 NE Suburban Northeast 29.0 27 11 93 66 NW Suburban Northwest 27.7 38 29 137 46 SWE Southwest East 27.2 50 36 184 58 HU Hutto ISD 26.7 46 21 172 70 3E 3E 26.4 14 10 53 95 MA Manor 26.0 32 16 123 92 RRW Round Rock West 25.6 90 66 352 63 SE Suburban Southeast 25.0 11 12 44 59 3 3 24.0 25 18 104 66 10S 10S 22.7 42 23 185 67 CLS Cedar Park/Leander South 21.6 66 47 306 67 N Suburban North 20.7 17 14 82 51 5E 5E 20.4 11 6 54 103 HH Hays County/Hays CSD 20.3 82 50 404 89 RRE Round Rock East 19.7 79 57 401 72 8W 8W 19.5 23 10 118 88 PF Pflugerville 19.2 82 61 426 75 9 9 19.0 4 4 21 66 BW Bastrop County West 18.5 17 7 92 123 OT Other 18.2 8 4 44 287 6 6 17.8 18 15 101 84 SC Suburban South Central 17.5 14 10 80 94 11 11 17.2 16 11 93 94 8E 8E 17.0 18 17 106 91 W Suburban West 16.4 18 15 110 77 5 5 16.0 24 20 150 118 1B 1B 16.0 23 20 144 88 10N 10N 15.9 14 17 88 61 2N 2N 15.9 14 12 88 71 RN River North 15.9 36 30 227 97 GTE Georgetown East 15.7 24 17 153 109 4 4 15.7 18 11 115 88 BA Bastrop County 14.8 24 13 162 120 GTW Georgetown West 13.9 62 55 446 109 HD Hays County/Dripping Springs ISD 13.6 30 25 221 123 BL Blanco County 12.8 5 5 39 145 FC Fayette County 11.8 2 1 17 443 EL Elgin 11.6 11 12 95 98 LH Liberty Hill School District 11.3 9 8 80 111 LS S. Travis Lake 10.4 59 54 568 131 SV Smithville School District 10.1 7 7 69 173 JA Jarrell School District 10.0 3 2 30 130 Note: Current month data are preliminary. The hotness ratio is pending sales as a percent of active listings 15-Mar-11 Real Estate Center at Texas A&M University and ABoR Page 5-1
  • 15. Austin Association of Realtors MLS Residential Sales Closed by Area, Ranked by Hotness for: February 2011 Hotness Pending Active Estimated Area Area Name Ratio* Sales Sales Listings Days-to-Sell UT UT Area 9.1 2 1 22 125 HW Hays County/Wimberley ISD 8.0 13 12 162 156 HS Hays County/San Marcos ISD 7.7 5 10 65 91 LN N. Travis Lake 7.4 20 15 269 205 LW Lake West 7.4 6 3 81 217 CC Caldwell County 7.0 9 10 129 157 MC Milam County 6.3 5 3 79 328 WE E. Williamson County 6.3 1 4 16 94 BU Burnet County 5.9 12 13 202 213 LL LL 4.6 6 2 131 427 CM Comal County 4.4 2 3 45 147 LC Lee County 2 38 210 Note: Current month data are preliminary. The hotness ratio is pending sales as a percent of active listings 15-Mar-11 Real Estate Center at Texas A&M University and ABoR Page 5-2
  • 16. Austin Association of Realtors MLS Sales Closed by Area for: February 2011 Single Family Sales Sold Estimated Average Median Price to List Coop New Active Pending Days-to- Year Mont Sales Price Price per Sqft Price Sales Listings Listings Sales DOM Sell Area: 10N 2010 Feb 19 $181,881 $160,000 $119 97% 51 87 30 35 58 2011 Feb 17 $160,016 $147,750 $114 96% 24 88 14 91 61 Area: 10S 2010 Feb 32 $185,017 $174,380 $110 99% 87 156 49 46 46 2011 Feb 23 $177,704 $180,850 $95 95% 58 185 42 105 67 Area: 11 2010 Feb 10 $116,601 $125,000 $70 97% 31 82 21 35 70 2011 Feb 11 $90,249 $71,750 $69 96% 21 93 16 92 94 Area: 1A 2010 Feb 11 $453,684 $430,000 $187 95% 21 68 15 71 72 2011 Feb 16 $399,013 $390,000 $153 95% 26 58 20 70 55 Area: 1B 2010 Feb 16 $723,388 $685,350 $259 95% 53 185 22 78 137 2011 Feb 20 $622,553 $500,000 $260 94% 41 144 23 136 88 Area: 1N 2010 Feb 20 $291,620 $240,750 $136 98% 46 137 29 56 63 2011 Feb 26 $290,282 $260,000 $136 96% 50 127 40 78 57 Area: 2 2010 Feb 10 $267,050 $281,000 $183 97% 44 125 20 47 70 2011 Feb 26 $235,658 $225,000 $160 96% 45 91 28 89 53 Area: 2N 2010 Feb 12 $140,358 $130,150 $88 95% 39 95 20 68 69 2011 Feb 12 $130,960 $133,440 $87 95% 21 88 14 108 71 Area: 3 2010 Feb 12 $202,208 $198,500 $132 97% 55 152 22 48 89 2011 Feb 18 $172,821 $162,500 $109 96% 30 104 25 73 66 Area: 3E 2010 Feb 12 $111,413 $105,000 $74 96% 18 55 17 60 73 2011 Feb 10 $94,974 $101,960 $62 95% 19 53 14 36 95 Area: 4 2010 Feb 11 $325,683 $320,000 $204 96% 59 148 19 100 113 2011 Feb 11 $317,980 $285,500 $224 97% 33 115 18 69 88 Area: 5 2010 Feb 18 $152,358 $127,200 $126 95% 58 168 35 95 126 2011 Feb 20 $166,634 $161,500 $138 97% 34 150 24 72 118 Area: 5E 2010 Feb 11 $117,084 $105,000 $77 100% 25 58 17 59 90 2011 Feb 6 $116,924 $114,300 $73 100% 13 54 11 112 103 Area: 6 2010 Feb 13 $397,408 $321,500 $240 94% 41 126 25 48 132 2011 Feb 15 $294,814 $247,500 $212 96% 31 101 18 106 84 Area: 7 2010 Feb 5 $341,279 $300,000 $230 94% 11 29 4 101 68 2011 Feb 5 $383,400 $395,000 $198 94% 15 37 14 111 79 Area: 8E 2010 Feb 19 $679,171 $702,200 $217 95% 40 122 20 93 112 2011 Feb 17 $656,434 $550,000 $193 94% 25 106 18 90 91 Note: Current month data are preliminary 15-Mar-11 Real Estate Center at Texas A&M University and ABoR Page 6-1
  • 17. Austin Association of Realtors MLS Sales Closed by Area for: February 2011 Single Family Sales Sold Estimated Average Median Price to List Coop New Active Pending Days-to- Year Mont Sales Price Price per Sqft Price Sales Listings Listings Sales DOM Sell Area: 8W 2010 Feb 13 $717,931 $450,000 $222 83% 36 136 21 90 107 2011 Feb 10 $481,133 $510,000 $168 95% 35 118 23 90 88 Area: 9 2010 Feb 6 $132,242 $131,750 $88 92% 9 27 9 88 86 2011 Feb 4 $160,100 $79,950 $123 98% 9 21 4 34 66 Area: BA 2010 Feb 18 $140,386 $136,400 $79 99% 58 149 31 87 107 2011 Feb 13 $180,339 $132,380 $73 96% 40 162 24 129 120 Area: BL 2010 Feb 2 $420,710 $420,710 $314 91% 10 43 4 80 212 2011 Feb 5 $187,225 $209,000 $119 94% 7 39 5 141 145 Area: BU 2010 Feb 8 $148,739 $136,250 $74 98% 45 214 10 61 268 2011 Feb 13 $264,842 $246,000 $116 94% 32 202 12 109 213 Area: BW 2010 Feb 8 $134,838 $110,500 $76 96% 30 117 12 148 141 2011 Feb 7 $183,000 $156,000 $82 100% 23 92 17 55 123 Area: CC 2010 Feb 10 $129,590 $100,000 $69 95% 32 126 14 115 128 2011 Feb 10 $90,600 $96,000 $53 92% 15 129 9 116 157 Area: CLN 2010 Feb 67 $191,164 $147,500 $87 95% 130 374 112 75 73 2011 Feb 50 $199,848 $150,000 $84 96% 111 300 104 86 58 Area: CLS 2010 Feb 51 $243,171 $212,700 $101 95% 130 337 88 73 63 2011 Feb 47 $244,217 $217,460 $96 97% 113 306 66 88 67 Area: CM 2011 Feb 3 $115,333 $116,000 $89 93% 9 45 2 146 147 Area: EL 2010 Feb 18 $119,467 $102,000 $71 95% 25 106 21 96 89 2011 Feb 12 $108,573 $97,000 $62 95% 33 95 11 84 98 Area: FC 2010 Feb 5 $180,350 $163,850 $87 94% 4 13 1 221 119 2011 Feb 1 $85,000 $85,000 $67 106% 17 2 56 443 Area: GP 2010 Feb 3 $127,512 $134,000 $92 97% 1 12 1 58 548 Area: GTE 2010 Feb 6 $115,817 $124,500 $76 96% 31 150 19 51 111 2011 Feb 17 $146,162 $146,440 $77 96% 38 153 24 66 109 Area: GTW 2010 Feb 52 $260,199 $218,250 $106 96% 114 416 59 117 99 2011 Feb 55 $203,093 $169,380 $104 97% 92 446 62 90 109 Area: GZ 2010 Feb 1 $250,000 $250,000 $163 100% 1 9 202 164 Area: HD 2010 Feb 21 $295,033 $280,000 $110 95% 62 224 27 61 111 2011 Feb 25 $333,541 $311,430 $117 96% 54 221 30 106 123 Note: Current month data are preliminary 15-Mar-11 Real Estate Center at Texas A&M University and ABoR Page 6-2
  • 18. Austin Association of Realtors MLS Sales Closed by Area for: February 2011 Single Family Sales Sold Estimated Average Median Price to List Coop New Active Pending Days-to- Year Mont Sales Price Price per Sqft Price Sales Listings Listings Sales DOM Sell Area: HH 2010 Feb 59 $165,818 $143,000 $82 96% 138 376 87 76 78 2011 Feb 50 $140,726 $135,900 $74 97% 106 404 82 106 89 Area: HS 2010 Feb 8 $145,256 $139,000 $88 96% 14 59 11 53 100 2011 Feb 10 $244,867 $260,000 $100 96% 16 65 5 86 91 Area: HU 2010 Feb 31 $146,086 $137,500 $69 97% 59 182 52 65 73 2011 Feb 21 $152,573 $150,000 $76 100% 39 172 46 73 70 Area: HW 2010 Feb 12 $268,783 $241,250 $133 90% 37 169 9 164 153 2011 Feb 12 $204,318 $198,500 $104 91% 32 162 13 99 156 Area: JA 2010 Feb 4 $93,650 $99,800 $63 98% 4 30 2 38 91 2011 Feb 2 $152,995 $153,000 $79 100% 7 30 3 346 130 Area: LC 2010 Feb 2 $182,500 $182,500 $76 89% 8 30 2 52 161 2011 Feb 2 $176,625 $176,620 $47 92% 5 38 338 210 Area: LH 2010 Feb 5 $283,000 $243,000 $116 97% 24 83 11 74 122 2011 Feb 8 $245,981 $258,500 $97 95% 18 80 9 128 111 Area: LL 2010 Feb 1 $3,950,000 $3,950,000 $731 88% 17 81 5 10 211 2011 Feb 2 $125,500 $125,500 $85 96% 23 131 6 90 427 Area: LN 2010 Feb 13 $215,771 $170,000 $97 95% 55 257 17 112 241 2011 Feb 15 $196,664 $174,650 $106 96% 58 269 20 136 205 Area: LS 2010 Feb 40 $404,065 $333,750 $142 96% 151 662 53 110 174 2011 Feb 54 $429,876 $357,000 $146 95% 118 568 59 143 131 Area: LW 2011 Feb 3 $251,500 $276,500 $140 96% 13 81 6 232 217 Area: MA 2010 Feb 10 $116,920 $98,750 $58 98% 50 101 26 63 75 2011 Feb 16 $125,424 $92,000 $66 98% 33 123 32 125 92 Area: MC 2010 Feb 2 $107,160 $107,160 $44 88% 10 62 2 94 298 2011 Feb 3 $181,667 $185,000 $66 92% 8 79 5 78 328 Area: N 2010 Feb 19 $188,002 $180,000 $96 98% 49 82 28 63 46 2011 Feb 14 $181,627 $175,000 $90 97% 27 82 17 54 51 Area: NE 2010 Feb 20 $145,383 $146,740 $84 95% 44 130 28 62 79 2011 Feb 11 $140,500 $131,000 $74 98% 28 93 27 115 66 Area: NW 2010 Feb 34 $234,343 $201,000 $106 97% 69 165 47 65 48 2011 Feb 29 $252,024 $202,500 $106 97% 59 137 38 61 46 Area: OT 2011 Feb 4 $337,740 $271,250 $155 89% 3 44 8 229 287 Note: Current month data are preliminary 15-Mar-11 Real Estate Center at Texas A&M University and ABoR Page 6-3
  • 19. Austin Association of Realtors MLS Sales Closed by Area for: February 2011 Single Family Sales Sold Estimated Average Median Price to List Coop New Active Pending Days-to- Year Mont Sales Price Price per Sqft Price Sales Listings Listings Sales DOM Sell Area: PF 2010 Feb 62 $157,853 $151,900 $73 97% 195 447 116 65 71 2011 Feb 61 $153,922 $147,000 $71 96% 121 426 82 103 75 Area: RN 2010 Feb 25 $377,768 $300,000 $126 98% 50 241 34 87 108 2011 Feb 30 $610,815 $512,500 $162 94% 72 227 36 120 97 Area: RRE 2010 Feb 55 $187,979 $177,500 $79 97% 165 455 106 75 74 2011 Feb 57 $169,823 $154,630 $75 98% 108 401 79 90 72 Area: RRW 2010 Feb 62 $237,802 $232,500 $94 97% 148 357 90 66 59 2011 Feb 66 $243,780 $234,500 $93 97% 133 352 90 101 63 Area: SC 2010 Feb 14 $164,691 $140,680 $77 93% 29 83 17 66 83 2011 Feb 10 $141,294 $115,000 $73 98% 17 80 14 79 94 Area: SE 2010 Feb 3 $100,300 $113,500 $47 99% 27 60 18 56 79 2011 Feb 12 $95,048 $87,550 $58 98% 11 44 11 81 59 Area: SH 2010 Feb 1 $44,000 $44,000 $19 96% 1 4 6 73 Area: SV 2010 Feb 5 $98,200 $80,000 $67 95% 14 64 4 125 128 2011 Feb 7 $126,779 $116,000 $70 97% 17 69 7 197 173 Area: SWE 2010 Feb 40 $221,739 $201,410 $104 96% 102 203 60 91 59 2011 Feb 36 $238,907 $231,240 $101 98% 52 184 50 87 58 Area: SWW 2010 Feb 39 $287,628 $275,000 $117 98% 82 151 45 59 47 2011 Feb 32 $292,825 $277,000 $122 98% 59 111 41 85 37 Area: UT 2010 Feb 4 $436,000 $427,500 $264 97% 9 22 1 145 112 2011 Feb 1 $226,000 $226,000 $149 100% 6 22 2 2 125 Area: W 2010 Feb 22 $372,768 $324,100 $139 95% 35 124 29 86 85 2011 Feb 15 $351,625 $362,500 $131 98% 40 110 18 83 77 Area: WE 2010 Feb 2 $101,500 $101,500 $73 95% 14 54 3 36 282 2011 Feb 4 $146,475 $167,750 $97 99% 2 16 1 199 94 Area: WW 2010 Feb 1 $190,000 $190,000 $110 99% 2 25 4 104 228 Note: Current month data are preliminary 15-Mar-11 Real Estate Center at Texas A&M University and ABoR Page 6-4
  • 20. Austin Association of Realtors MLS Sales Closed by Area for: February 2011 Townhouse/Condominium Sales Sold Estimated Average Median Price to List Coop New Active Pending Days-to- Year Mont Sales Price Price per Sqft Price Sales Listings Listings Sales DOM Sell Area: 10N 2010 Feb 3 $184,233 $182,900 $142 97% 8 40 6 61 103 2011 Feb 1 $250,000 $250,000 $132 96% 4 30 1 42 101 Area: 10S 2011 Feb 2 $170,380 $170,380 $119 97% 5 12 3 132 104 Area: 1A 2010 Feb 14 $195,886 $207,000 $142 96% 27 62 16 89 80 2011 Feb 10 $169,094 $157,500 $141 95% 11 71 12 74 97 Area: 1B 2010 Feb 6 $178,000 $178,500 $200 95% 27 88 13 59 217 2011 Feb 6 $272,833 $169,000 $207 94% 5 55 3 128 93 Area: 1N 2010 Feb 1 $179,500 $179,500 $152 97% 10 21 2 129 110 2011 Feb 1 $262,000 $262,000 $145 97% 2 30 2 31 166 Area: 2 2010 Feb 5 $167,290 $143,000 $149 97% 17 46 9 146 94 2011 Feb 1 $72,000 $72,000 $120 100% 5 44 8 35 143 Area: 2N 2010 Feb 6 $59,179 $45,590 $78 98% 7 46 8 39 69 2011 Feb 8 $75,925 $74,950 $87 99% 6 39 7 64 73 Area: 3 2010 Feb 3 $48,333 $51,500 $49 92% 7 19 6 146 91 2011 Feb 1 $291,400 $291,400 $185 97% 9 16 5 49 101 Area: 4 2010 Feb 2 $153,500 $153,500 $190 98% 6 36 4 3 115 2011 Feb 1 $253,500 $253,500 $170 96% 12 40 3 73 178 Area: 5 2010 Feb 4 $239,311 $152,250 $229 95% 7 42 9 52 118 2011 Feb 3 $197,667 $168,000 $178 97% 9 28 6 93 100 Area: 5E 2011 Feb 1 $45,000 $45,000 $41 90% 192 Area: 6 2010 Feb 12 $205,271 $190,500 $176 94% 29 115 16 96 161 2011 Feb 11 $229,730 $151,000 $208 98% 18 46 7 63 56 Area: 7 2010 Feb 1 $222,500 $222,500 $252 99% 10 48 2 68 186 2011 Feb 2 $315,000 $315,000 $209 96% 10 38 3 111 131 Area: 8E 2010 Feb 2 $265,000 $265,000 $184 100% 8 28 4 50 150 2011 Feb 1 $162,000 $162,000 $206 99% 8 26 6 19 132 Area: 9 2010 Feb 9 $65,798 $40,470 $68 94% 22 54 10 42 83 2011 Feb 5 $108,500 $124,500 $123 97% 9 52 4 129 122 Area: BU 2011 Feb 1 $90,990 $90,990 $68 121% 1 5 91 Area: CLN 2010 Feb 1 $111,000 $111,000 $81 99% 1 4 1 47 56 Area: CLS 2010 Feb 5 $149,429 $152,000 $101 96% 26 40 8 85 138 2011 Feb 1 $172,102 $172,100 $118 96% 20 34 2 66 102 Note: Current month data are preliminary 15-Mar-11 Real Estate Center at Texas A&M University and ABoR Page 6-5
  • 21. Austin Association of Realtors MLS Sales Closed by Area for: February 2011 Townhouse/Condominium Sales Sold Estimated Average Median Price to List Coop New Active Pending Days-to- Year Mont Sales Price Price per Sqft Price Sales Listings Listings Sales DOM Sell Area: DT 2010 Feb 8 $291,938 $266,000 $291 94% 41 172 19 55 236 2011 Feb 15 $460,327 $308,800 $408 97% 32 115 14 139 116 Area: GTE 2011 Feb 1 $256,250 $256,250 $153 97% 7 3 873 98 Area: HH 2010 Feb 1 $138,500 $138,500 $89 99% 3 7 1 61 213 Area: HS 2011 Feb 1 $50,000 $50,000 $69 88% 2 7 2 19 91 Area: HW 2010 Feb 3 $106,667 $105,000 $81 93% 7 4 76 116 2011 Feb 1 $76,800 $76,800 $57 97% 1 9 1 110 137 Area: LL 2011 Feb 2 $127,182 $127,180 $126 77% 1 16 110 195 Area: LN 2010 Feb 3 $151,333 $161,500 $100 95% 3 62 5 26 213 2011 Feb 1 $230,000 $230,000 $160 100% 14 51 1 165 133 Area: LS 2010 Feb 5 $200,300 $160,000 $100 94% 26 87 8 208 198 2011 Feb 5 $149,920 $139,000 $96 92% 13 42 12 241 93 Area: N 2010 Feb 2 $146,000 $146,000 $111 98% 8 16 4 66 91 2011 Feb 1 $155,000 $155,000 $111 97% 1 14 5 66 64 Area: NE 2010 Feb 3 $141,567 $137,800 $110 96% 3 24 55 146 2011 Feb 3 $101,300 $89,000 $106 99% 7 16 4 82 112 Area: NW 2010 Feb 22 $75,075 $49,750 $73 101% 16 23 19 22 34 2011 Feb 3 $198,515 $156,650 $113 97% 10 52 8 153 98 Area: PF 2010 Feb 2 $105,000 $105,000 $91 100% 4 23 1 38 105 Area: RN 2011 Feb 3 $157,000 $162,000 $151 100% 5 19 3 23 105 Area: RRE 2010 Feb 1 $98,700 $98,700 $71 90% 2 14 26 365 Area: SC 2010 Feb 1 $214,050 $214,050 $133 98% 8 20 1 24 281 Area: SWW 2010 Feb 1 $196,000 $196,000 $140 98% 9 16 1 94 77 2011 Feb 1 $163,000 $163,000 $165 99% 3 10 4 5 51 Area: UT 2010 Feb 6 $197,500 $208,750 $207 97% 46 171 8 127 200 2011 Feb 8 $171,481 $156,000 $204 95% 43 142 16 121 199 Area: W 2010 Feb 2 $224,750 $224,750 $124 95% 6 20 5 24 111 2011 Feb 1 $355,000 $355,000 $209 97% 12 27 5 0 159 Note: Current month data are preliminary 15-Mar-11 Real Estate Center at Texas A&M University and ABoR Page 6-6
  • 22. Austin Association of Realtors MLS Sales Closed by Area for: February 2011 Lots Sales Sold Estimated Average Median Price to List Coop New Active Pending Days-to- Year Mont Sales Price Price per Sqft Price Sales Listings Listings Sales DOM Sell Area: 1A 2010 Feb 1 $180,000 $180,000 92% 2 14 1 262 852 2011 Feb 1 $115,000 $115,000 68% 1 19 1 9 1156 Area: 1B 2010 Feb 2 $535,000 $535,000 90% 1 20 4 148 406 2011 Feb 1 $367,500 $367,500 82% 5 21 1 386 274 Area: 1N 2010 Feb 1 $125,000 $125,000 100% 2 8 339 365 Area: 3 2010 Feb 1 $55,000 $55,000 92% 5 17 28 388 Area: 3E 2010 Feb 2 $99,750 $99,750 75% 8 14 183 Area: 5 2010 Feb 4 $76,000 $82,500 99% 14 98 3 44 1052 2011 Feb 1 $95,000 $95,000 100% 15 81 4 732 569 Area: 6 2010 Feb 1 $160,000 $160,000 97% 3 26 2 2 527 2011 Feb 2 $259,000 $259,000 79% 27 62 448 Area: 7 2010 Feb 1 $235,000 $235,000 94% 3 54 183 Area: 8E 2010 Feb 1 $410,000 $410,000 94% 6 32 3 286 307 2011 Feb 2 $293,500 $293,500 94% 5 42 3 449 295 Area: 8W 2010 Feb 1 $330,000 $330,000 100% 8 72 3 663 730 2011 Feb 2 $86,300 $86,300 89% 6 76 7 380 660 Area: 9 2011 Feb 1 $7,000 $7,000 90% 14 802 319 Area: BA 2010 Feb 5 $13,300 $2,250 80% 9 121 3 127 298 2011 Feb 3 $16,167 $5,500 89% 12 134 5 289 365 Area: BL 2011 Feb 1 $16,000 $16,000 53% 4 57 4 121 867 Area: BU 2010 Feb 1 $1,995 $2,000 100% 53 272 3 259 1601 2011 Feb 2 $113,750 $113,750 85% 10 246 2 44 1548 Area: BW 2010 Feb 3 $55,000 $53,000 91% 6 79 1 41 370 2011 Feb 2 $69,500 $69,500 98% 14 97 4 344 571 Area: CC 2010 Feb 1 $28,000 $28,000 70% 3 48 133 626 Area: CLN 2010 Feb 2 $91,250 $91,250 89% 6 158 3 213 848 2011 Feb 4 $105,238 $75,980 92% 12 71 8 339 480 Area: CLS 2010 Feb 2 $62,000 $62,000 80% 64 2 280 730 2011 Feb 1 $60,000 $60,000 80% 15 598 342 Area: CM 2010 Feb 1 $5,000 $5,000 67% 5 52 23 949 2011 Feb 2 $64,500 $64,500 90% 71 177 6 64 2019 Note: Current month data are preliminary 15-Mar-11 Real Estate Center at Texas A&M University and ABoR Page 6-7
  • 23. Austin Association of Realtors MLS Sales Closed by Area for: February 2011 Lots Sales Sold Estimated Average Median Price to List Coop New Active Pending Days-to- Year Mont Sales Price Price per Sqft Price Sales Listings Listings Sales DOM Sell Area: EL 2010 Feb 3 $24,333 $22,500 88% 8 55 2 189 456 Area: GTE 2010 Feb 1 $65,800 $65,800 92% 3 33 55 402 Area: GTW 2010 Feb 7 $77,929 $90,000 84% 21 189 4 184 932 2011 Feb 1 $270,000 $270,000 90% 21 176 5 286 683 Area: HD 2010 Feb 6 $110,883 $114,250 92% 12 140 7 188 691 2011 Feb 6 $67,000 $66,000 90% 11 137 5 148 521 Area: HH 2011 Feb 4 $39,875 $40,750 87% 9 85 3 406 597 Area: HS 2010 Feb 1 $59,000 $59,000 95% 3 18 62 274 2011 Feb 1 $89,000 $89,000 74% 4 24 1 206 487 Area: HU 2010 Feb 1 $49,900 $49,900 100% 26 1 19 593 Area: HW 2010 Feb 6 $81,833 $61,500 84% 16 138 7 83 442 2011 Feb 3 $39,833 $44,000 86% 15 116 2 108 326 Area: KL 2011 Feb 2 $61,500 $61,500 92% 1 215 61 Area: LH 2010 Feb 2 $56,250 $56,250 101% 5 79 2 206 515 2011 Feb 3 $27,633 $23,900 70% 7 73 307 459 Area: LL 2010 Feb 1 $8,700 $8,700 58% 3 87 1 179 1443 Area: LN 2010 Feb 12 $185,719 $14,750 89% 90 1,109 8 205 1632 2011 Feb 7 $35,405 $14,140 80% 84 1,148 9 327 1445 Area: LS 2010 Feb 15 $102,533 $24,500 90% 62 737 14 263 868 2011 Feb 14 $65,769 $41,000 91% 100 686 15 97 599 Area: LW 2010 Feb 2 $77,500 $77,500 86% 15 162 487 1183 2011 Feb 6 $88,067 $59,000 86% 16 167 3 225 802 Area: RN 2010 Feb 1 $750,000 $750,000 75% 3 97 2 202 656 2011 Feb 1 $1,300,000 $1,300,000 87% 28 103 1 404 817 Area: RRE 2010 Feb 1 $30,000 $30,000 84% 1 46 1 348 1199 2011 Feb 2 $31,875 $31,880 88% 1 34 5 84 621 Area: RRW 2011 Feb 1 $120,000 $120,000 95% 2 4 1 0 104 Area: SV 2010 Feb 2 $50,500 $50,500 92% 6 31 3 56 218 2011 Feb 1 $16,750 $16,750 81% 31 81 246 Area: SWE 2011 Feb 1 $90,000 $90,000 95% 23 1 681 466 Note: Current month data are preliminary 15-Mar-11 Real Estate Center at Texas A&M University and ABoR Page 6-8
  • 24. Austin Association of Realtors MLS Sales Closed by Area for: February 2011 Lots Sales Sold Estimated Average Median Price to List Coop New Active Pending Days-to- Year Mont Sales Price Price per Sqft Price Sales Listings Listings Sales DOM Sell Area: SWW 2010 Feb 1 $36,100 $36,100 103% 15 56 47 681 Area: W 2010 Feb 1 $472,390 $472,390 95% 6 88 264 2294 2011 Feb 2 $675,000 $675,000 77% 20 93 14 338 1543 Area: WW 2010 Feb 1 $102,000 $102,000 89% 3 13 1 28 475 Note: Current month data are preliminary 15-Mar-11 Real Estate Center at Texas A&M University and ABoR Page 6-9