
Recomendados
Mais conteúdo relacionado
Semelhante a global response to board 1201 questions
Semelhante a global response to board 1201 questions (20)
Mais de krgc
Mais de krgc (20)
global response to board 1201 questions
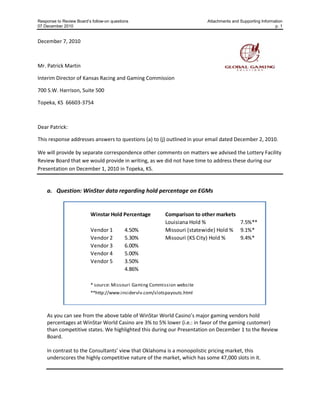
- 1. Response to Review Board’s follow-on questions Attachments and Supporting Information 07 December 2010 p. 1 December 7, 2010 Mr. Patrick Martin Interim Director of Kansas Racing and Gaming Commission 700 S.W. Harrison, Suite 500 Topeka, KS 66603-3754 Dear Patrick: This response addresses answers to questions (a) to (j) outlined in your email dated December 2, 2010. We will provide by separate correspondence other comments on matters we advised the Lottery Facility Review Board that we would provide in writing, as we did not have time to address these during our Presentation on December 1, 2010 in Topeka, KS. a. Question: WinStar data regarding hold percentage on EGMs Winstar Hold Percentage Comparison to other markets Louisiana Hold % 7.5%** Vendor 1 4.50% Missouri (statewide) Hold % 9.1%* Vendor 2 5.30% Missouri (KS City) Hold % 9.4%* Vendor 3 6.00% Vendor 4 5.00% Vendor 5 3.50% 4.86% * source: Missouri Gaming Commission website **http://www.insidervlv.com/slotspayouts.html As you can see from the above table of WinStar World Casino’s major gaming vendors hold percentages at WinStar World Casino are 3% to 5% lower (i.e.: in favor of the gaming customer) than competitive states. We highlighted this during our Presentation on December 1 to the Review Board. In contrast to the Consultants’ view that Oklahoma is a monopolistic pricing market, this underscores the highly competitive nature of the market, which has some 47,000 slots in it.
- 2. Response to Review Board’s follow-on questions Attachments and Supporting Information 07 December 2010 p. 2 b. Question: Winstar data regarding 95% loyalty The Consultants presented TripAdvisor.com data with some 30 comments from over 3 million customer visits. We dispute the integrity and the validity of this data. Summarized below are our customer satisfaction results for WinStar World Casino and also for Riverwind Casino. These are from 2010 results based on feedback provided by 1,000 customers at each facility. Customer satisfaction survey results 2010 Survey Results WinStar Riverwind Customer Satisfaction 91.4% 94% Customer Loyalty 94.6% 96% Percent of customers somewhat to very satisfied 91.4% 92% Percent of customers likely to very likely to recommend to friends and family 93.6% 93% Percent of customers satisfied with the staff friendliness 93.4% 97% In addition, both WinStar World Casino and Riverwind Casino have been the recipients of various recognition awards. WinStar World Casino 2010 Awards (non-populated area with fewer media outlet awards): Nominated by the 45th Academy of Country Music – Top Country Music Casino Venue in the United States in 2010. WinStar RV Park named Gold Award winner of The Oklahoma and Arkansas Chapter of The American Concrete Paving Association in 2010. Riverwind Readership Awards: 2007 Oklahoma Readers’ Choice Award 2008 the Oklahoma Gazette Best of Oklahoma City, category for Friendliest Casino. 2008 the Oklahoma Gazette Best of Oklahoma City, category for Best Casino. 2009 the Oklahoma Gazette Best of Oklahoma City, category for Best Casino. 2009 and 2010 the Oklahoma Gazette of Oklahoma City, preferred venue, placed in the top five. 2010 the Oklahoma Gazette Best of Oklahoma City, category for Best Concert Venue, placed in top five. We have also included an attachment with October – November (approximately 30 days) Facebook comments from WinStar and Riverwind customers.
- 3. Response to Review Board’s follow-on questions Attachments and Supporting Information 07 December 2010 p. 3 c. Question: Travel data to Norman, Oklahoma facility (Riverwind Casino) Oklahoma City Central Business District is located at the intersection of I-35 and I-40. Within 100 miles of this central location there are 42 casinos in Oklahoma. As discussed we own Remington Park, Newcastle Gaming, Goldsby Gaming and Riverwind Casino. The following are distances to the closest casino properties to Oklahoma City (OKC) and direction from the above intersection. 1. OKC to Remington Park- North on I-35, 10.3 miles (clean drive on I-35) 2. OKC to Lucky Star- North, 32miles (clean drive north) 3. OKC to Firelake Grand Casino- East on I-40, 26.6 miles (clean drive on I-40) 4. OKC to Riverwind- South on I-35, 22.25 miles (congested drive on I-35 through Norman) 5. OKC to Newcastle Gaming- South- 22.4miles (clean drive via freeway to west) 6. OKC to Goldsby Gaming- South on I-35, 23miles (congested drive on-I-35 through Norman) Seventy percent of customers in our player tracking data base come to Riverwind Casino from North of I-40 or farther away than 25 miles or a typical drive time of 30 minutes. If I-35 is congested through Norman, this drive time will be longer. This means they appear to choose to go to Riverwind Casino even though getting to Remington Park would be the closest or Firelake (with some similar amenities to Riverwind Casino) would take less time and the minimum distance is 22.25 miles. d. Question: Support other instances of building out ancillary facilities according to market forces The Review Board requested additional information to assist in their evaluation of the proposed racetrack amenity. Three pieces of information are provided with this response. (i) The racetrack plan (ii) Illustrative information on propensity of auto sports customers to game (iii) Estimates of potential incremental gaming revenue, not included in our conservative projections
- 4. Response to Review Board’s follow-on questions Attachments and Supporting Information 07 December 2010 p. 4 (i) Racetrack Plan (shown below) (ii) Illustrative information on propensity of auto sports customers to game As noted previously customer preference surveys and market research clearly support that racetrack customers are also gaming customers. Some examples follow: • The demographics of attendees that attend NASCAR races closely mirror the general population in terms of income. • According to Harrah’s Survey 2003: Profile of an American Gambler, 14% of casino-goers are auto racing spectators. o 13% of the U.S. population are auto-racing spectators according to the same Harrah’s survey meaning auto racing visitors will be slightly more likely to visit a casino than the average person. Interestingly, the survey did not even ask about equestrian events. • Synergy between auto racing and casino is evidenced by numerous auto races that have been or are currently title-sponsored by casinos: o Harrah’s 500 (NASCAR event held at Texas Motor Speedway) o Belterra Resort Indy 300 (IRL event held at Kentucky Speedway) o Sam’s Town 300 (NASCAR Nationwide event held at Las Vegas Motor Speedway) o Casino Arizona 150 (NASCAR Nationwide event held at Phoenix International Raceway) o Ameristar Casino has sponsored Indy Racing Northern Light Series at Kansas Motor Speedway
- 5. Response to Review Board’s follow-on questions Attachments and Supporting Information 07 December 2010 p. 5 o WinStar World 350 (NASCAR Nationwide event held at Texas Motor Speedway) o Tioga Downs Casino 125 (NASCAR Camping World Series East event at Watkins Glen). Tioga Downs and Vernon Downs also became joint sponsors of Watkins Glen International for three years. o Thunder Valley Casino Resort 200 (NASCAR K&N Pro Series West event at Infineon Speedway) • Harrah’s Entertainment sponsored a car in NASCAR for several years: o From Sports Business Daily - Las Vegas-based Harrah's Entertainment "is gambling" that its title sponsorship of this Sunday's Winston Cup Harrah's 500 at Texas Motor Speedway "will rev up business at its casinos in" LA and NV, according to Richard Alm of the DALLAS MORNING NEWS. Courtesy of Harrah's, 300 top customers will spend Saturday night at Harrah's new luxury hotel in Shreveport, LA, then board a DC-9 on Sunday morning for a flight to the race. Harrah's VP/Strategic Alliances John Dluzak said, "The demographics for NASCAR are moving upward in terms of income. It's a very attractive customer base because of the brand loyalty of NASCAR fans." • Synergy between auto racing and casino supported by Kansas Entertainment building a casino adjacent to the Kansas Speedway in the Northeast Gaming Zone: o 2009 Kansas Entertainment bid cited survey data that said 57.5% of Kansas Speedway visitors had visited a casino in the past 12 months. This meant that Kansas Speedway visitors were 27% more likely to have visited a casino than the average person in Kansas City. o Kansas Entertainment said that fans of the Indy Racing League are 85% more likely to visit a casino than the average person. WinSpirit currently has an expression of interests from the Indy Racing League. • Sahara Hotel & Casino in Las Vegas has a NASCAR Café. • Over 13 million attended NASCAR events in 2005 (per NASCAR) and over 306 million viewers watched a NASCAR race in 2005 (Source: Nielsen Media). • According to the Goodyear Tire & Rubber Company, the top 12 American auto racing series where the company competes had 16.9 million attendees in 1997. • Bobby Rahal helped begin the Legends of Motorsports Racing Series in 2010 (owned by Historic Motor Sports): o Four events in Alabama, Watkins Glen NY, Montreal and Florida o So far, Legends of Motorsports has attracted Rolex, Lotus and Road & Track magazine as chief sponsors. Rahal said he's also had talks with the Discovery Channel about broadcasting races. "It's a major overlooked area. Ad agencies don't really get it," Rahal said. "The demographics of these guys are higher than if you sponsored a golf tournament. • Historic Motor Sports demographics (vintage car racing) o Participant demographics 90% of participants over 45 88% with income above $100,000 95% are homeowners 49% own two or more homes o Spectator demographics 67% of spectators between 35-64 (implies very few children compared to what would be expected based on population as a whole) 88% are homeowners
- 6. Response to Review Board’s follow-on questions Attachments and Supporting Information 07 December 2010 p. 6 74% are business owners • Sports Vintage Racing Association has 11 events on its 2010 calendar • American Le Mans Demographics (* Source: Nielsen Media Research - July 2006): o 51% are between the ages of 25 to 49 o 48% earn more than $90,000 per year o 13% have a net worth of over $1 million o 22% have a net worth of over $500K • Monaco hosts a vintage race every other year before its Formula One race • Goodwood Festival of Speed in Great Britain hosted 130,000 people in 2009. • Biggest vintage race in the U.S. is The Monterey Historic Automobile Races. The 2009 event in California hosted 400 historic cars and 40,000 people. (iii) Estimates of potential incremental gaming revenue, not included in our conservative projections Included in the Appendix is an analysis by CBRE which concludes that if our proposed auto racing facility and Peninsula Gaming’s proposed equestrian facility had the same number of visitors (nominally 100,000 visits p.a.), a 34.3% premium in visitation gaming spending by auto racing visitors would result over equestrian visitors. This 34.3% premium does not quantify other economic activities such as hotel stays, retail, and food & beverage. Part of this premium reflects greater adult participation in auto racing v. equestrian events. Casino customer spending and demographic research is also included from Lang Research, Canada, in support of the CBRE analysis. Peninsula Gaming estimated 95,000 visitors (attendee days) for their equestrian center. Global Gaming has indicated 300 to 500 attendees per week and several major events per year from IRL (Letter of Intent in existence) or GrandAm. These major events typically have up to 50,000 attendees. Accordingly, the analysis shown above was performed assuming a similar number of attendees of approximately 100,000 a year. Wells Gaming Research concluded that incremental gaming revenue attributable to Peninsula Gaming’s equestrian center was $2.45m p.a. (in 2014) and 33,000 gaming visitors. At the same time, Wells Gaming Research concluded the WinSpirit Casino travel plaza alone would drive $5m (in 2014) incremental gaming revenue or 100,000 gaming visitors. The Review Board has expressed some concern over how to evaluate the auto racing facility given our Management Contract does not require its opening before Year-5. In contrast, the Peninsula equestrian center is proposed to be open in probably Year-2. We would point out the following two key points: 1) Our travel plaza would open in a timeframe closely following that of the equestrian center; it drives more incremental gaming revenue, and
- 7. Response to Review Board’s follow-on questions Attachments and Supporting Information 07 December 2010 p. 7 2) We can accelerate the development of the auto racing facility: our ability and history to accelerate development is answered in Question (e) immediately below. Again, we wish to point out that we did not include any incremental gaming revenue or other amenity revenues for the auto racing facility in our conservative projections, because of our belief and focus on the quality of the core destination facility (260,000 square feet permanent, entertainment, full restaurants, etc.) and the 80/ 20 rule of where revenue is derived from. We also note that our initial investment is placed firmly in the quality of the destination as our infrastructure and land investment is approximately $5m v. Peninsula Gaming’s infrastructure and land costs estimated at $45m. e. Question: Support other instances of building out ancillary facilities according to market forces In support of our statement to the Review Board that we have a proven track record in accelerating development plans, we summarize below the history of expansion of WinStar World Casino, Riverwind Casino, and Remington Park. As you can see, the timeline for expansion have been aggressive and continuous in responding to the market. WinStar World Casino WinStar opened in late 2002 with 243 electronic games and a 400-seat capacity Bingo Hall. In October 2003, two distinct gaming areas, themed Circus and Carnival, were opened with an additional 1,000 electronic gaming machines bringing the total to 1,250, a buffet restaurant, a steak house and a casual dining snack bar. In 2004, an additional 250 games were added bringing the total to 1,500 machines. In early 2004, ground was broken to expand WinStar Casino with the addition of "The Palace" gaming plaza. The Palace expansion opened to the public in May 2005, adding an Italian restaurant and 740 more gaming units (making capacity 2,240 machines). In late 2004, in response to the expanding infrastructure and community needs, a dedicated waste water treatment plant was built and opened by the Nation. While that that expansion was underway, the Nation built and opened an adjacent 100-room hotel and a 1,500-seat entertainment center. An 18-hole, championship golf course featuring a world class clubhouse facility was officially opened in March 2007. Construction of nine additional holes was completed this Fall and will open to the public in March 2011.
- 8. Response to Review Board’s follow-on questions Attachments and Supporting Information 07 December 2010 p. 8 In late 2007, construction commenced on the current WinStar World Casino complex themed on great cities of the world, to increase the gaming capacity to 280,000 square feet, including 6,026 total slots, 70 table games (Blackjack, Pai-Gow, Ultimate Texas Hold ‘em), 46 Poker tables, and an off-track betting center. The expansion featured a new, 3,000-seat, state of the art entertainment and event center. This aggressive development, which resulted in WinStar World Casino becoming the third largest casino in the world in gaming units and square footage, was phased in, opening sections to the public between October 2008 and December 2009, including six additional restaurants and a four-star, 11-story, 395- room and suites hotel. • A one million gallon water tower to provide for the ever expanding complex went online in October 2009. • A dedicated Emergency Services building opened in 2009. • A 150-space RV Park, with capacity for an additional 150 spaces, opened in March 2010. • Ground was broken in November 2010 for a 1,400 car parking garage that is expected to open in September 2011. • Future plans call for two additional restaurants, a night club, and a 6,000 sq. ft. VIP, high-limit gaming center, and a dedicated child care facilities for employees. • The Nation has completed negotiations with the federal government for an additional exit (at mile marker three on I-35) north of the WinStar complex that is expected to open in 2013. Riverwind Casino The award-winning Riverwind Casino opened at Exit 108 on I-35 in Norman, Oklahoma, in July 2006. Riverwind Casino is consistently voted the best casino and entertainment venue in the competitive Oklahoma City market. Riverwind opened featuring 2,025 electronic games, blackjack, a poker room, a 1,500-seat "Showplace Theater" and event center, an off track betting parlor, a buffet restaurant, a steakhouse, and a food court. That facility was constructed from a bare piece of land, with no infrastructure, in just 11 months. In 2007, games were expanded 2,130, an increase of 105 games. In 2008, games were expanded to 2,250, an increase of 120 games. In 2009, games were expanded to 2,325, an increase of 75 games. In April 2009, a new 100-room three-plus stars Riverwind Hotel opened. In 2010, games were expanded to 2,488, an increase of 163 games. In June 2010, a Sky Bridge between the Casino and Hotel was completed.
- 9. Response to Review Board’s follow-on questions Attachments and Supporting Information 07 December 2010 p. 9 Remington Park As the Review Board knows, we acquired Remington Park located just north of Oklahoma City center on January 1, 2010. This facility is regulated by the state and has 750 slots as well as race track, convention and food and beverage amenities. When we acquired Remington Park, we had set a plan to improve games and amenities of 36 months. These improvements were achieved in the first six months of operations. The performance of this facility under our management has been highly publicized and it is one of the only tracks in the country showing growth and adding races. This facility has an effective tax rate of 50% after state tax, payments to the breeds and other payments to the State. We acquired this facility for $80.25m through the bankruptcy process. The Review Board is also aware that we have within 25 -30 minutes of this facility, Riverwind Casino, Goldsby Gaming and New Castle Gaming tribal facilities that are subject to a 6% tax rate, with some 4700 games collectively. Remington had 700 slots when we acquired it and under the law was entitled to 750 games on January 1, 2010. We added the additional 50 games and worked with the Oklahoma Horse Racing Commission to have these up and running by 1 minute after we took ownership, or one minute past midnight on December 31, 2009/ January 1, 2010. In the first four months of ownership we replaced or upgraded 300 of the original 700 slot machines. The effect of this along with marketing and improvements to physical facilities has been to drive up win per unit or per machine by 15% and coin in volume in excess of 30%. Attendance has increased and export of our signal has increased more than 40%. We have added a Henry Hudson’s Pub and Grill, restored the executive suites, completely restored the exterior of the 20-year old building, created a new outside plaza area with paving, landscaping, etc. in the first 6 months of ownership. These investments total some $15m. We highlight this as it clearly demonstrates that if our intention was to focus on the lower taxed tribal facilities then clearly we would not have made these investments at all and we would certainly have not made and completed them in a time frame of 4 months for all games and 6 months for all physical improvements. Below is a table showing a summary of machine increases at four properties, continually being expanded in response to market forces:
- 10. Response to Review Board’s follow-on questions Attachments and Supporting Information 07 December 2010 p. 10 Riverwind Yea r No. of Sl ots Sl ot i ncrea s e 2006 2,025 2007 2,130 105 2008 2,250 120 2009 2,325 75 2010 2,488 163 Total 5 year slot increase 463 Goldsby 2006 160 2007 200 40 2008 225 25 2010 299 74 Total 5 year slot increase 139 Newcastle 2006 700 2007 1,200 500 2009 1,275 75 2010 1,892 617 Total 5 year slot increase 1,192 WinStar 2002 243 2003 1,250 1,007 2004 1,500 250 2006 2,240 740 2010 6,026 3,786 Total 5 year slot increase 5,783 As you can see, our approach to business is to maximize the performance of each business operation. f. Question: KDOT/ ODOT traffic numbers for I-35 We have provided as an attachment the Traffic Volume Map for the major roadways in the vicinity of Exit 19, including I-35, Highway 160, and Highway 81. We would note that we propose using a traffic volume count near the state line to give us an estimate that would include traffic leaving and entering the state rather than immediately adjacent to Exit 19 to eliminate local traffic (including commuters) that would inflate the total traffic but not add to the capture rate of traffic passing through the area.
- 11. Response to Review Board’s follow-on questions Attachments and Supporting Information 07 December 2010 p. 11 We also note that Exit 19 has the benefit of traffic from two other US-highways which intersect in the city of Wellington. We believe placement of the travel plaza at a location that includes three major highways is a significant benefit to the State in regards to traffic capture versus Exit 33. If Peninsula Gaming were forced to use Site B this will eliminate any potential for a travel plaza at Site B. Cummings notes in footnote 7, on page 16 of 90 in his report, that a portion of his calculated gaming revenue differential between Peninsula Gaming’s Site A and Site B is the loss of traffic capture. It is helpful to understand that truck drivers are required to take federally mandated breaks. This mandate is one of the reason you see trucks parked at the KTA rest areas every night. To get a sense of the number of trucks that are currently stopping in the area for these breaks, we did a head count of trucks in rest areas within 50 miles of Exit 19 in the early morning hours (approximately 3:00 am). That net count exceeded 300 trucks, which stopped overnight in the area, roughly 7.5% of the total daily truck traffic on I-35 at the Kansas border. Trucks can only stop where they have the capacity and the amenities to do so. It is important that there are many more trucks parked in the vicinity of Exit 19 that we have not counted such as those parked in non-KTA rest areas, e.g. Exit 4 on I-35. It is also important to note that current capacity is limited and the travel plaza is a value-added strategy to the State of Kansas. To put that in perspective, using our projected daily win per patron, the 300 trucks that are already stopping in the immediate area would be the equivalent of $7 million in gaming revenues.
- 12. Response to Review Board’s follow-on questions Attachments and Supporting Information 07 December 2010 p. 12 g. Question: Schematics for Travel Plaza The schematic below shows the Travel Plaza site relative to the casino site. The plan actually includes truck parking for up to 180 trucks. We indicated in our Review Board presentation that the Travel Plaza would include at least 100-truck parking capacity. I-35 is an important economic engine for development in Kansas and Oklahoma. Literally, millions of dollars of economic opportunity drives up and down the corridor. Using traffic data from the southern border of Kansas, approximately 14,000 vehicles a day enter or leave Kansas via I-35. That means approximately 8 million people in cars and trucks drive by Exit 19 every year. That population base is larger than Dallas-Fort Worth. It is also a population base that the gravity model will never successfully predict. Development of full service travel facilities that offer a wide range of food, competitive fuel prices, and other comfort amenities is a tool that has generated millions of dollars in gaming revenues for the Chickasaw Nation. The strategy does involve robust services for travelers. It also involves deployment of gaming machines the match the market place, including truckers – who we like to call the “high rollers” of the highway.
- 13. Response to Review Board’s follow-on questions Attachments and Supporting Information 07 December 2010 p. 13 Our Travel Plaza development is planned for Year-3 to allow time for the main facility to be fully up and operational and traffic patterns established. We have an agreement with the Kansas Turnpike Authority that we would not open the travel plaza until after our direct turnpike access is fully implemented and operational. The key criteria for success of the associated gaming amenity are that it provides a sense of exclusivity and a sense of easy access. In collaboration with CBRE, and use of data specific to our travel plaza operations, we project the total traffic capture gaming revenues at the facility will exceed $10 million. We advised the Review Board that we counted over 300 trucks parked nightly near our proposed location, stopping under federally mandated rest requirements. The truck drivers will stop where they have the capacity and the best amenities. This count represents roughly 7.5% of the total daily truck traffic on I-35 alone (total count is 4,060 trucks daily, per our response to question (f)) and even excludes truck traffic on Highways 160 and 81. Again, we provided the traffic data from K-DOT and KTA in our response to question (f). To put that in perspective, using our projected daily win per patron, the 300 trucks that are already stopping in the immediate area would be the equivalent of $7 million in gaming revenues. In addition, for each 100 cars representing 150 patrons (1.5 passengers per car) would account for an additional $3.5m in gaming revenue in its own right. As casual travelers stop at our facility, we also expect to add them to our players club data base and will used that data to build a customer base that extends beyond traffic intercept. Cummings appeared to assign a travel plaza adjustment for incremental gaming revenue of $2.9m and 20,000 visitors. In contrast, Wells Gaming Research assigned $5m in incremental gaming revenue and 100,000 visitors. In 2008, Cummings assigned $5.9m in a traffic intercept estimate called “Frontage Traffic” to Marvel Gaming, Penn Gaming, and the generic casino at Exit 19. Neither of these developments had direct access proposed to I-35 at the time these projections were made. This appears to be a change in Cummings’ methodology since 2008 which undervalues gaming revenues for our travel plaza.
- 14. Response to Review Board’s follow-on questions Attachments and Supporting Information 07 December 2010 p. 14 h. Ownership Organization Chart and Structure Global Gaming KS, LLC (GG-KS or the Company) included in its original application a disclosure that the company was contemplating the involvement of an investor which could be incorporated in the project as a preferred lender with the right of converting the debt to an equity position (subject to the approval of the Lottery and appropriate background approvals) or a direct equity position in the Company. In the past several weeks, the Company, and the equity investor, came to the conclusion that the best approach was to take the common equity route rather than through a preferred loan arrangement. After research by legal counsel, it was determined that under the Kansas Expanded Lottery Act (KELA), the Company had an obligation to notify the Lottery and Kansas Racing and Gaming Commission (KRGC) of this intent. As such, GG-KS provided the KRCG with background materials on that investor and discussed procedures for amending the application to make those changes. We have submitted an amended operating agreement for GG-KS for review of the Lottery’s Counsel. We are told Lottery’s Counsel does not object to the contract provisions as provided. Mr. Fulton is a passive investor in the development and does not have any day to day management role in the Casino. As shown in the Revised Ownership Structure, Mr. Fulton will own a 50% equity interest in GG-KS.
- 15. Response to Review Board’s follow-on questions Attachments and Supporting Information 07 December 2010 p. 15 As one can see from Mr. Fulton’s background, included below and as published by the International Gaming Institute in Las Vegas, NV, Mr. Fulton has considerable experience and expertise in the gaming industry. Stan Fulton was a pioneer in the video slot machine industry. Products that he was responsible for include: the construction of the first multi-line video slot machine, the first video full color poker machines, and the use of the first credit meters in the State of Nevada While at Anchor Gaming, Fulton helped build the first slot machines using a wheel as a bonus feature, which led to a joint venture with IGT on the Wheel of Fortune machine. Wheel of Fortune was the most successful slot machine to hit the floor. When he left Anchor Gaming, Mr. Fulton acquired Sunland Park Racetrack and Casino from Anchor Gaming and over the years has tripled that racino's (race track with slot machines) business. His philanthropy includes major gifts to the University of Nevada at Las Vegas, New Mexico State University, Hope International University in Fullerton, California, Randolph-Macon Academy in Front Royal, Virginia; and the City of Sunland Park, New Mexico. "If you want to be successful, and I think you probably want to be successful, there are many things that are necessary to achieve success. One is dedication - you have to put forth the extra effort. Number two is common sense; there is a difference between brilliance and common sense. A good example of this took place in 1976 when we had a heat problem in the first multi-line video slot machine. I was dedicated to solving the problem and worked through a Labor Day weekend. I used common sense - hot air rises - so I put a fan at the top of the slot machine and created an air flow channel so that the air being expelled flowed across the top of the PC boards. I'm not brilliant, but I did use common sense. Then again, when the general manager, who was an engineer, saw that I had solved the problem, he said that I was a master of hot air." – By Stan Fulton (as quoted from by the International Gaming Institute).
- 17. Response to Review Board’s follow-on questions Attachments and Supporting Information 07 December 2010 p. 17 Attachments and Other Supporting Information: 1) Facebook comments, October – November 2010 (approximately 30 days), from WinStar and Riverwind customers 2) CBRE Analysis of Auto Racing v. Equestrian Visits with Lang Research Supporting Information. 3) Traffic Volume Map of major roadways in the vicinity of Exit 19 off I-35, as provided by Traffic Engineers Wilson & Company. 4) “DISPROVING THE EXIT 33 MYTH: Exit 19 the Best Bet for Kansas”, 33-page report prepared with the assistance of CBRE.
- 18. Response to Review Board’s follow-on questions Attachments and Supporting Information 07 December 2010 p. 18 Attachments and Other Supporting Information: (b) Facebook comments, October – November 2010 (approximately 30 days), from WinStar and Riverwind customers
- 21. Gaming Spend Per Visitor - Auto Racing v. Equestrian visits (please see Lang Research: Interest in Casino Gambling Profile Report, attached) . If Both Had the Same # of Visitors, we'd conclude a 34.3% premium in visitation spending by Auto Racing visitor v. an Equestrian visitor Gaming Spend Per Visitor - Auto Racing v. Equestrian visits (please see Lang Research: Interest in Casino Gambling Profile Report, attached) If Both Had the Same # of Visitors, we'd conclude a 34.3% premium in visitation spending by Auto Racing visitor v. an Equestrian visitor Approach #1 - TAMS Survey for Gaming Participation Rates, Adult Ratio per Historic Motor Sports Series Auto Racing Equestrian Comment Number of Visitors 100,000 100,000 we do not have the projections used by both groups Auto racing attendance breakdown estimate based on Historic Motor Sports Series having 67% of spectators between 35-64; equestrian assumes children % Children 15.6% 28.5% attendees are representative of the population as a whole. % Adults 84.4% 71.5% # of Adults 84,420 71,454 Casino Participation While Vacationing Tourism Ministry of Canada, Interest in Casino Gambling Profile Report, 2000 represents the US adults surveyed. May be overstated for equestrian Enthusiasts 15.7% 15.7% attendees since many will be grooms, shoesmiths and care-givers Tourism Ministry of Canada, Interest in Casino Gambling Profile Report, 2000 represents the US adults surveyed. May be overstated for equestrian Moderate Interest 31.6% 31.6% attendees since many will be grooms, shoesmiths and care-givers Relative Participation Factor (1.0 would equal the same the same ratio as the US/Canadian survey population) Tourism Ministry of Canada, Interest in Casino Gambling Profile Report, 2000 found people that sought out auto racing were 23% more likely to be Casino Enthusiasts. Harrah's Survey 2003 also points to casino gamblers more likely Enthusiasts 1.23 1 to being auto racing spectators than non-spectators (14% to 13%). Tourism Ministry of Canada, Interest in Casino Gambling Profile Report, 2000 found people that sought out auto racing were 23% more likely to be Casino Enthusiasts. Harrah's Survey 2003 also points to casino gamblers more likely Moderate Interest 1.02 1 to being auto racing spectators than non-spectators (14% to 13%). Assumed Participation Rates of Groups Enthusiasts 90.0% 90.0% GGS assumption Moderate Interest 50.0% 50.0% GGS assumption Number of Gaming Visits Enthusiasts 14,672 10,096 Moderate Interest 13,605 11,290 Total 28,277 21,386 Win / Visit GGS assumption that enthusiasts will game more; conservative spend/visit Enthusiasts $70 $70 estimates as the length of the casino trip will be reduced by the main activity. Moderate Interest $50 $50 Total Win Enthusiasts $1,027,053 $706,750 Moderate Interest $680,260 $564,485 Total Win $1,707,313 $1,271,235 Win / Visitor (all event visitors) $17.07 $12.71 Premium: Auto Racing Visitor vs. Equestrian Visitor 34.3%
- 22. Page 1 Background An association of Canadian tourism ministries and organizations have collaborated to conduct two large scale surveys to assess the travel activities and motivators of pleasure travel among Canadians and Americans. This survey, known as the Travel Activities and Motivation Survey (TAMS), represents the comprehensive assessment of travel behavior and motivators, and provides a rich and authoritative database by which to develop marketing strategies and travel products to attract visitors to Canada and Ontario. A series of analyses are being conducted using the TAMS database to explore the travel patterns of the marketplace as well as the factors which motivate travel behavior. TAMS consisted of both a telephone survey and a self-completed mailback survey. The survey was conducted in Canada and the United States between September 27, 1999 and April 16, 2000. The telephone survey was completed by 28,397 individuals in the United States and by 18,385 individuals in Canada. Respondents were selected randomly within the household. People participating in the telephone survey who had travelled in the past two years or expressed interest in travel in the next two years were asked to complete a mailback questionnaire. Overall, 40,271 qualified for the mailback questionnaire. Of these 11,892 (29.4 %) returned usable questionnaires. The response rate was higher in Canada with 5,490 (35.2 %) returning the questionnaire while 6,405 (26.0 %) of the U.S. respondents returned the questionnaire. This current study examines interest in casino gambling while respondents are not travelling and while they are travelling. The database was used to identify sectors of the market that exhibit a moderate or high interest in casino gambling. This report provides the demographic profile, Canadian travel activities, Canadian travel intentions, vacation experiences sought during the past two years, vacation activities participated in during the past two years, media consumption habits, information sources consulted to plan brief and longer vacations, and impressions of Canada and Ontario relative to the interest shown in casino gambling. This report also provides an Overall Market Potential, identifying those segments that offer the best potential for marketing, advertising and promotional activities related to casino gambling. TAMS Travel Activities & TAMS: Interest in Casino Gambling Profile Report Motivation Survey
- 23. Page 2 Casino Gambling Interest Index Construction of the Index The TAMS Mailback Survey contained three items specifically associated with casino gambling that were used to construct an overall Casino Gambling Interest Index. These were: How often the respondent had visited casinos during the past two years while not travelling: “frequently”, “occasionally”, “rarely” or “not at all” Whether a casino gambling vacation experience had been sought during the past two years Whether the respondent had visited a casino and gambled while travelling in the past two years The responses to the first of these items (i.e,. the extent to which casinos had been visited during the past two years while not travelling) was converted into a four point scale where “Not at all” was set to “0”, “Rarely” was set to “1”, “Occasionally” was set to “2” and “Frequently” was set to “3”. The two variables, which asked whether or not the individual visited a casino to gamble during the past two years while travelling, were converted into binary variables where “0” was “Did not visit a casino to gamble” and “1” was “Did visit a casino to gamble”. The three items were summed up to produce an overall score ranging from “0” to “5”. This score was reduced to three levels as follows: A score of “0” was set to “Low Interest”, a score between “1” and “3” was set to “Moderate Interest” and a score between “4” and “5” was set to “Enthusiast”. This scoring scheme meant that in order to qualify as a Casino Gambling Enthusiast, it was necessary for those who “frequently visited a casino while not travelling” to have sought out a casino vacation experience or to have visited a casino and gambled while on a trip during the past two years, and those who “occasionally visit a casino while not travelling” to have both sought out a casino gambling vacation experience as well as visited a casino to gamble at least once while on a trip during the past two years. Those who never visited a casino were considered to have a Low Interest while all others were classified as having a Moderate Interest in casino gambling. TAMS Travel Activities & TAMS: Interest in Casino Gambling Profile Report Motivation Survey
- 24. Page 3 Interest in Casino Gambling Canada versus United States Based on Visiting a Gambling Casino While Travelling and Not Travelling Base: Percent of Population(18 Plus) Who Either Travelled in Last Two Years or Intends to Travel in Next Two Years 100% 6.3% 90% 15.7% Americans were much more likely to have Population: 1,238,000 visited a gambling casino while travelling, Unweighted Sample Size = 399 and not travelling. Thus, Americans were Population: 26,880,000 80% Unweighted Sample Size = 1,080 31.9% 149 % more likely to be classified as Casino Gambling Enthusiasts than 70% Population: 6,263,000 Canadians. Clearly, casino gambling is a 31.6% Unweighted Sample Size = 1,807 more prevalent activity in the United 60% Population: 54,127,000 States than in Canada. Unweighted Sample Size = 2,139 50% 40% 30% 61.8% 52.7% Population: 12,118,000 20% Unweighted Sample Size = 3,251 Enthusiast Population: 90,277,000 Unweighted Sample Size = 3,159 Moderate Interest 10% Low Interest 0% United States Canada TAMS Travel Activities & TAMS: Interest in Casino Gambling Profile Report Motivation Survey
- 25. Interest in Casino Gambling Page 4 Canada: By Province Based on Visiting a Gambling Casino While Travelling and Not Travelling Base: Percent of Population (18 Plus) Who Either Travelled in Last Two Years or Intends to Travel in Next Two Years Province of Residence Newfoundland 17% Among Canadians, visiting a gambling casino (while travelling and not travelling) was more Prince Edward Island 11% Small Sample Warning for P.E.I. n=11 prevalent in Ontario and Saskatchewan compared to other provinces. There was also above average interest in casino gambling in Nova Scotia 5% 32% Quebec and Nova Scotia. Casino Gambling Enthusiasts were most frequently found in New Brunswick 21% Ontario. Interest in casino gambling tended to be lower in New Brunswick, Newfoundland Quebec 4% 35% and P.E.I. ( based on a small sample). Ontario 9% 36% Manitoba 6% 27% Saskatchewan 6% 37% Enthusiast Alberta 7% 26% Moderate Interest British Columbia 6% 24% 0% 5% 10% 15% 20% 25% 30% 35% 40% 45% 50% TAMS Travel Activities & TAMS: Interest in Casino Gambling Profile Report Motivation Survey
- 26. Interest in Casino Gambling Page 5 United States: By Region Based on Visiting a Gambling Casino While Travelling and Not Travelling Base: Percent of Population (18 Plus) Who Either Travelled in Last Two Years or Intends to Travel in Next Two Years Region of Residence 12% 28% Interest in casino gambling was somewhat South Atlantic Florida, Georgia, North higher the West North Central region of Carolina, South Carolina the United Sates. On the other hand, the East South Central 18% 23% level of interest in casino gambling was Alabama, Mississippi, Tennessee, Kentucky somewhat lower in East South Central and West South Central 16% 33% South Atlantic regions of the country Texas, Oklahoma, relative to other regions of the U.S. Arkansas, Louisiana Mountain 19% 33% New Mexico, Arizona, Utah, Colorado, Nevada, Idaho, Wyoming, Montana Pacific /Hawaii 19% 33% California, Hawaii, Oregon, Washington, Alaska West North Central 14% 42% Kansas, Nebraska, South Dakota, Missouri, Iowa, Minnesota East North Central 17% 30% Wisconsin, Illinois, Michigan, Ohio, Indiana Middle Atlantic 13% 33% Enthusiast Pennsylvania, New York, New Jersey Moderate Interest New England 11% 34% Maine, Connecticut, Massachusetts, Rhode Island, Vermont 0% 10% 20% 30% 40% 50% 60% TAMS Travel Activities & TAMS: Interest in Casino Gambling Profile Report Motivation Survey
- 27. Page 6 Interest in Casino Gambling Canada: By Demographics Based on Visiting a Gambling Casino While Travelling and Not Travelling Base: Percent of Population (18 Plus) Who Either Travelled in Last Two Years or Intends to Travel in Next Two Years Male 6% 32% In Canada, young couples and mature Female 7% 32% couples were the most likely to exhibit an Young Singles 6% 35% interest in casino gambling. This interest wanes among families, and especially Young Couples 6% 37% young families. The incidence of Casino Young Families 4% 30% Gambling Enthusiasts declined as the level Technical Note See Appendix One for Mature Families 7% 27% of education increased, but increased as a description of each of the household income increased. This the life cycle stages. Mature Couples 9% 34% indicates that vacation packages with a Mature Singles 7% 30% casino gambling theme should be targeted Senior Couples 7% 27% at couples with higher household incomes but less formal education. Senior Singles 7% 33% High School/Trade School 8% 32% University/College 5% 33% Advanced University Degree 3% 25% Enthusiast Undefined 6% 33% Moderate Interest Less than $40K 5% 29% $40K to $80K 7% 32% $80K Plus 7% 38% 0% 5% 10% 15% 20% 25% 30% 35% 40% 45% 50% TAMS Travel Activities & TAMS: Interest in Casino Gambling Profile Report Motivation Survey
- 28. Page 7 Interest in Casino Gambling United States: By Demographics Based on Visiting a Gambling Casino While Travelling and Not Travelling Base: Percent of Population (18 Plus) Who Either Travelled in Last Two Years or Intends to Travel in Next Two Years Male 17% 33% The demographic profile of those Female 14% 30% interested in casino gambling in the United Young Singles 15% 34% States was somewhat different than that observed in Canada. For example, Young Couples 17% 39% American males were more likely than Young Families 12% 32% females to exhibit an interest in casino Technical Note See Appendix One for Mature Families 14% 31% gambling. As well, those with advanced a description of each of degrees exhibited a greater interest in the life cycle stages. Mature Couples 21% 31% casino gambling in the United States than Mature Singles 17% 32% in Canada. However, similar to Canada, Senior Couples 15% 27% the level of interest in casino gambling tended to increase as a function of Senior Singles 14% 22% household income and was highest among High School/Trade School 16% 28% young couples and mature couples. Overall, the primary U.S. target markets University/College 16% 34% for casino gambling are affluent young Advanced University Degree 12% 34% couples, mature singles & mature couples. Undefined 14% 30% Less than $40K 14% 26% Enthusiast $40K to $80K 16% 35% Moderate Interest $80K Plus 19% 38% 0% 10% 20% 30% 40% 50% 60% TAMS Travel Activities & TAMS: Interest in Casino Gambling Profile Report Motivation Survey
- 29. Page 8 Interest in Casino Gambling Canada: By Market Segment Based on Visiting a Gambling Casino While Travelling and Not Travelling Base: Percent of Population(18 Plus) Who Either Travelled in Last Two Years or Intends to Travel in Next Two Years Affluent Young Singles 12% 35% In terms of the market segments (see technical notes) in Canada, interest in casino gambling Affluent Young Couples 5% 43% was highest among Affluent Young Singles, Affluent Young Couples, Affluent Mature Young Mainstream Market 4% 31% Singles, Mainstream Mature Couples, Affluent Mature and Senior Couples and Senior Singles. Affluent Families 3% 32% Affluent Young Singles and Mainstream Mainstream Young Families 4% 29% Mature Couples were especially likely to be Casino Gambling Enthusiasts. In general, the Mainstream Mature Families 6% 29% level of interest shown in casino gambling was lower within the family segments. Affluent Mature Singles 6% 37% Mainstream Mature Couples 11% 35% Enthusiast Mainstream Mature Singles 8% 28% Moderate Interest Affluent Mature & Senior Couples 5% 36% Technical Note Mainstream Senior Couples 7% 27% The market segments used in this analysis have been derived using the Ontario Tourism Marketing Partnership (OTMP) Affluent & Mainstream Senior Singles 7% 33% tracking database. See Appendix Two for a description of each of these segments. 0% 10% 20% 30% 40% 50% 60% 70% 80% 90% TAMS Travel Activities & TAMS: Interest in Casino Gambling Profile Report Motivation Survey
- 30. Page 9 Interest in Casino Gambling United States: By Market Segment Based on Visiting a Gambling Casino While Travelling and Not Travelling Base: Percent of Population (18 Plus) Who Either Travelled in Last Two Years or Intends to Travel in Next Two Years Affluent Young Singles 17% 35% A different pattern was observed in the United States with all segments having a higher Affluent Young Couples 19% 42% incidence of Casino Gambling Enthusiasts. In general, the five affluent segments exhibit a Young Mainstream Market 16% 35% greater interest in casino gambling than the 16% mainstream segments. There is also a high Affluent Families 41% interest in casino gambling among Mainstream Mainstream Young Families 11% 29% Mature Couples. These represent prime markets for casino gambling promotional activity Mainstream Mature Families 15% 32% directed at the United States. Affluent Mature Singles 17% 40% Enthusiast Mainstream Mature Couples 22% 31% Moderate Interest Mainstream Mature Singles 17% 26% Affluent Mature & Senior Couples 18% 37% Technical Note The market segments used in this analysis 15% have been derived using the OTMP Mainstream Senior Couples 26% tracking database. See Appendix Two for a description of each of these segments. Affluent & Mainstream Senior Singles 15% 22% 0% 10% 20% 30% 40% 50% 60% 70% TAMS Travel Activities & TAMS: Interest in Casino Gambling Profile Report Motivation Survey
- 31. Page 10 Interest in Casino Gambling Based on Visits to Casinos While Travelling & Not Travelling Canada vs. U.S.: By Trips In Canada Last Two Years Base: Percent of Population (18 Plus) Who Either Travelled in Last Two Years or Intends to Travel in Next Two Years In Canada, those who travelled domestically No Domestic were slightly more likely to exhibit an interest in 5% 25% Trips casino gambling than those who did not travel domestically. However, Americans who took a Canada trip to Canada within the last two years were 69 % more likely to be Casino Gambling Enthusiasts than those who did not take a trip to Took Domestic 7% 35% Canada. This difference may partially be Trip attributable to the higher level of affluence of Casino Gambling Enthusiasts, as affluent households were more likely to have taken a trip to Canada within the last two years. No Trips from 14% 31% U.S. to Canada United States Enthusiast Took Trip from U.S. to Canada 24% 35% Moderate Interest 0% 10% 20% 30% 40% 50% 60% 70% TAMS Travel Activities & TAMS: Interest in Casino Gambling Profile Report Motivation Survey
- 32. Page 11 Interest in Casino Gambling Based on Visits to Casinos While Travelling & Not Travelling Canada: Interest By Province Travelled To Base: Percent of Population (18 Plus) Who Took a Trip to Each Province During the Last Two Years Destination Province Newfoundland/ Labrador 7% 30% In Canada, there was a weak association between interest in Prince Edward Island 6% 37% casino gambling and the provinces visited during the past two years. Nova Scotia 5% 34% However, those who exhibited interest in casino gambling were New Brunswick 5% 35% somewhat more likely to have visited Ontario or Quebec than other Quebec 6% 37% provinces during the past two years. Ontario 8% 38% Manitoba 7% 34% Saskatchewan 7% 36% Alberta 7% 32% Enthusiast British Columbia 7% 32% Moderate Interest Yukon 36% 0% 5% 10% 15% 20% 25% 30% 35% 40% 45% 50% TAMS Travel Activities & TAMS: Interest in Casino Gambling Profile Report Motivation Survey
- 33. Page 12 Interest in Casino Gambling Based on Visits to Casinos While Travelling & Not Travelling United States: Interest By Province Travelled To Base: Percent of Population (18 Plus) Who Took a Trip to Each Province During the Last Two Years Destination Province Newfoundland/ Labrador 28% 41% There was only a weak association between the level of interest exhibited Prince Edward Island 24% 36% in casino gambling by Americans, and the Canadian province visited during Nova Scotia 19% 42% the past two years. However, those with an interest in casino gambling New Brunswick 13% 44% were slightly more likely to have visited Newfoundland/Labrador during Quebec 25% 39% the past two years. This result reflects the increased affluence of visitors from Ontario 27% 35% the U.S. to Newfoundland/Labrador rather than indicating that this Manitoba 20% 38% destination is of particular interest to casino gamblers. Saskatchewan 21% 42% Alberta 21% 41% Enthusiast British Columbia 21% 38% Moderate Interest Yukon 15% 40% 0% 10% 20% 30% 40% 50% 60% 70% 80% TAMS Travel Activities & TAMS: Interest in Casino Gambling Profile Report Motivation Survey
- 34. Page 13 Interest in Casino Gambling Based on Visits to a Casino While Travelling & Not Travelling Intentions to Travel to Canada in Next Two Years Interest in Casino Gambling By Intentions to Travel in Canada During Next Two Years Base: Percent of Population (18 Plus) Who Either Travelled in Last Two Years or Intends to Travel in Next Two Years Enthusiast 69% 11% Among Canadians, the likelihood of taking a trip within Canada during the next two years is unrelated to the level Canada of interest in casino gambling. There Moderate 71% 10% is, however, a modest association Interest between interest in casino gambling and travelling to Canada among Americans. This likely reflects the Low Interest 67% 11% fact that travellers to Canada from the United States are more affluent (and hence more likely to be interested in casino gambling) rather than the fact Enthusiast 21% 23% United that Canada is an especially attractive destination for people interested in States Very likely casino gambling. Moderate 17% 24% Interest Fairly likely Low Interest 16% 20% 0% 20% 40% 60% 80% 100% TAMS Travel Activities & TAMS: Interest in Casino Gambling Profile Report Motivation Survey
- 35. Page 14 General Vacation Experiences Sought During Pleasure Travel in the Past Two Years By Interest in Casino Gambling Based on Visits to Casinos While Travelling & Not Travelling Base: Total Population (18 Plus) Who Took a Trip in the Last Two Years: Canada & U.S. (Mailback Survey) Casino Gambling Enthusiasts were more likely to Exploration have sought out vacation experiences associated with personal indulgence (e.g., to experience the good life, visiting a casino, experiencing city life such as nightlife). They were somewhat more likely to have Personal pursued sports and learning vacation experiences Indulgence (e.g., to participate in a hobby or sport). Advertising and promotional materials designed to promote casino gambling-related tourism should emphasize Romance & the opportunities for entertainment and personal Relaxation indulgence offered by the destination. Technical Note This analysis is based on a factor analysis of the vacation experiences sought Sports & during the past two years. See Appendix Three for a description of the Learning individual items associated with each of these factor scores. The factor scores Enthusiast for each dimension are determined by the weighted sum of all items. The weight for each item is determined by how much the item is correlated with Moderate Interest the overall factor score. Factor scores are standardized with an average of “0” and a standard deviation of “1”. A value of “0” means that the travellers in the group exhibited an average tendency to pursue a given vacation Socializing Low Interest experience. Progressively more positive values indicate that the travellers in the group were progressively more likely to have pursued the vacation experience. Progressively more negative values indicate that the travellers within the group were progressively less likely to have pursued the vacation experience. -0.60 -0.40 -0.20 0.00 0.20 0.40 0.60 0.80 1.00 TAMS Travel Activities & TAMS: Interest in Casino Gambling Profile Report Motivation Survey
- 36. Page 15 Outdoor Activities Sought During Pleasure Travel in the Past Two Years By Interest in Casino Gambling Based on Visits to Casinos While Travelling & Not Travelling Base: Total Population (18 Plus) Who Took a Trip in the Last Two Years: Canada & U.S. (Mailback Survey) Team Sports Those with an interest in casino gambling tended Natural Sightseeing to be more active in most outdoor activities than Swimming & Sunbathing those who were not interested. This was Golfing especially apparent among Casino Gambling Enthusiasts, who tended to be more affluent and Hunting hence more likely to pursue outdoor activities Canoeing, Kayaking, Hiking while travelling. Casino Gambling Enthusiasts Fishing were especially likely to be interested in fishing and golfing. Combining these activities in casino Motorcycling gambling tourism packages may be especially Extreme Sports effective, particularly for affluent travellers. Fitness Skiing Technical Note Snowmobiling This analysis is based on a factor analysis of the outdoor vacation activities sought during the past two years. See Appendix Four for a description of the Biking individual items associated with each of these factor scores. The factor scores for each dimension is determined by the weighted sum of all items Skating determined by how much any given item is correlated with the overall factor Enthusiast score. Factor scores are standardized with an average of “0” and a standard Extreme Winter Sports deviation of “1”. A value of “0” means that the travellers in the group Moderate Interest exhibited an average tendency to pursue a given vacation experience. Sailing, Windsurfing & Scuba Progressively more positive values indicate that the travellers in the group Low Interest were progressively more likely to have pursued the vacation experience. Natural Phenomena Progressively more negative values indicate that the travellers within the group were progressively less likely to have pursued the vacation experience. -0.40 -0.30 -0.20 -0.10 0.00 0.10 0.20 0.30 0.40 TAMS Travel Activities & TAMS: Interest in Casino Gambling Profile Report Motivation Survey
- 37. Page 16 Cultural and Entertainment Activities Sought During Pleasure Travel in the Past Two Years By Interest in Casino Gambling Based on Visits to Casinos While Travelling & Not Travelling Base: Total Population (18 Plus) Who Took a Trip in the Last Two Years: Canada & U.S. (Mailback Survey) Shopping and dining As would be expected, Casino Gambling Museums, art, historical sites Enthusiast Enthusiasts were much more likely to have visited a Moderate Interest casino or a racetrack than those with a moderate or High arts Low Interest low interest in casino gambling (Note: Some of Theme parks these items were used in the construction of the scale). Enthusiasts were also more likely to have Professional sports attended an auto racing event or rodeo, a Zoos, aquariums, planetariums professional sports event, participated in shopping/dining or visited a theme park. Combining Agricultural and local fairs opportunities to gamble together with sports events Concerts, carnivals and festivals or a shopping/dining experience may be particularly appealing to Casino Gambling Enthusiasts. Aboriginal cultural experiences Technical Note Gardens and natural attractions This analysis is based on a factor analysis of the culture and entertainment vacation activities sought during the past two years. See Appendix Five for a Cultural festivals description of the individual items associated with each of these factor scores. The factor scores for each dimension is determined by the weighted sum of International sporting events all items determined by how much any given item is correlated with the overall factor score. Factor scores are standardized with an average of “0” Casino gambling and horse racing and a standard deviation of “1”. A value of “0” means that the travellers in the group exhibited an average tendency to pursue a given vacation experience. Progressively more positive values indicate that the travellers in Rodeos and auto racing the group were progressively more likely to have pursued the vacation experience. Progressively more negative values indicate that the travellers French Canadian cultural experiences within the group were progressively less likely to have pursued the vacation experience. -0.60 -0.40 -0.20 0.00 0.20 0.40 0.60 0.80 1.00 TAMS Travel Activities & TAMS: Interest in Casino Gambling Profile Report Motivation Survey