
Recomendados
Recomendados
Mais conteúdo relacionado
Mais procurados
Mais procurados (17)
Destaque
Semelhante a Why has D.C. multifamily been so hot?
Semelhante a Why has D.C. multifamily been so hot? (6)
Mais de kottmeier
Mais de kottmeier (10)
Why has D.C. multifamily been so hot?
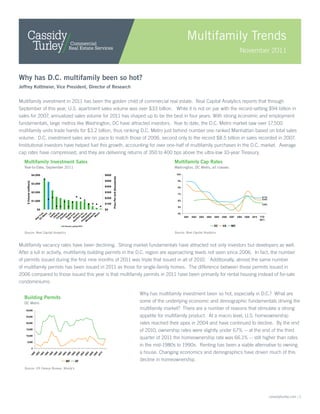
- 1. Multifamily Trends November 2011 Why has D.C. multifamily been so hot? Jeffrey Kottmeier, Vice President, Director of Research Multifamily investment in 2011 has been the golden child of commercial real estate. Real Capital Analytics reports that through September of this year, U.S. apartment sales volume was over $33 billion. While it is not on par with the record-setting $94 billion in sales for 2007, annualized sales volume for 2011 has shaped up to be the best in four years. With strong economic and employment fundamentals, large metros like Washington, DC have attracted investors. Year to date, the D.C. Metro market saw over 17,500 multifamily units trade hands for $3.2 billion, thus ranking D.C. Metro just behind number one ranked Manhattan based on total sales volume. D.C. investment sales are on pace to match those of 2006, second only to the record $8.5 billion in sales recorded in 2007. Institutional investors have helped fuel this growth, accounting for over one-half of multifamily purchases in the D.C. market. Average cap rates have compressed, and they are delivering returns of 350 to 400 bps above the ultra-low 10-year Treasury. Multifamily Investment Sales Multifamily Cap Rates Year-to-Date, September 2011 Washington, DC Metro, all classes $4,000 $600 10% Price Per Unit (thousands) $500 9% $ Volume (millions) $3,000 $400 8% $2,000 $300 7% $200 6.1% 6.4% $1,000 6% $100 5.6% 5% $0 $0 4% hi ta i M k e ap ia D A A las ro M is er n P De NJ N Bo ran ou o M d e er S on m C r an tl th to H cag L C n ol ne h D Yo et la v ia S eat st al tla in lp 2001 2002 2003 2004 2005 2006 2007 2008 2009 2010 YTD or s hi n F n ew 2011 N $ Volume Avg PPU DC VA MD Source: Real Capital Analytics Source: Real Capital Analytics Multifamily vacancy rates have been declining. Strong market fundamentals have attracted not only investors but developers as well. After a lull in activity, multifamily building permits in the D.C. region are approaching levels not seen since 2006. In fact, the number of permits issued during the first nine months of 2011 was triple that issued in all of 2010. Additionally, almost the same number of multifamily permits has been issued in 2011 as those for single-family homes. The difference between those permits issued in 2006 compared to those issued this year is that multifamily permits in 2011 have been primarily for rental housing instead of for-sale condominiums. Why has multifamily investment been so hot, especially in D.C.? What are Building Permits DC Metro some of the underlying economic and demographic fundamentals driving the 30,000 multifamily market? There are a number of reasons that stimulate a strong 25,000 appetite for multifamily product. At a macro level, U.S. homeownership 20,000 rates reached their apex in 2004 and have continued to decline. By the end 15,000 of 2010, ownership rates were slightly under 67% -- at the end of the third 10,000 quarter of 2011 the homeownership rate was 66.1% -- still higher than rates 5,000 in the mid-1980s to 1990s. Renting has been a viable alternative to owning 0 a house. Changing economics and demographics have driven much of this 80 82 84 86 88 90 92 94 96 98 00 02 04 06 08 10 19 19 19 19 19 19 19 19 19 19 20 20 20 20 20 20 MF SF decline in homeownership. Source: US Census Bureau, Moody’s cassidyturley.com | 1
- 2. Multifamily Trends November 2011 Incomes and affordability are squeezed. With the coming and going of the Great Recession, real household incomes have decreased. Those people aged 25 to 34 – the prime age cohort for purchasing a first home or renting an apartment – have seen their real income decrease by 5% from 2005 to 2010. Diminishing spending power has driven this group and others to delay purchasing a home and consider renting. Despite record low mortgage rates, decreased home affordability has fueled rental demand in a number of markets. Large metros, such as the Washington, D.C. area, have seen home affordability diminish significantly as home prices have outpaced incomes. From 1975 to 2001, the average price to income ratio for a single-family home in the region was 1.8; since 2001, the average price to income ratio has increased significantly to 2.5. While that is off its peak of 3.5 in 2005, home prices are still relatively high in comparison to incomes. Until price to income ratios fall back towards more historical levels, there will still be an impetus to rent in the D.C. market. Most likely, affordability will remain under pressure for some time as regional home prices are on the rebound and incomes are held in check by a slow economic recovery. Homeownership Rates Price to Income Ratio US Residential SF Homes, DC Metro 2004 = 69% 3.5 69 3.0 68 Av = 2.5 2.5 67 2010 = 66.9% 2.0 Av = 1.8 66 1.5 65 1.0 0.5 64 0.0 63 19 1 19 1 19 1 19 1 19 1 19 1 19 1 19 1 19 1 19 1 19 1 19 1 20 1 20 1 20 1 20 1 20 1 20 1 1 Q Q Q Q Q Q Q Q Q Q Q Q Q Q Q Q Q Q Q 75 77 79 81 83 85 87 89 91 93 95 97 99 01 03 05 07 09 11 80 82 84 86 88 90 92 94 96 98 00 02 04 06 08 10 19 19 19 19 19 19 19 19 19 19 19 20 20 20 20 20 20 Source: US Census Bureau, Moody’s Source: NAR, BEA, US Census Bureau, Moody’s A diversified renter pool. The D.C. region attracts a young, highly educated workforce. Still, both the young and middle aged rent apartments in the region. Almost the same number of apartment units are occupied by those younger than 35 as those aged 35 to 64. Many professionals aged 35 to 64 live in D.C. part-time or for the short-term due to Congressional or diplomatic service. Varying age groups support the need for communities geared toward both young individuals out of college and also experienced professionals. Marketing to the average (median) Joe. D.C. Metro boasts significantly higher incomes compared to the U.S. as a whole. According to the U.S. Census Bureau, the D.C. Metro median income was $84,500 in 2010 compared to $50,000 for the U.S. Both the nation and D.C. Metro are similar in one aspect: approximately 75% of rentals are for households at or below the median income. That being said, the D.C. region’s rental properties (which include both attached and detached units) serve more diverse income levels compared to rental properties nationwide. Approximately one-third of D.C. rentals are for households with annual incomes below $35,000, with the second largest group falling in the $50,000 to $75,000 income range. This supports demand for properties located across the D.C. Metro area especially targeted to those at or below the median income. Incomes support buying but some are renters by choice. According to Moody’s and the National Association of Realtors®, median mortgage principal and interest (P&I) payments in the D.C. Metro area are $16,000 annually while annual rental payments are $14,000. Factoring in the tax advantages of purchasing, one could argue that buying is cheaper than renting. Still, many in the D.C. region choose to rent by choice. Looking less like Mayberry. Demographics are evolving, especially in urban areas. The previous household composition “norm” of a married couple with 2.2 kids, a dog, and a house in the suburbs has changed. Demographics have continued to shift in favor cassidyturley.com | 2
- 3. Multifamily Trends November 2011 Renter Occupied Units by Income Household Demographics DC Metro, all product types DC Metro, 2010 100% 100% 145,000 Householder not 90% 90% living alone Non- 80% 80% 563,000 Family 70% $150k+ 70% Householder living alone 60% $100k-$149k 60% 257,000 $75-$99k Female 50% 50% 95,000 householder, no $50-$74k husband present 40% 40% 40% $35-$49k Male 30% Family 30% 30% <$35k 982,000 householder, no 20% wife present 20% Married-couple 10% 10% family 0% 0% US DC Metro Total Households Owner Occupied Renter Occupied Source: US Census Bureau, Moody’s Source: US Census Bureau of more non-family households. According to the 2010 U.S. Census, the D.C. Metro area is home to over 2 million households. Of those, slightly less than half are married-couple families. This cohort tends to own homes, though approximately one-quarter of renter-occupied households are married couples. The second largest demographic is 563,000 single households, comprising 28% of households in the D.C. region. Single households are on the rise and occupy the largest percentage of rental units. Shifting demographics in favor of non-family households and singles point to strong rental demand. People drive demand. The influx of people into the D.C. Metro area has been strong, especially during the recent recession. On average, annual net migration to the region totals 14,000 people. During 2009 and 2010, this figure skyrocketed to over 46,000 people annually, on average, as individuals were attracted by job prospects in the D.C region. As the regional economy normalizes (and the Federal Government slows its accelerated rate of hiring), in-migration to this area will trend back towards historical averages. Nevertheless, an estimated 67,000 net additional people will be added to the region over the next five years. This ongoing population increase will drive demand for both rental and for-sale markets. D.C. is getting both younger and older. D.C.’s population has changed over the years, and this impacts their housing choices. After dipping in the late 1990s, the 25 to 34 year old age group has increased, and consequently so has the number of potential renters. This bodes well for projects in urban areas and those with Metro (subway and bus) accessibility. The number of people over 45 years old continues to grow. This age group has the highest incomes and thus can probably afford to live where they want, as renters or owners. If they choose to rent, they gravitate towards the best locations and can afford higher rents. The one age group that has shrunk over the past four years is 35 to 44 year olds. In the past, this group has typically formed families and chosen to purchase a home. But there are a growing number of singles in this age group who prefer to rent. Total Net Migration Population By Age DC Metro DC Metro Forecast 60 700 650 50 600 40 550 25-34 People (thousands) 500 35-44 thousands 30 450 45-54 20 Av 14,000 400 55-64 10 350 65+ 0 300 250 91 93 95 97 99 01 03 05 07 09 11 13 15 (10) 19 19 19 19 19 20 20 20 20 20 20 20 20 200 (20) 1990 1992 1994 1996 1998 2000 2002 2004 2006 2008 Source: US Census Bureau, Moody’s Source: US Census Bureau, Moody’s cassidyturley.com | 3
- 4. Multifamily Trends November 2011 Outlook: • Market fundamentals remain strong for the D.C. multifamily market. With uncertainties in the economy and political climate, investment dollars will be attracted to stable metro markets such as D.C. • As the D.C. apartment supply pipeline ramps up, be aware of possible oversupply, especially as new projects deliver in 2013 and beyond. • Population supports demand in D.C. Over 67,000 people are expected to migrate to the D.C. metro area over the next five years. Varying product types across the region will be needed to accommodate different types of renters. Additionally, strains on the current transportation infrastructure will not improve sufficiently, thus demand for transit-oriented locations and those close to major work centers will drive demand. • Homeownership rates peaked several years ago. Will they continue to gravitate to the historical average, or dip below it for the long-term? Expect more households to rent by choice (especially true of the Gen-Y population). At least in the short to medium term, many will continue to have difficulties qualifying for a mortgage, saving for a down payment, and struggling with home affordability. • Multifamily rentals will need to target a varying range of ages and incomes. It just isn’t the fresh-out-of-college 22 year old or the “downsizing empty nester” any more. Many mid-career professionals are renting, especially in large urban areas like D.C. Multifamily projects will need to tailor marketing and amenities to multiple groups. cassidyturley.com | 4