SlideShare uma empresa Scribd logo
1 de 38
Baixar para ler offline
Performance of Investment Funds
Master of Finance – Capital Markets
Asset Management
Lecturer: Prof. Dr. Sikandar Siddiqui
Program: Master of Finance
Course: Asset Management
Students: Samuel Berhmani 4906129
Paolo Frigerio 4915418
Hong Pan 4915918
Abstract
Nowadays Mutual Funds are the most important type of Investment Company in the world.
According to the “2012 Investment Company Fact Book” by the Investment Company
Institute, at the end of 2011 the value of the Worldwide Total Nets Assets of Mutual Funds
was $23,779,874,000, managed by a total number of 72,657 Mutual Funds. Despite the
strong financial crisis that is hurting globally the financial markets in these last years, and
the challenge of competing investment products like ETFs, the industry of Mutual Fund
seems quite healthy: the AUM declined slightly from 2010, but the trend has remained
positive and the number of funds is increasing1
.
In this framework, it is always important and relevant understand if in the end this kind of
investment succeeds to add value to the investors, or instead is not able to give an
adequate level of return that compensate all the risk investors bear. This task is particularly
relevant when we consider actively managed Mutual Funds. Managers of these types of
Funds have the ambition to beat the market but, as has been often showed by empirical
studies, they rarely succeed in their efforts.
In our study, after a first general overview of Mutual Funds’ characteristics and a short
comparison between them and ETFs, we present the results of the most important
empirical studies regarding the performance of the Mutual Funds and the persistence over
time of this performance. Usually, these studies investigate the ability of the managers to
earn excess returns, and the persistence of this ability over time: this last point in
fundamental to assess if a fund has beaten the market thanks to the skill of his managers or
simply due to luck. These studies have given interesting outcomes most of the time in line
with the Efficient Market Hypothesis (EMH).
After the review of the existing literature on the subject, we go deeper about the
traditional measures used by the researchers and by the professionals in order to evaluate
the risk-adjusted returns (Sharpe ratio, Treynor ratio, Jensen measure, Information ratio,
The Fama and French 3 Factors Model, The Carhart 4 Factors Model) and we look also at
the problems that could arise in the use of these measures.
Then we focus our attention on some more practical aspects: firstly, we run a style analysis
to see if the returns in our sample of actively managed funds are effectively correlated with
their funds’ benchmark, and if they are correlated by what amount. Style analysis is also
1
“2012 Investment Company Fact Book”, Investment Company Institute, 2012.
another possible way to evaluate the performance of a fund. Secondly, we try to select
some funds that seem able to outperform their benchmarks over a period of time, and we
try to run a performance attribution analysis in order to understand where the added value
comes from. In addition to this analysis, we use others two methods, the return
decompositions and the market models method, with the purpose to get a deeper
knowledge of the performance, and so about the real ability of the fund’ managers.
We conclude our work with an interview with a professional portfolio manager. He has
explained us all the tools that he uses in real life in order to select better funds: we have
tried to use them to run a complete quantitative analysis on several funds. This last part of
the work is presented in the Appendix.
1
1. Investment Funds: the case of mutual funds.
a. Investment Funds: general definition and case of Mutual Funds
Investment companies are financial intermediaries that collect funds from individual
investors and invest, at an aggregate level, those funds in securities or other assets.
In general Investment companies fulfill several important functions for their investors:
I. Diversification and divisibility. Investment companies pool together the money
raised from many investors and enable them to act as a unique large investor. They
build up a well-diversified portfolio. Small investors could benefit from
diversification (as we know diversification implies lower risk because enable us to
avoid the idiosyncratic risk) because they could not do that at a personal level.
Single investor holds a fraction of the large portfolio (ownership is proportional to
the number of shares purchased).
II. Professional management. Investment companies have securities analysts and
portfolio managers who professionally attempt to achieve superior investment
results for their investors.
III. Lower transaction costs. Investment companies trade large blocks of securities,
and so they can get substantial savings on brokerage fees and commissions: they
benefit from economy of scale.
Moreover, investment companies keep track of capital gains distributions, dividends,
investment and redemptions, and they also may reinvest dividends and interest for
shareholders.
The market value of an investment fund is given by the product between the NAV of the
fund itself and the number of shares outstanding. The Net Asset Value (NAV) is the market
value of the assets hold by the funds minus the market value of the liabilities of the fund.
The NAV is expressed on a per share basis:
𝑁𝐴𝑉 =
𝐴𝑠𝑠𝑒𝑡𝑠 − 𝐿𝑖𝑎𝑏𝑖𝑙𝑖𝑡𝑖𝑒𝑠
𝑁𝑟. 𝑜𝑓 𝑆ℎ𝑎𝑟𝑒𝑠 𝑂𝑢𝑡𝑠𝑡𝑎𝑛𝑑𝑖𝑛𝑔
So, the NAV is the value of each share. Open-end funds stand ready to issue or redeem
shares at their NAV: investors buy shares of the fund directly by the fund at current NAV,
and when they want to close their investment position they simply sell back shares to the
fund at NAV. So the number of outstanding shares of these funds changes daily. By
contrast, close-end funds do not redeem or issue shares: investors in these funds operate
on exchange, and often prices could depart from the actual current NAV.
The rate of return of the fund equals the gross return on the underlying portfolio minus the
total expense ratio. As we will see, expenses can have a big impact on the performance of
the portfolio.
𝑅𝑎𝑡𝑒 𝑜𝑓 𝑅𝑒𝑡𝑢𝑟𝑛 =
(𝑁𝐴𝑉1 − 𝑁𝐴𝑉0 + 𝐼𝑛𝑐𝑜𝑚𝑒 𝑎𝑛𝑑 𝐶𝑎𝑝𝑖𝑡𝑎𝑙 𝐺𝑎𝑖𝑛𝑠 𝑑𝑖𝑠𝑡𝑟𝑖𝑏𝑢𝑡𝑖𝑜𝑛𝑠)
𝑁𝐴𝑉0
Several kinds of investment companies exist: Unit Investment Trusts, Open-end Funds,
Close-end Funds, Commingled Funds, Real Estate Investment Trusts and Hedge Funds. The
most common type between these is the Open-end Fund. They are commonly called
2
Mutual Funds. As we have pointed out in the introduction, according to the “2012
Investment Company Fact Book” by the Investment Company Institute, at the end of 2011
the value of the Worldwide Total Nets Assets of Mutual Funds was $23,779,874,000,
managed by a total number of 72,657 Mutual Funds2
. They are accounting for more than
90% of investment funds’ assets3
. Moreover, the most part of academic articles concerning
the evaluation of the performance of investment funds are written about mutual funds.
This is why we have focused our attention only on this particular investment company.
Each mutual fund, according with its specific investment policy described in the fund’s
prospectus, can be classified in one of the subcategories traditionally used to differentiate
mutual funds. Money Market Funds invest in money market securities such as commercial
paper, repurchase agreements and certificates of deposit. The average maturity of these
assets tends to be a bit more than 1 month. Often they offer check-writing features. Bond
Funds are specialized in fixed-income sector. Further possible specializations are funds that
invest in specific kind of bonds according with the type of issuer: corporate bonds,
Government bonds, mortgage-back securities. It’s also observable specialization by credit
risk of the issuer (from safe to high yield) and by maturity: short term, intermediate, long
term. Equity Funds invest primarily in stock, although they may hold fixed-income or other
types of securities. Usually they hold between 4% and 5% of total assets in money market
securities to provide liquidity necessary to meet potential redemption of shares. Common
subclass of equity funds are Income Funds, which tend to hold stock with high dividend
yields, and Growth Funds, which are focusing on prospects for capital gains. Sector Funds
are equity funds concentrate on a particular industry (utilities, banks, telecommunications),
or funds specialize in securities of particular country. International Funds have a
geographical focus: Global funds invest in securities worldwide, Regional funds invest in a
particular part of the world, Emerging markets funds invest in companies of developing
nations. Balance Funds hold both equity and fixed income securities in a relatively stable
proportions. Asset Allocation and Flexible Funds hold both stocks and bonds, but the asset
allocation may vary dramatically in accord with the portfolio’s manager forecast of the
relative performance of each sector. Typically they are engaged in market timing and are
not a low risk profile investment vehicle. Index Funds try to match the performance of a
market index replicating the composition of the market index. It is a passive investment
strategy: to invest without engaging in security analysis. They can be tied on non-equity
index as well. Fund of Funds hold a portfolio of other investment funds rather than
investing directly in stocks, bonds or other securities. A FoF manager aims to select the best
performing funds to invest in based upon the managers past performance. Quant Funds
select securities based on quantitative analysis. Managers build computer-based models to
determine whether an investment is attractive, thus the final decision to buy or sell is made
by this model.
Investing in mutual funds presents some costs. These costs can vary a lot across different
types of funds: typically, the more the investment policy is complex, the higher are the
costs charged to investors. Usually, investors face operating expenses, namely costs
incurred by the mutual fund in the operating the portfolio (including administrative
2
“2012 Investment Company Fact Book”, Investment Company Institute, 2012.
3
“Investments”, Zvi Bodie, Alex Kane, Alan J. Marcus, 9th
edition, 2011, McGraw-Hill/Irwin.
3
expenses and advisory fees paid to the investment manager). They are expressed as a
percentage of the total Asset Under Management (AUM), may range from 0.2% to 2%. They
are not explicit, but they are periodically deducted from the assets of the fund. If investors
buy the shares of the fund by brokers, they can incur also marketing and distribution costs
not accounted in the operating expenses. In addition, some funds charge front-end load: it
is a commission paid when investors buy the shares. Loads reduce the amount of money
invested, typically they are in average around 5% (rarely are higher than 6%). Instead back-
end load is a redemption (or “exit”) fee incurred when investors sell their shares: funds that
charge it typically start at 6% and then reduce it by 1% for every year the funds are left
invested. Furthermore, some funds charge also distribution and marketing costs: they are
not explicit, but are periodically deducted from the assets of the fund. They are limited to
1% of the fund’s NAV per year.
The sum of operating expenses and distribution and marketing costs give us the annual
total expense ratio (TER) of the fund: TER is the measure of the total cost of a fund to the
investor. Not included in the TER are transactions costs (for trading activities) and
performance fees.
Taxation on mutual funds can cause disadvantages to individual investors. Indeed, under
the U.S. tax code, taxes on income from mutual funds are directly paid by investor: capital
gains and dividends are passed through to investors as though the investor earned the
income directly. The disadvantage for the investors is that they cannot control the timing of
the sale of securities from the portfolio: this reduces their ability to engage in tax
management. This disadvantage is even stronger if the fund experiences high portfolio
turnover rate: high turnover means that capital gains or losses are being realized constantly
and hence that the investor cannot time the realizations to manage his overall tax
obligation. Turnover is the ratio of the trading activity of a portfolio to the assets of the
portfolio. It measures the fraction of the portfolio that is replaced each year. Low turnover
fund, such as index fund, may have a turnover as low as 2%, which is both tax efficient and
economical with respect to trading costs. A fund with a high portfolio turnover rate can be
particularly “tax inefficient”.
b. Exchange Traded Funds (ETFs)
ETFs are open-end funds. They allow investors to trade index portfolio just as they do with
shares of stock. Their investment purpose is similar to the one of index funds, but they are
characterized by a completely passive strategy of replication. Nowadays the industry of
ETFs is well developed: as we can see from the chart below, at the end of January 2011
globally the number of ETFs was 2,501, for an AUM equal to 1,334.6 billion of US dollar.
They do not undermine the supremacy of actively managed funds yet, but all the forecasts
say that in the future the market share of ETFs will be more and more relevant4
.
4
BlackRock. “ETF LandScape. Industry Review”, end January 2011.
4
As for common mutual funds, also for ETFs we can distinguish different classes regarding to
the investment object: there are ETFs with Equity index (international, single country,
industry) as benchmark, but also ETFs on bonds index or on commodities exist. In the last
period the industry is developing actively managed ETF funds that attempt to outperform
market indexes (but they count for less than 1% of AUM in the ETFs industry, at the
moment they are not relevant).
ETFs present some relevant advantages over conventional Mutual Funds:
• Mutual fund’s NAV is quoted only once a day; instead ETFs trade continuously (in
every moment during the day you can know the value of your investment), and like
shares they can be sold short or purchased on margin.
• Tax efficiency: when small investor wishes to redeem its position in an ETF, he
simply sells his/her shares to other trades, with no need for the fund to sell any
assets of the underlying portfolio. It’s a form of redemption that avoids tax events
for the rest of the investors in the fund.
• ETFs are cheaper than Mutual Funds: lower management fees charged by the funds
to the investors because there is not active management to remunerate.
• In general ETFs do not charge front-end load, back-end load or performance fees.
Although, ETFs have also some disadvantages:
• There are possibilities that ETFs’ prices can depart by small amounts from net asset
value before arbitrage activity restore equality.
• TER is the explicit cost and generally for ETFs it is lower than Mutual Funds. But
ETFs must be purchased from brokers for a fee. And then you must consider
another implicit cost that is the bid-ask spread.
When it comes to evaluating the performance of mutual funds, researchers mainly put their
emphasis on whether active management can earn excess returns which is able to cover its
additional costs in spending effort to improve investment performance. No improvement
strategies involved in portfolios is what we called passive management (as strategies used
by ETFs). Compared to passive management, active management is the attempt to improve
5
performance either by identifying mispriced securities or by timing the performance of
broad asset classes5
.
In the chart below we present a brief comparison between a mutual fund and an ETF
invested on the same benchmark. As you can see, the total expenses ratio is higher for the
mutual fund: the difference is almost equal to 100 basis points. It is a big difference and
probably this has negative effects on the performance of the mutual fund relatively to the
one of ETF: indeed, we see that the actively managed mutual fund is not able to beat is
passive competitor. The performance are quite similar, it seems even that the ETF has done
better in the past. One possible explanation of the poor performance of the active fund
could be that, if it is able to generate outperformance as active managers usually presume,
this will be probably destroyed by the higher costs that the fund generate due to his active
strategy.
Does the active management actually add value to the funds? A lot of researches have been
done to figure this issue out. Some suggest that mutual fund managers have the ability to
choose stocks that outperform their benchmarks, before any expenses are deducted. We
will offer a deeper view about this important aspect in the next section.
2. Literature Review (Summary of Empirical Results)
Before starting with our personal analysis, we would like to present briefly the results of
some of the most important empirical studies regarding the performance of mutual funds.
These studies are important not only to assess whether the investment in mutual funds is
on average a good investment in terms of returns adjusted for risk, but, from an academic
perspective, assessing the existence and the persistence of mutual fund managerial ability
is an important test of the efficient market hypothesis: evidence of persistence ability
would support a rejection of its semi-strong form.
The first study that we have looked is the one by Elton, Gruber, Das, Hlavka (1993) 6
. They
have found that mutual fund managers underperform passive portfolios. Furthermore,
5
Zvi Bodie, Alex Kane, Alan J. Marcus, “Investments”, 9th edition, 2011, McGraw-Hill/Irwin.
6
Edwin J. Elton, Martin J. Gruber, Sanjiv Das, Matthew Hlavka, “Efficiency with Costly Information: A Reinterpretation of
Evidence from Managed Portfolios”, The Review of Financial Studies, Vol. 6, No.1 (1993), pp. 1-22.
UBS (lux) Equity Fund Euro STOXX 50 (EUR) UBS-ETF Euro STOXX 50
Ticker UBFA:GR Ticker E50EUA:GR
NAV (EUR) 134,09 NAV (EUR) 24,87
assets (mln EUR) 396,0382 assets (mln EUR) 637,7014
TER 1,26% TER 0,30%
1-Month -3,66% 1-Month -3,38%
3-Month +13,61% 3-Month +14,33%
1-Year +13,33% 1-Year +11,33%
3-Year -2,10% 3-Year -1,32%
5-Year -8,07% 5-Year -7,36%
Source: Bloomberg
6
funds with higher fees and turnover underperform those with lower fees and turnover.
Funds do not adjust expenses over time to reflect their performance.
Carhart (1997)7
finds that expense ratios, portfolio turnover, and load fees are significantly
and negatively related to the performance. Expense ratios appear to reduce performance a
little more than one-for-one. Load funds substantially underperform no-load funds: the
average load fund underperforms the average no-load fund by approximately 80 basis
points per year. The evidence is consistent with market efficiency. Although the top-decile
mutual funds earn back their investment costs, most funds underperform by about the
magnitude of their investment expenses. The bottom-decile funds (they typically are the
smallest funds), however, underperform by about twice their reported investment costs.
In the end, regarding the issue of consistency in mutual fund performance, he finds that,
after controlling for the 4 factors, there is only minor persistence in relative performance
across managers, and moreover much of that persistence seems due to expenses and
transactions costs rather than gross investment returns. This result suggests that fund
managers possess little stock selection skill. The evidence that performance does not
persist is widely regarded as implying that superior performance, when it exists, is
attributable to luck rather than to differential ability across managers. If all performance is
due to luck, there should be no reason to reward it. But in reality managers appear to reap
rich rewards from superior past performance. This lead to say that investors are not
rational, or their behaviors are due to asymmetric information or moral hazard.
Hence, from this study we can derive 3 rules-of-thumb:
I. Avoid funds with persistently poor performance;
II. Funds with high returns last year have higher-than average expected returns
next year, but not in the years thereafter;
III. The investment costs of expense ratios, transaction costs, and load fees all have
a direct, negative impact on performance.
Daniel, Grinblatt, Titman, Wermers (1997)8
find that the average active mutual fund beats
a mechanical strategies based on stock characteristics like book-to-market, size, and
momentum. But the amount by which the average mutual fund beat a mechanical strategy
is fairly small (under 100 basis points) and is approximately equal to the average
management fee. Moreover they find that aggressive-growth and growth funds, which
exhibit the highest performance, probably generate the largest costs as well.
Wermers (2002)9
has used a database containing quarterly portfolio holdings for all US
equity mutual funds existing between January 1, 1975, and December 31, 1994.
He has found that over the period ‘75-‘94 mutual funds held stock portfolios that
outperform a broad market index (the CRSP value-weighted index) by 1.3 percent per year.
About 60 basis points is due to the higher average returns associated with the
characteristics of stocks held by the funds, whereas the remaining 70 basis point is due to
talents in picking stocks that beat their characteristic benchmark portfolios. However, on a
7
Mark M. Carhart, “On Persistence in Mutual Fund Performance,” Journal of Finance 52 (1997), pp. 57–82.
8
Kent Daniel, Mark Grinblatt, Sheridan Titman, Russ Wermers, “Measuring Mutual Fund Performance with Characteristic-
Based Benchmarks”, The Journal of Finance, Vol. 52, No. 3 (1997), pp. 1035-1058.
9
Russ Wermers, “Mutual Fund Performance: An Empirical Decomposition into Stock-Picking Talent, Style, Transactions Costs,
and Expenses”, The Journal of Finance, Vol. LV, No. 4 (2000), pp. 1655-1695.
7
net return level, the funds underperform broad market indexes by 1% per year. Of the 2.3%
difference between the returns on stock holdings and the net returns of funds, 0.7 % per
year is due to the lower average return of the non-stock holdings (bonds and cash) of the
funds during the period (relative to the stocks). The remaining 1.6% is split almost evenly
between the expense ratios and the transaction costs of the fund. So, considering only the
stock holdings, mutual fund manager hold stocks that beat the market portfolio by almost
enough to cover their expenses and transactions costs, which is consistent with the
equilibrium model of Grossman and Stiglitz (1980)10
. Grossman and Stiglitz show that while
mutual funds can outperform on a gross-return basis, net of costs (including research costs)
they will not be able to do so in a strongly efficient market. Mutual funds holdings of cash
and bonds, presumably to maintain liquidity in the face of uncertain investment inflows and
redemptions, put a substantial drag on the net returns of funds relative to the market.
Besides high-turnover funds, although incurring in substantially higher transactions costs
and charging higher expenses, also hold stocks with much higher average return than low-
turnover funds. At least a portion of this higher return level is due to the better stock
picking skills of managers of high turnover funds. All results ignore the higher tax burden of
actively managed (especially high turnover) funds.
Bollen and Busse (2004)11
have used daily mutual funds returns, and Carhart 4-factors
model to investigate short-term persistence in mutual fund performance. Their results
suggest that superior performance is a short-lived phenomenon that is observable only
when funds are evaluated several times a year (quarterly: they focus on a relatively short
measurement period of three months). Although their findings are statistically significant
and are robust to tests, the economic significance of persistence in mutual fund abnormal
return is questionable: after taking into account transaction costs and taxes, investors may
generate superior returns by following a naïve buy-and-hold approach rather than a
performance-chasing strategy, even if short term performance is predictable.
Berk and Green (2004) 12
have found that fund flows rationally respond to past
performance even though performance is not persistent and investments with active
management do not outperform passive benchmarks on average. They believe that skilled
mutual funds managers with abnormal performance will attract new funds until the
additional costs and complexity of managing those extra funds drive alphas down to zero.
This means that even if managers are skilled, alphas will be short lived.
Fama and French (2009)13
find that from 1984 to 2006 mutual fund investors in aggregate
get net returns that underperform CAPM, 3-Factors, 4-Factors benchmarks by about the
costs in expense ratios. Thus if there are fund managers with enough skill to produce
10
Sanford J. Grossman, Joseph E. Stiglitz, “On the Impossibility of Informationally Efficient Markets”, American Economic
Review, 70 (1980), pp. 393-408.
11
Nicolas P. B. Bollen, Jeffrey A. Busse, “Short-Term Persistence in Mutual Fund Performance”, The Review of Financial
Studies, Vol. 18, No. 2 (2004), pp. 569-597.
12
Jonathan B. Berk, Richard C. Green, “Mutual Fund Flows and Performance in Rational Markets”, Journal of Political
Economy, Vol. 112, No. 6 (2004), pp. 1269-1295.
13
Eugene F. Fama, Kenneth R. French, “Luck versus Skill in the Cross Section of Mutual Fund Returns”, Working Paper,
forthcoming in the Journal of Finance, December 2009.
8
benchmark adjusted expected returns that cover costs, their track are hidden in the
aggregate results by the performance of managers with insufficient skill.
Otten and Bams (2002)14
have studied the European Mutual funds industry. They have
found that European Mutual Funds prefer small and high-to-book ratio stock (value). In
Europe small cap mutual funds as an investment style outperform their benchmark. Four
out of five countries deliver positive aggregate alphas, where only UK-funds out-perform
significantly.
If we look at European fund returns with costs added back: French, Italian, Dutch and UK
funds out-perform significantly, while German funds still underperform the market, though
not significantly.
Regarding the influence of fund characteristics on risk-adjusted performance, they have
found that expense ratio and age are negatively related to risk adjusted performance, while
fund assets are positively related.
Thus the results suggest that most European Mutual Funds deliver positive risk adjusted
performance to their investors. Contrary to most US evidence, the majority of European
funds seem to be able to find and implement new information to offset their expenses and
therefore add value for the investors. A factor influencing this could be the smaller market
importance of the European versus the US industry. While the US industry holds almost the
30% of the domestic equity market, European funds are rather small players (up to 11%
domestic market importance). If the mutual fund sector grows larger, relative to the
market, it becomes more difficult to outperform the market as a group (smaller market
importance: better position to follow or even beat the market). The conclusion of this study
is that European small cap funds significantly out-perform market as a group.
Thus, summarizing the empirical evidence we have just presented, we can say that overall
there are relatively few mutual funds which have genuinely positive alphas and picking ex-
ante winners is very difficult when one considers potential data snooping bias,
model/estimation errors and transactions costs due to rebalancing. About the persistence
in mutual fund performance, empirical literature provides fairly strong evidence of
persistence in negative performance (persistence among past loser funds is well
established), but much weaker persistence in positive performance.
Sensible advice for most investors would be to hold low cost index funds (high expenses are
positive correlated with bad performance) and avoid holding past “active” loser funds.
Current evidence suggests that only very sophisticated investors should pursue an active
investment strategy of trying to pick winners. Moreover, as past looser funds are likely to
continue to exist and they rarely experience severe outflows, it is necessary to provide
impartial and independent information on fund past performance: it is very important for
investors to have easy access to reliable information on underperforming funds so they can
modify their investment strategies accordingly15
.
14
Roger Otten, Dennis Bams, “European Mutual Fund Performance”, European Financial Management, Vol. 8, No. 1 (2002),
pp. 75-101.
15
David Blake, Allan Timmermann, “Performance Persistence in Mutual Fund: An Independent Assessment of the Studies
Prepared by Charles River Associates for the Investing Management Association”, Prepared for the FSA, April 2003.
9
3. Measures of Performance and Style Analysis
Measures of Performance
The efficient market hypothesis suggests that earnings from active management are less
than the expenses; therefore passive investment strategy is advisable, say investing an
index fund. And we all know this is not the case in reality. Indeed, we assume that the
market is near efficient, which means almost all available information is symmetric to
investors. Investors will spare time and effort to search the stocks and securities only if they
can better off from the activity.
When it comes to the measurement of active performance, we have to set a benchmark to
see if it will generate better outcomes than index fund.
To begin with, we have to get the rate of return from the cash flows. There are two
common ways in calculating. One is called dollar-weighted method; the other is called time-
weighted method. Although both methods provide accurate return of the funds, dollar-
weighted method is not able to present true performance of the funds16
. Therefore, we will
mainly focus on time weighted method in computing rate of return.
Suppose the fund is compared in one year basis, and there are m-periods in a year which
have cash inflows and out flows.
Thus we have:
1 2(1 )(1 )...(1 ) 1mr i i i= + + + −
Where:
1 1
, 1,2...j
j
j j
B
i j m
B C− −
= =
+
jB is the balance of funds at the beginning of jt .
jC is the net contribution to the funds at jt .
If there are k stocks in the portfolio, each weighted 1 2, ,..., kw w w , and
1
1
k
i
i
w
=
=∑ . We can
compute each return of the stocks, giving rise to the return of the portfolio.
1
k
p i i
i
r w r
=
= ∑
Measures for risk-adjusted return
As it stated earlier, it is returns and costs that determine the performance of the portfolios.
Returns should be carefully adjusted if we take risks into consideration. Several classic risk
adjusted measure will be introduced1718
.
16
Stephen G. Kellison, “The Theory of Interest”, 3rd edition, 2008, McGraw-Hill/Irwin.
17
Zvi Bodie, Alex Kane, Alan J. Marcus, “Investments”, 9th edition, 2011, McGraw-Hill/Irwin.
18
Edwin J.Elton , Martin J.Gruber, Stephen J.Brown, William N. Goetzmann, “Modern portfolio theory and investment
analysis”,6th edition, 2003, Wiley.
10
a. Sharpe Measure
Sharpe’s measure is one of the first measures in evaluating portfolio performance.
It divides average portfolio excess return over the sample period by the standard deviation
of returns over that period. It can be written as followed.
( ) /p f pr r σ−
Where:
𝑟𝑓: risk-free rate
𝜎 𝑝: standard deviation of the portfolio returns.
This ratio is often compared to the market Sharpe ratio, which is calculated in the same
way, using market return and standard deviation instead.
( ) /M f Mr r σ−
From the perspective of investors, if ( ) /p f pr r σ− is larger than( ) /M f Mr r σ− , we say the
portfolio is outperformed than the market.
From the view of managers, we can use Sharpe measure to evaluate fund performance in
the same level risk. Given market’s return and standard deviation, the return in negative
management can be derived through each risks level.
M f
i f i
M
r r
r r σ
σ
−
= +
Then we compare actual return on active management with the passive one.
If 0p ir r− > , we can conclude that the managerial effort is merit.
b. Treynor Measure
Treynor’s measure gives us the excess return per unit of risk, but it uses systematic risks
(non-diversifiable risks) instead of total risk.
( ) /p f pr r β−
The systematic risk of the portfolio is defined as
2
( )( )
( )
p p M M
p
M M
r r r r
r r
β
− −
=
−
∑
∑
Treynor’s measure, to some extent, is similar to Sharpe’s measure. Treynor’s measure also
has to be measured against market Treynor ratio. Again, investors prefer portfolios which
have a higher ratio. However, Treynor’s measure considers non-diversifiable risks in
portfolios, which is the biggest difference between the two methods.
c. Jensen Measure
Jensen’s measure is the average return on the portfolio that predicted by the CAPM, given
the portfolio’s beta and the average market return.
From the definition of the systematic risk, it is easy to get that:
1Mβ = 0fβ =
11
Applying the same rule to compute the portfolio performance at the portfolio risk level, we
have:
( )
M f
passive f p
M
f M f p
r r
r r
r r r
β
β
β
−
= +
= + −
We say that managers’ selection on stocks perform better than the market if:
0p passiver r− ≥
The difference between true return and the one in passive management is referred to
portfolio’s alpha value 𝛼 𝑝�, we call it Jensen’s alpha.
M=p p f p fr r r rα β− − − ( )
If Jensen’s alpha has a positive value, it suggests that managers do better than the market,
otherwise alpha will show a negative value.
d. Information Ratio
The information ratio divides the expected excess value in active management by “tracking
error”, which is nonsystematic risk of the portfolio. Thus, we have:
/ ( )p peα σ
Information ratio measures excess return per unit of risk which can be diversified away by
holding market portfolios. The alpha here is different from Jensen’s alpha, because it
measures the excess return, not risk-adjusted return.
=p p indexr rα −
Thus information ratio can be written as
( ) / ( )p index pr r eσ−
Information ratio and Sharpe measure are similar in form, but Sharpe measure uses the risk
premium divided by standard deviation of the return, while information ratio uses the
excess return relative to the benchmark divided by standard deviation of active return
error.
e. Fama and French three-factor model and Carhart four-factor model
The three factors model is introduced by Fama and French in 1993, which explains risk
premium of a portfolio. This model is also an improved model compared to CAPM for
better evaluation. It not only considers the excess return from market portfolios as CAPM
does, but also takes the size and value-growth returns into consideration. The model reads
as follows.
( )it ft i i Mt ft i t i t itR R a b R R s SMB h HML e− = + − + + +
Where:
12
itR , ftR , MtR represent the return of fund i, risk free rate, Market return, respectively.
tSMB is size effect return, and tHML is value-growth return.
The alpha here measures average return, and reflects managers’ impact on the fund.
People are always glad to see a positive alpha, which implies a good performance of the
fund managers.
Later, there-factor model is developed into four-factor model by Carhart in 1997. He adds
momentum factor into the model, making the whole model closer the reality.
(  )it ft i i Mt ft i t i t tit iR R a b R R s SMB h H m MOMML e− = + − + + + +
Although both of the three-factor model and four-factor model are classic models in
portfolio evaluation, the latter is referred as a more robust one because it looks into
momentum factor, and is widely used as a full version of time-series regression model.
After comparing passive management and active management performances, researches
also want to know what consist of the active management. To distinguish whether it is luck
or due to the managerial skills from fund managers, Fama and French (2009)19
have
conducted an empirical research using three-factors and four- factor models to form
benchmarks respectively. They estimated each fund in AUM group. In 3 factors model, net
return is slightly above or in most cases below the average values, and in 4 factors model,
the result is more pessimistic. When it turns to gross return, situations get better and
managers’ skills are committed. Overall, they found that during the period of 1984 to 2006
mutual fund investors in aggregate get net returns are underperformed by the costs in
expense ratios. Only very few managers have sufficient skills to cover costs. Thus luck
seems to be a key element in fund management rather than managerial skills. However,
they also found that if we get rid of the expense ratio, it showed a strong relationship
between returns and managerial skills.
Alternative Method in Evaluation: Style Analysis
Mutual funds may systematically follow certain styles. Style analysis provides an alternative
way in evaluating fund performance. Style analysis refers to the process of determining
what type of investment behavior an investor or money manager employs when making
investment decisions. According to Bodie, Kane, Marcus(2010)20
, style analysis reveals the
strategy that most closely tracks the fund’s activity and measures performance relative to
this strategy.
Through style analysis mutual funds are compared freely with each other from different
indexes, not only with market benchmark. Sharpe has introduced the style analysis method
in 1989-1992, which can be used to evaluate fund’s performance. He makes a regression on
mutual fund returns with a number of asset classes.
Suppose assets are divided into k classes. Then the rate of return can be described as
followed.
19
Eugene F. Fama, Kenneth R. French, “Luck versus Skill in the Cross Section of Mutual Fund Returns”, Working Paper,
forthcoming in the Journal of Finance, December 2009.
20
Zvi Bodie, Alex Kane, Alan J. Marcus, “Investments”, 9th edition, 2011, McGraw-Hill/Irwin.
13
1
1
1 , 0
k
t i it t
i
k
i i
i
r rα β ε
β β
=
=

= + +


= ≥

∑
∑
Where:
iβ , the regression coefficients, represent the sensitivities to each index itr at time t.
1
k
i it
i
rβ
=
∑ , the return on passive management which have the same style as the mutual
funds;
Constraint is put on regression coefficients because they have to be 1 in total and each
coefficient need to be larger or equal to zero; It is not hard to get the idea that sensitivities
to each index consist of a complete asset allocation. Therefore, regression coefficients can
be interpreted as the style of the funds.
We usually use a benchmark to compare with the actual performance, and this benchmark
can be derived from returns-based style analysis. The returns-based style analysis is based
on historical behavior of a fund. To analyze a mutual fund, the only data required are the
total returns for the mutual fund and a set of passive indexes. Statistically, analysts use R-
square as an indicator to tell how well the performance is, since it measures the degree to
which the benchmark portfolio can explain the long-term behavior of the mutual fund21
.
We tried to compose a portfolio, only related to Health & Biotechnology sector and
Financial Services sector. We have regressed 38 funds in these two sectors, using data from
January 2010 to October 2012. SXDP Index and SX7P Index are fund benchmarks for Health
& Biotechnology sector and Financial Services sector, respectively. The strategies for these
38 funds are different; therefore each of them has different styles. Just take one of the
funds as an example. Beta coefficients for this specific fund are 80% and 20%, which
indicates that the style of the portfolio is 80% (SXDP) to 20% (SX7P). In addition, R-square
(89%) in this regression is really high, meaning that the benchmark portfolio is enough
trustful to explain its performance.
Fund β SXDP β SX7P R²
BNPAPSA FP Equity (Health Care) 80% 20% 89%
However, no matter how sophisticated the models are, problems still remain in
performance evaluation22
. Due to the changes in expected returns or decomposition of the
portfolio, the risk levels may change through the time which makes the evaluation more
difficult. Beta coefficients from the historical data will not be consistent all the time
especially when the portfolio is actively managed. Thus, estimating risk levels in the past
21
Lori Lucas, Mark W. Riepe, “The Role of Returns-Based Style Analysis: Understanding, Implementing, and Interpreting the
Technique”, 1996, working paper.
22
Zvi Bodie, Alex Kane, Alan J. Marcus, “Investments”, 9th edition, 2011, McGraw-Hill/Irwin.
14
cannot guarantee a proper performance evaluation. In addition, performance evaluation is
in high demand of sample pools for significant results. Theoretical models are just a basic
knowledge in evaluation, and portfolio managers may change their strategies from time to
time according to different financial situations. Therefore, we have to go deeper and find
out what kind of methods the portfolio managers used in reality.
4. Performance attribution analysis
The interest of the performance attribution analysis is to understand where the added
value comes from: it’s to explain the performance, what is behind the so called “return”. It
is easy to identify which funds have outperformed or not their benchmark over a period of
time. But this lacks a deeper analysis and cannot be the only tool to know if this fund is
good or not. The performance attribution analysis tells us whether or not the portfolio
managers has met his management objectives and if it is coherent with what it is
announced in the commercial prospectus of the fund. It is all about to know the causes of
success and failed investments inside a portfolio.
a. Choice of the benchmark
To analyze a return of a portfolio in comparison to a benchmark, the benchmark has to
correspond to the same asset class, with the same kind of asset that the managers have
drawn in its prospectus. That’s why sometimes it is important to look carefully the
benchmark given by the asset management firm to know if it is really relevant. Otherwise, if
we think that the benchmark provided by the asset management firm is not a good proxy
for our investment not, it is possible to find another one or to build a composite one. This is
especially the case with “Absolute Return Funds” which very often use the LIBOR or the
EURIBOR as benchmark. To get a relevant analysis it is necessary to find a proxy for the
fund.
b. Formula and theory
As we said, portfolio attribution is a big part component in the investment process and
value chain for an asset manager: it is an aid for sales team and marketing to stress the
qualities of the fund or the success of a manager strategy.
The main idea of the performance attribution is to decompose the added value of a fund
performance in comparison to its benchmark. Technically there are two main ways to do it:
- Return decomposition methods (also Brinson Attribution or Accountancy
methods);
- Financial model based method (CAPM).
15
Return decomposition methods (Brinson Attribution)23
The aim of the Return Decomposition Methods is not to get into deep mathematical models
based on regression and so on. Rather, it is just to explain the added value through a
possible decomposition of its factors. The advantages of this method could be summarizing
in the following points:
- Can focus on allocation (top/down approach) or on selection (bottom up approach);
- Easy to calculate (requires benchmark and portfolio returns and weights);
- Easy to understand and explain;
- Used by large portion of investment community;
- Widely accepted in industry.
The simplest way is to consider the added value as a sum of two factors: or top-down or
bottom up.
The manager chooses a sector and inside this sector he picks up a certain number or asset.
He can choose a sector that globally outperforms the market or not (top down) and can
choose an asset that outperform its peers or not (bottom up).
B = Global Benchmark Performance;
bi = performance of the subsector/subpart i of the benchmark;
wbi = weight of the subsector/subpart i.
So that:
𝐵 = � 𝑤𝑏𝑖 ∗ 𝑏𝑖
𝑛
𝑖=1
Sometimes it might be complicated to have the exact weight with the exact performance of
the subsector.
𝐵∗
= � 𝑤𝑏∗
𝑖 ∗ 𝑏∗
𝑖
𝑛
𝑖=1
And:
P = performance of the fund;
pi = performance of a bucket whose bi can be a proxy;
wpi = weight of the bucket i.
𝑃 = � 𝑤𝑝𝑖 ∗ 𝑝𝑖
𝑛
𝑖=1
The added value can be decomposed as following:
𝐴𝑉 = 𝑃 − 𝐵∗
+ 𝐵∗
− 𝐵
𝐴𝑉 = � 𝑤𝑝𝑖 ∗ (𝑝𝑖 − 𝑏∗
𝑖) + �(𝑤𝑝𝑖 − 𝑤𝑏∗
𝑖)(𝑏∗
𝑖 −
𝑛
𝑖=1
𝑛
𝑖=1
𝐵∗
) + � 𝑤𝑏∗
𝑖(
𝑛
𝑖=1
𝐵∗
− 𝐵)
23
Gary P. Brinson, L. Randolph Hood and Gilbert L. Beebower, “Determinants of Portfolio Performance”, Financial Analysts
Journal Vol. 42, No. 04 (1986), pp.39-44.
16
Bottom Up: ∑ 𝑤𝑝𝑖 ∗ (𝑝𝑖 − 𝑏∗
𝑖)𝑛
𝑖=1
Top down: ∑ (𝑤𝑝𝑖 − 𝑤𝑏∗
𝑖)(𝑏∗
𝑖 − 𝐵∗𝑛
𝑖=1 ) + ∑ 𝑤𝑏∗
𝑖(𝑛
𝑖=1 𝐵∗
− 𝐵)
Now we present another example how we could build such decomposition of the returns
with an International Fund. This time the factors that we will consider are the following:
- Under or over exposure thought a market (top down);
- Pick up;
- Currencies exposures.
𝑤𝑖
𝐹
: weight of the country i in the fund;
𝑤𝑖
𝐵
: weight of the country i in the benchmark;
𝑝𝑖
𝐹
: return of the fund in local currency in the bucket of the country I;
𝑝𝑖
𝐵
: return of the bench in local currency in the bucket of the country I;
𝑐𝑖 : return of the exchange rate of the local currency against euro (or the fund currency).
𝑃𝐵 = � 𝑤𝑖
𝐵
∗
𝑖
𝑝𝑖
𝐵
𝐶 𝐵 = � 𝑤𝑖
𝐵
∗
𝑖
𝑐𝑖
𝑃𝐹
𝐸𝑈𝑅
= � 𝑤𝑖
𝐹
∗ ��1 + 𝑝𝑖
𝐹
� ∗ �1 + 𝑐𝑖 � − 1�
𝑖
𝑃𝐵
𝐸𝑈𝑅
= � 𝑤𝑖
𝐵
∗ ��1 + 𝑝𝑖
𝐵
� ∗ �1 + 𝑐𝑖 � − 1�
𝑖
𝐴𝑉 = 𝑃𝐹
𝐸𝑈𝑅
− 𝑃𝐵
𝐸𝑈𝑅
𝐴𝑉 = � 𝑤𝑖
𝐹
∗ ��1 + 𝑝𝑖
𝐹
� ∗ �1 + 𝑐𝑖 � − 1�
𝑖
− � 𝑤𝑖
𝐵
∗ ��1 + 𝑝𝑖
𝐵
� ∗ �1 + 𝑐𝑖 � − 1�
𝑖
= � 𝑤𝑖
𝐹
∗ �𝑐𝑖 ∗ 𝑝𝑖
𝐹
+ 𝑝𝑖
𝐹
+ 𝑐𝑖 �
𝑖
− � 𝑤𝑖
𝐵
∗ �𝑐𝑖 ∗ 𝑝𝑖
𝐵
+ 𝑝𝑖
𝐵
+ 𝑐𝑖 �
𝑖
= � 𝑤𝑖
𝐹
∗ �𝑐𝑖 ∗ 𝑝𝑖
𝐹
+ 𝑝𝑖
𝐹
+ 𝑐𝑖 + 𝑝𝑖
𝐵
− 𝑝𝑖
𝐵
+ 𝑃𝐵 − 𝑃𝐵 + 𝐶 𝐵 − 𝐶 𝐵�
𝑖
− � 𝑤𝑖
𝐵
∗ �𝑐𝑖 ∗ 𝑝𝑖
𝐵
+ 𝑝𝑖
𝐵
+ 𝑐𝑖 + 𝑝𝑖
𝐹
− 𝑝𝑖
𝐹
+ 𝑃𝐵 − 𝑃𝐵 + 𝐶 𝐵 − 𝐶 𝐵�
𝑖
= ��𝑤𝑖
𝐹
− 𝑤𝑖
𝐵
� ∗ �𝑝𝑖
𝐵
− 𝑃𝐵�
𝑖
+ ��𝑤𝑖
𝐹
− 𝑤𝑖
𝐵
� ∗ �𝑐𝑖 − 𝐶 𝐵�
𝑖
+ ��𝑤𝑖
𝐵
∗ �𝑝𝑖
𝐹
− 𝑝𝑖
𝐵
��
𝑖
+ ���𝑤𝑖
𝐹
− 𝑤𝑖
𝐵
� ∗ �𝑝𝑖
𝐹
− 𝑝𝑖
𝐵
��
𝑖
+ �� 𝑤𝑖
𝐹
𝑖
− � 𝑤𝑖
𝐵
𝑖
� ∗ (𝑃𝐵 + 𝐶 𝐵)
+ � 𝑐𝑖 ∗ �𝑝𝑖
𝐹
𝑤𝑖
𝐹
− 𝑝𝑖
𝐵
𝑤𝑖
𝐵
�
𝑖
17
As you can see, we have separated the added value into 6 factors:
• Country allocation;
• Currency allocation;
• Selection effect;
• Interaction;
• Leverage;
• Cross-terms.
Let’s see a numerical example: we are considering a fund invested in two different
countries and using a small leverage of 10%. We build an ad-hoc benchmark composed of
70% and country 1 and 30% of country 2. We have tables summarizing the different returns
in the two countries:
Initial weight Fund Bench
Country 1 45% 70%
Country 2 65% 30%
Total 110% 100%
Local return Fund Bench
Return Country 1 7% 5%
Return Country 2 5% 6%
Exchange rate/EUR
Country 1 1%
Country 2 1,5%
We have calculated each factor using the given formulas:
Fund Performance:
45% × [ (1+7%) × (1+1%) – 1 ] + 65% × [ (1+5%) × (1+1.5%) – 1 ] = 7.91%
Benchmark Performance:
70% × [ (1+5%) × (1+1%) – 1 ] + 30% × [ (1+6%) × (1+1.5%) – 1 ] = 6.51%
Thus, the fund was able to add value, and precisely the added value is about 1.39% (Fund
Performance – Benchmark Performance = 7.91% - 6.51%).
Market performance:
(70% × 5%) + (30% × 6%) = 5.30%
FX performance:
(70% × 1%) + (30% × 1.5%) = 1.15%
18
Country effect contribution:
[ (45% - 70%) × (5% - 5.3%) ] + [ (65% - 30%) × (6% - 5.3%) ] =0.07% + 0.25% = 0.32%
Currency effect contribution:
[ (45% - 70%) × (1% - 1.2%) ] + [ (65% - 30%) × (1.5% - 1.2%) ] =0.03% + 0.12% = 0.15%
Selection effect contribution:
[ 70% × (7% - 5%) ] + [ 30% × (5% - 6%) ] =1.40% + -0.30% = 1.10%
Cross terms contribution:
1% × [ (45% × 7%) - (70% × 5%) ] + 1.5% × [ (65%× 5%) - (30% × 6%) ] = 0.00% + 0.02% =
0.02%
Interaction effect contribution:
[ (45% - 70%) × (7% - 5%) ] + [ (65% - 30%) × (5% - 6%) ] =-0.50% + -0.35% = -0.85%
Leverage effect contribution:
[ (45% + 65%) - (70% + 30%) ] × (5.30% + 1.15%) = 10% × 6.45% = 0.65%
To sum up:
Returns
Fund 7,91%
Bench 6,51%
Spread 1,39%
Perf. Attrib. details Country 1 Country 2 Total
Country allocation 0,07% 0,25% 0,32%
Currency allocation 0,03% 0,12% 0,15%
Selection effect 1,40% -0,30% 1,10%
Interaction -0,50% -0,35% -0,85%
Leverage 0,65%
Cross Terms 0,00% 0,02% 0,02%
Total 1,39%
What we can analysis is that the fund outperforms very well by investing in the country
number two (+25bps) but the underlying of this bucket are bad (-30bps) which leads to a -
35bps interaction effects. The choice of country 1 is still a good investment, what we can
also see is that he has got a 140bps outperformances in his stock picking effect.
Leverage is positive because the position even without leverage is profitable, therefore, in
this specific case, using leverage has a positive effect on the fund’s performance.
19
SCENARIO + SCHEME
We can simplify the precedent model to get just three factors very simple to explain. This is
based on the work of Riordan Consulting.24
i. Allocation Effect
The general formula to figure out the allocation effect is the following:
[(portfolio sector weight) – (benchmark sector weight)] * [(benchmark sector return)-(benchmark
total return)]
The allocation effect measures the portfolio manager performance through a top-down
point of view. It allows answering the following question: does he have effectively allocates
its asset throughout different sector/country/segment (regarding the decomposition
chosen)? The figures given by this effect tell whether or not the investment manager has
over weight such bucket relatively to the benchmark bucket. If its value is positive it means
that the manager has put his investment in an over performing sector (vs. benchmark).
Benchmark return
Segment Weight Segment > Total Bench return Segment < Total Bench Return
Portfolio > Bench Scenario 1 Scenario 2
Portfolio < Bench Scenario 3 Scenario 4
The allocation effect could be positive in two cases: if the portfolio segment is overweighed
in a segment that outperforms the global benchmark (scenario 1) or if the portfolio
manager underweights a segment that underperforms the global benchmark (scenario 4).
Instead, this effect could be negative if he overweight a bad segment (scenario 2) or if he
underweight an outperformer segment (scenario 3).
ii. Selection effect
The general formula to calculate the selection effect is the following:
(benchmark sector weight)] * [(portfolio sector return)-(benchmark sector return)]
The selection effect can be seen as the stock-picking skill of the asset manager. Within a
certain sector/country/segment it measures the outperformance of the fund relative to the
benchmark. If the fund under performs it means that globally the investment manager
selects the worst value among the bucket. The over or underperformance of the portfolio is
weighted by the benchmark weight, therefore, selection is not affected by the manager’s
allocation to the segment. The weight of the segment in the portfolio determines the size
of the effect - the larger the segment, the larger the effect is (it could be either positive or
negative).
Segment Returns
Portfolio > Benchmark Portfolio < Benchmark
Scenario 1 Scenario 2
24
http://www.riordan-consulting.com/
20
A positive selection effect is obtained when the portfolio manager can get a return which is
higher the benchmark return (considering a sector/subsector): it means that the
investment manager has made good decisions in selecting securities that, as a whole, have
outperformed similar security in the benchmark. A negative selection effect simply means
that the portfolio manager has made poor investment decision inside a particular bucket.
iii. Interaction Effect
The general formula to estimate the interaction effect is the following:
[(portfolio sector weight) – (benchmark sector weight)] * [(portfolio sector return) – (benchmark
sector return)]
Segment return
Segment Weight Portfolio > Bench return Portfolio < Bench Return
Portfolio > Bench Scenario 1 Scenario 2
Portfolio < Bench Scenario 3 Scenario 4
The interaction effect measures the combined impact of the portfolio manager selection
and allocation decisions within a sector/country/segment. To give an example, the manager
may have an outperformance regarding the stock picking criteria, and the portfolio could
overweight a specific sector/country/segment which outperforms the benchmark as well.
The interaction is thus positive. Instead, if he would have underweighted this particular
segment the interaction effect would have been negative. The manager did not take any
more advantage of its good selection by putting more money in it. We have also to notice
that many asset managers consider this interaction effect as a part of the bottom up or top
down effect.
To be more precise, a positive interaction effect occurred because the portfolio weight was
greater than the benchmark weight and so the portfolio return was greater than the
benchmark return. The investment manager exercised good selection and over allocated
assets to that segment (scenario 1). Another way to get a positive interaction factor is when
the manager decides to underweight a poor performing segment (scenario 4).
Instead, a negative interaction effect occurred because the investment manager
overweight a sector that underperforms the global benchmark and its returns on its
particular segment is below the segment average (scenario 2). Another case is when the
manager underweight a sector relative to the bench but outperforms its peers. The
investment manager underweighted the segment with good selection. The manager
exercised good selection but poor allocation (scenario 3).As we can see in this kind of
analysis, with 3 factors, it is possible to come up with a negative term regarding interaction
between the asset allocation added value and the bottom up, although the top down and
the bottom up are separately positives. It’s just to get big pictures because some other
factors, important in the investment process, are absents:
- It says nothing about the cash performance of the fund, management fees,
transaction costs, etc…
This model is very often used in the fund of funds or diversified portfolio.
21
Financial model based method (CAPM)
A model based on the CAPM allows decomposing the return into two factors: alpha and
beta.
Beta: Market influence, market sensitivity the market timing
Alpha: stock picking effect; the return of the fund if we consider no market variations.
By neglecting the epsilon in the CAPM formula:
𝐴𝑉 = 𝑃𝐹
𝐸𝑈𝑅
− 𝑃𝐵
𝐸𝑈𝑅
𝐴𝑉 = 𝑃𝐹
𝐸𝑈𝑅
− 𝛽𝑃𝐵
𝐸𝑈𝑅
+ 𝛽𝑃𝐵
𝐸𝑈𝑅
− 𝑃𝐵
𝐸𝑈𝑅
𝐴𝑉 = 𝑃𝐹
𝐸𝑈𝑅
− 𝛽𝑃𝐵
𝐸𝑈𝑅
+ (𝛽 − 1)𝑃𝐵
𝐸𝑈𝑅
But it is important to notice that the choice of the factors is subjective.
Another point which is critical when comparing a NAV vs. a Benchmark or an Index:
 We have to be careful of how the NAV is calculated. Sometimes the fund
underlying stock market prices hours are different from the benchmark and can
lead to distortions especially in a volatile market.
o Example: The fund NAV calculation processes (settlement and delivery for
example) force the fund to value some stock with the day before stock
market price.
 You have to look during the time the composition of the portfolio regards the
benchmark. Sometime the outperformance is only due to an underinvestment of
the portfolio. We can see that with “EdR Tricolore Rendement” in 2008 which has a
part of its asset in cash25
. During a bearish market, a manager can simply chooses
to invest in cash to avoid a certain exposure to the market (lowering its beta). This
has to be carefully taken into account regarding the investment style and the
investment process. An equity fund is not supposed to be invested in cash (we do
not pay fees for that!!) and in a certain way stress a sort of incapacity of the
manager to decide in a certain environment.
Technical limits of Financial Model based Method
If we consider that the returns are compounding, investing in a good fund in a bull market
make more money by the implicit reinvestment of the excess return. In this way a portfolio
25
„Tricolore rendement“ presentation 2011.
22
manager who has got a 2% added value every year for 5 years will have a spread
performance with the bench of 21.4% if the market has been growing during these five
years. But if the market were flat he would have only got a 10.4% outperformance.
In the accountancy method with international portfolio there is a crossed term between
the market effect and the currency effect. If the market grows by 10% and the foreign
currency will go up by 5% against euro: the investment will have a 15.5% total return. How
to attribute this 0.5% excess return?
Problem: No risk information, no volatility information
To be consistent, the risk taken by the portfolio managers (i.e. the volatility) must be the
same vein as said at the beginning. If not the measurement are biased and you can come
up with completely wrong conclusion or misunderstanding of the nature of the portfolio. It
is crucial to choose the benchmark in terms of its composition as well as in terms of its
volatility
If this is not considered there is a risk in misunderstanding the added value created by the
portfolio manager and the risk premium linked to a higher systematic risk over the
benchmark. All these previous methods just highlight a situation at a certain time but
nothing is said what happened between two the path.
5. Conclusion
As Mutual Funds are, in terms of AUM and of number of entities, the most important type of
investment company worldwide
26
, we have focused our efforts to present in this thesis all the
relevant aspects in performance evaluation for the specific case of this asset class. First of all, we
have given a general definition of Mutual Fund, showing all their traditional features and
peculiarities around different subclasses of Mutual Funds. Then, we have mentioned a relatively new
class of open-end funds: Exchange Traded Funds. We have underlined the differences between them
and Mutual Funds because, nowadays, a very lively debate is taking place, both in the industry and
among academics, about which is the best investment vehicle among these two kind of open-end
fund in terms of performance (active management vs. passive management). If we look at the
empirical evidence, that we have presented in the second part of our thesis, we can come up saying
that probably, in the case of investment in efficient financial markets, as the US financial market,
Mutual Funds are not very efficient: only few Mutual Funds seem able to achieve positive alphas
when we adjusted returns for risks. Typically, expense ratios, portfolio turnover, and load fees of the
fund are significantly and negatively related to the performance
2728
. Empirical evidence says also
26
“2012 Investment Company Fact Book”, Investment Company Institute, 2012.
27
Edwin J. Elton, Martin J. Gruber, Sanjiv Das, Matthew Hlavka, “Efficiency with Costly Information: A
Reinterpretation of Evidence from Managed Portfolios”, The Review of Financial Studies, Vol. 6, No.1 (1993), pp. 1-
22.
28
Mark M. Carhart, “On Persistence in Mutual Fund Performance,” Journal of Finance 52 (1997), pp. 57–82.
23
that also persistence of performance is difficult to find between Mutual Funds: Carhart
29
has found
strong evidence of persistence in negative performance, but much weaker persistence in positive
performance, and even persistence seems related to expenses and transactions costs rather than
gross investment returns. This evidence suggests that Mutual Funds don’t create value for investors,
even they have the ambition to beat the market, and probably ETFs, given the important role played
by costs in determining the net performance of a fund, as they usually are cheaper than Mutual
Funds, are able to provide better net returns adjusted for risk than Mutual Funds. The fact that we
can observe a great number of Active Mutual Funds with poor past performance, leads to say that
investors are not rational: but probably the explanation is that there is a lack of impartial and
independent information on fund past performance and investors have difficult access to
information on funds (and when it is easily available, it is normally very difficult understandable by a
non-professional)
30
.
In the third part of the thesis we have presented the traditional measures such as risk adjusted ratios
and factor models widely used to evaluate returns of the portfolios. Naturally, they are different
from each other, and so can be used to evaluate different aspects of the performance. These ratios
enable us to measure the returns not only on the aspect of total risks, but also on systematic risks of
the portfolios. They are also used to compare the performance between passive management and
active management. Apart from the indicators above, Style Analysis
31
provides an alternative way in
analyzing the funds performances from the perspective of investment behaviors. It reveals the
strategy that most closely tracks the fund’s activity and measures performance relative to this
strategy.
Finally, we explain what a Performance Attribution Analysis is and how it works. This is a very
important aspect in evaluation of mutual fund performance: it enables us to understand how those
activities that compose the investment management process – investment policy, market timing and
security selection – affect the returns
32
. We have presented the two main methods that are used to
perform this analysis: the Return Decomposition Method (also known as Brinson Attribution) and the
Financial Model Based Method. The first one is the most common approach, developed by Gary
Brinson and widely accepted by the industry, and it is also the more precise one: it allows us to
decompose the added value of a fund performance in 6 different factors. The second model, instead,
is less sophisticated than the first one, and it is based on CAPM model. It decomposes the
performance in two factors: beta, namely the market sensitivity, and alpha, that capture the stock
picking effect.
29
Mark M. Carhart, “On Persistence in Mutual Fund Performance,” Journal of Finance 52 (1997), pp. 57–82.
30
David Blake, Allan Timmermann, “Performance Persistence in Mutual Fund: An Independent Assessment of the
Studies Prepared by Charles River Associates for the Investing Management Association”, Prepared for the FSA,
April 2003
31
“Investments”, Zvi Bodie, Alex Kane, Alan J. Marcus, 9th
edition, 2011, McGraw-Hill/Irwin.
32
Gary P. Brinson, L. Randolph Hood and Gilbert L. Beebower, “Determinants of Portfolio Performance”, Financial
Analysts Journal Vol. 42, No. 04 (1986), pp.39-44.
24
Bibliography
• “2012 Investment Company Fact Book”, Investment Company Institute, 2012.
• BlackRock. “ETF LandScape. Industry Review”, end January 2011.
• Carl Bacon, “Evolution of Performance Attribution Methodologies”, June 2004.
• Damien Laker, “Fundamentals of Performance Attribution: The Brinson Model.”
• David Blake, Allan Timmermann, “Performance Persistence in Mutual Fund: An Independent
Assessment of the Studies Prepared by Charles River Associates for the Investing
Management Association”, Prepared for the FSA, April 2003.
• Dr. Stefan J. Illmer, “Overview of Performance Attribution”, April 2010.
• Edwin J.Elton , Martin J.Gruber, Stephen J.Brown, William N. Goetzmann, “Modern portfolio
theory and investment analysis”,6th edition, 2003, Wiley.
• Edwin J. Elton, Martin J. Gruber, Sanjiv Das, Matthew Hlavka, “Efficiency with Costly
Information: A Reinterpretation of Evidence from Managed Portfolios”, The Review of
Financial Studies, Vol. 6, No.1 (1993), pp. 1-22.
• Eugene F. Fama, Kenneth R. French, “Luck versus Skill in the Cross Section of Mutual Fund
Returns”, Working Paper, forthcoming in the Journal of Finance, December 2009.
• Fama, Eugene F., French, Kenneth R., “The Cross-Section of Expected Stock Returns”,
Journal of Finance, Vol. 47, No. 2 (1992), pp. 427-465.
• Gary P. Brinson, L. Randolph Hood and Gilbert L. Beebower, “Determinants of Portfolio
Performance”, Financial Analysts Journal Vol. 42, No. 04 (1986), pp.39-44.
• Jensen, M.C., “The Performance of Mutual Fund in the Period 1945-1964”, Journal of
Finance, No.23 (1968), pp. 389-416.
• Jason C. Hsu, Vitali Kalesnik, and Brett W. Myers, “Performance Attribution: Measuring
Dynamic Allocation Skill”.
• Jonathan B. Berk, Richard C. Green, “Mutual Fund Flows and Performance in Rational
Markets”, Journal of Political Economy, Vol. 112, No. 6 (2004), pp. 1269-1295.
• Kent Daniel, Mark Grinblatt, Sheridan Titman, Russ Wermers, “Measuring Mutual Fund
Performance with Characteristic-Based Benchmarks”, The Journal of Finance, Vol. 52, No. 3
(1997), pp. 1035-1058.
• Lori Lucas, Mark W. Riepe, “The Role of Returns-Based Style Analysis: Understanding,
Implementing, and Interpreting the Technique”, 1996, working paper.
• Luc Dumontier, “Gestion Quantitative”.
• Mark M. Carhart, “On Persistence in Mutual Fund Performance,” Journal of Finance 52
(1997), pp. 57–82.
• Nicolas P. B. Bollen, Jeffrey A. Busse, “Short-Term Persistence in Mutual Fund
Performance”, The Review of Financial Studies, Vol. 18, No. 2 (2004), pp. 569-597
• Performance Attribution for Equity Funds and Categories Methodology, Morningstar
Methodology Paper, September 30, 2011
• Roger Otten, Dennis Bams, “European Mutual Fund Performance”, European Financial
Management, Vol. 8, No. 1 (2002), pp. 75-101.
25
• Russ Wermers, “Mutual Fund Performance: An Empirical Decomposition into Stock-Picking
Talent, Style, Transactions Costs, and Expenses”, The Journal of Finance, Vol. LV, No. 4
(2000), pp. 1655-1695.
• Sanford J. Grossman, Joseph E. Stiglitz, “On the Impossibility of Informationally Efficient
Markets”, American Economic Review, 70 (1980), pp. 393-408.
• Sharpe, W. F., “Mutual Fund Performance”, Journal of Business, No. 39 (1966), pp. 119-138.
• Stephen G. Kellison, “The Theory of Interest”, 3rd edition, 2008, McGraw-Hill/Irwin.
• Zvi Bodie, Alex Kane, Alan J. Marcus, “Investments”, 9
th
edition, 2011, McGraw-Hill/Irwin.
26
APPENDIX
1. Interview with a Fund of Funds Manager
We have decided to interview a professional portfolio manager in order to get a view of
how, in the asset management business, professionals assess performance of funds. We
choose precisely a fund of fund manager because his job is to look at the fund
performances and to pick up the best fund in order to generate alpha, and so create value
for investors. It is a French famous asset management firm among the group Edmond de
Rothschild. They manage about 20 billion euros and this desk about 2 billion euros. The
portfolio manager is named Quentin Doulcet, junior, and dedicated to Fixed Income funds.
Can you explain to us how do you manage to invest in funds, what are your criteria in
your investment process?
Q.D.: The moment we meet with the investment manager, the responsible of the portfolio
is the most important part. Our analysis is clearly based in this qualitative analysis and in
particular the understanding of the investment manager of its segment of his investment
process and the coherence about what he has told to us his personality, his experience of
the market and the transparency of his management. If for example he does not want to
tell the current bets he has been doing in his portfolio it is a bad sign. What he can explain
to us is critical.
For example it happened to me for an Asia short duration fund which had similar
performances to some high yield funds. We could not understand the sources of this
outperformance. There was a problem of coherence with its own asset class. He could not
justify his performance. He did not want to say which traded was generating the
performance. So the aspect of explaining the source of the performance is a big deal before
investing. And also the understanding of the performance and the selection process of the
investment manager is also important as well. The speech of the investment manager must
but clear regarding his management objectives.
So, we agree that this phase comes after, I suppose, a kind of screening of the Long Only
universe fund database?
Q.D.: Yes, the first step is a large screening that we do every 6 months with the Morning
Star tools. We look for the difference performances and volatility of the funds. We check
their ranking among their peers and regarding their quartile. A ranking is made by Morning
Star which regroups similar funds together to have some clear pools of funds (same
27
strategies/AUM etc...). We especially look up for the funds that really outperform their
peers for more than 3 years.
Also the salesmen of the investment firms come to meet us up to show their different
funds. It is another source of funds in which we are likely to invest without making the
screening process. Sometimes the investment firms organize some meetings talking about
macroeconomics, markets and often a fund is backed and they present the funds after.
What comes after is the pure quantitative analysis. You can check an example.
Firstly we check the entire common ratio linked to performance and volatility (Sharpe
etc…). We calculate also the Information Ratio, Max Draw Down, and a lot of different
criteria to get the big pictures of the funds in a quantitative way. By the end we have to
come up with the conclusion either or not the fund is coherent with what it is written in the
PPM and prospectus and also if the fund is not beavering too different from its benchmark.
Then we proceed to at least one conference call and we try to meet the responsible of the
portfolio.
Another important point is that we do also financial and operational due diligence with the
different investment firms. If for example it is a new small investment firm that we do not
know well we will produce a financial and operational due diligence before investing. We
will investigate into the structure of the firms; get to know more about the portfolio
managers, their experience and track records and also the different analysts. We will
toward to check: the turnover ratio of the staff, how much money the execs have in the
firms, ownership and the AUM composition (to know if it is concentrated or not). It is as
much important as to find a fund with a good track. We also look up at how they proceed
to value their asset and calculate the NAV.
The following part is about analyzing the portfolio of the fund. We ask to the PM the
composition of its portfolio and we look at if it is coherent with what he had said. The risk
structure is also very important. We check if he does not take too much risk on few lines.
For example with a bond portfolio we look to the duration structure, by yield to know if the
global duration of the portfolio does not come from one or two lines and what lines bear
the more risk. It is speaking from a bond portfolio point of view but it is strictly the same
regarding an equity funds. They look at the cVAR95 by line, how the risk is diversified, into
many lines or not how the risk is diversified.
At the end the idea is to really understand how the PM build his portfolio and the selection
process and how he explains the performance.
In a « value creation » point of view, it is essentially present in the qualitative analysis?
28
Q.D.: Well yes, the quantitative analysis anyone can do that or get one from an analyst. The
value creation is poor in an quantitative analysis. For us the quantitative analysis is almost a
part of the screening. It is something that comes before, a prerequisite in some words. If a
fund has got a poor performance we will not look at it anyway. We will be keen to look a
fund with a good Information Ratio, which means that he has been well doing and we will
want to know how he has managed to get this outperformance. Has he been taking much
more risk than its benchmark or index or not? He can have an outperformance but if he has
a tracking error ratio above 15 it is a lot and it means that he has been taking risk outside
the index and they are very strong. You have to understand how the outperformance is
done where it comes from. If the tracking error is very close it means that he has selected
all the items that have outperformed the index. Then you have to analyze how it is
diversified and so on…
How do you manage the persistence or the returns over-time?
Q.D.: We try to meet on a regular basis the investment managers or the investment
relationship and our investment are in long terms, about 3 to 5 years. An important point to
notice is how the fund does in a certain market condition and especially stressed ones, for
example during the short fall in September 2008 or more recently in August 2011. This is
very important and can be very relevant on how the PM handles bearish or volatile markets
and helps a lot to understand how the performance is created. We try to understand how
the fund behaves during a turmoil market. For example if the fund style is defensive and
that the funds is dropping more that some dynamic called fund there is obviously a
problem and we need to have some explanations from the PM. That is what we do, as soon
as we have something we do not understand regarding the performance of the fund we call
them. If over a week time a fund is flat and the market is 6% up we ask to the PM what
happened and it is not necessarily bad all that matter is his answer if it is coherent or not.
We look up if he is still inside his strategy and if he is transparent or not. If he says “we
were on that particular stock and the quarterly results were not what we expected” but still
follow a precise strategy it is still OK. For example one time we were invested in a fund that
held some Facebook stock through Morgan Stanly during the IPO. The PM of the fund did
not want to tell us that they were effectively holding all lot of them and they faced a huge
drop in their NAV that only this could explain during the IPO‘s week. The fund did not want
to share with us the information. So we sold all our positions.
Can it be a factor to sell your entire position?
29
Q.D.: Yes exactly. Trust is very important in this business. It is all a matter of trust. The
senior managers Mr. Hacques and Mr. Gérald did not trust them anymore. Even if some of
their other funds were performing well in the same investment firm and although that we
held some of them we liquidate all our positions, even if the others funds had not direct
relationship with the Facebook deal. When the trust is gone, we short. This criterion is very,
very important, can you trust the PM or not.
How do you manage the investment committees?
Q.D.: The way to proceed changes a lot from a firm, team to another. Every fund of fund
team can proceed from another way. For example insurance fund of funds they have to
respect a strict allocation and they cannot bet on such and such macro event. We are free
to take some tactical bets regarding the market environment and we can use derivatives or
ETF. We play a lot with the tactical allocation of our different asset classes inside each fund.
You can either be a fund of fund which its only alpha source comes from the fund selection
(bottom up approach) or you can mix it with a dynamic allocation approach with technical
bets. It is rather our investment style with Mr. Jacques (the Head of the desk). It is really
driven by an allocation process. It is a way to generate some alpha. During the investment
committees we talk a lot about markets, economical factors and regarding that we build up
an asset allocation scheme.
Comment
We can regroup the ideas of this interview in categories:
i. the quantitative & screening process;
ii. the qualitative aspects;
But to sum up we can say that the understanding of the portfolio manager investment style
is the most important.
About the Quantitative Aspects, what is interesting is that they consider that the
quantitative analysis is poor in terms of added value. It is just a pre-requisite in order to go
further in the investment process. Almost everybody can run up a quantitative analysis and
pick up funds with the best ratios; but building a portfolio is not that simple by the simple
fact that returns are not persistent over time. Besides they outsource their databases to
Morning Star. They do not only focus on a particular ratio in an absolute way. They
compare the fund with their peers and firstly pick up the top quartile funds of them (mainly
according to the returns/volatility couple).
30
Screenshot of the Sample Quant analysis.pdf given by Edmond de Rothschild.
In the Sample Quant analysis.pdf they gave us, we can see that they also use a lot of rolling
ratio in order to know how these ratios react over time and especially during certain
market conditions. We can also notice that the half of it is about the excess return vs. the
benchmark, meaning that the benchmark is very important in the analysis of the fund. A
wrong benchmark can lead to misleading conclusions. In this kind of document it is easy to
see how the fund reacts in a particular market condition (in September 2008 or in August
2011). Is it sticking to its benchmark or generating abnormal returns?
Regarding Qualitative Aspects: once they get all these information and think that it is worth to
search deeper about the fund they contact the investor relationship of the asset
management fund and try to set a meeting with the PM, or an analyst of the fund. The
object of the meeting is to know if the PM, or the analyst, is coherent and give some trade
examples or trade ideas. So not only the performance in itself is a good indicator to
understand a fund before investing. The main question that has to be answered is “Are the
returns of the funds coherent with the strategy and/or with related asset class?” The PM
of the interview made a clear example with the short duration fund. The qualitative aspect
is as much important as a good Sharpe Ratio or a theoretical calculated alpha. Knowing the
composition of the portfolio is also an important part. With that you can know if the PM is
coherent with his strategy, and to know the liquidity of the underlying.
31
That is why they also proceed to the due diligence of funds. It fully belongs to the
investment process. The first thing to do is to check if the fund really exists, who are the
PMs, their backgrounds, their track records, the middle office and risk management
structure, the ownership structure, the liabilities structure of the fund (is it concentrated or
not: meaning that if it is very concentrated a withdrawing of a single big investor may have
some incidences toward the overall portfolio and therefore is a source of risk – especially if
it is not a very liquid asset class, such as small or mid-cap). All these aspects help to
understand if the fees are worth regarding the service provided.
2. Quantitative Analysis of 3 Funds
To complete this appendix focused on analysis of funds’ performance, we decided to go
more into practice. So we built up an Excel VBA tool in order to make an example of a
quantitative analysis of several funds having the same benchmark as if we were analysts for
a fund of funds. The data are from Bloomberg and weekly. Here is brief review of the main
characteristics of the quantitative analysis.
32
Brief description of the funds
The three funds that we have chosen to run our quantitative analysis are invested in DAX
stocks and have for objective to outperform the benchmark.
UIB5 GR EQUITY FRNKSPR GR EQUITY ADIGDEU GR EQUITY
UBS D Aktienfonds - Special I Frankfurter-Sparinvest Deka
Pioneer Investments Aktien
Deu
Bench A = DAX
We can see that the three funds underperform the benchmark and the performances seem
really correlated.
We can definitely see that they are different cluster in the volatility structure and the three
funds behave almost in the same way at the same time.
70
90
110
130
150
170
190
Frankfurter-Sparinvest Deka ADIGDEU GR EQUITY
Bench A UBS D Aktienfonds - Special I
0,00%
20,00%
40,00%
60,00%
14/01/200428/05/200510/10/200622/02/200806/07/200918/11/201001/04/201214/08/2013
Rolling 6 months Volatility
Pioneer Investments Aktien Deu UIB5 GR EQUITY FRNKSPR GR EQUITY
33
In the above chart, what we can see when we analyze the tracking error we can see a high
pick in September 2008. It goes up to 35% with the UBS funds. This means that at that time
this fund may have taken bet outside the benchmark and the PM must be interviewed
about this. In a normal period this funds has the lowest tracking error (between 10% and
5%) which makes the situation even stranger.
Generally the three fund do not generate a lot of alpha (between minus 20bps and
+20bps). We can see a huge destruction of alpha during the bankruptcy of Lehman
Brothers. The only fund which is sticking to an relative flat rolling alpha is the Pioneer. In
the Lehman crisis it did not destroy as much alpha as the other funds.
0,00%
5,00%
10,00%
15,00%
20,00%
25,00%
30,00%
35,00%
janv.-04 mai-05 oct.-06 févr.-08 juil.-09 nov.-10 avr.-12 août-13
Rolling 6 months Tracking Error
Pioneer Investments Aktien Deu FRNKSPR GR EQUITY UIB5 GR EQUITY
-1,00%
-0,80%
-0,60%
-0,40%
-0,20%
0,00%
0,20%
0,40%
janv.-04 mai-05 oct.-06 févr.-08 juil.-09 nov.-10 avr.-12 août-13
Rolling 6 months Alpha
Pioneer Investments Aktien Deu FRNKSPR GR EQUITY UIB5 GR EQUITY
34
The distribution of the three funds is closely the same. We can see that funds have negative
skew by the shape of the bell. The tails of the index are fatter especially the -8%.
0
20
40
60
80
100
120
-0,1 -0,08 -0,06 -0,04 -0,02 0 0,02 0,04 0,06 0,08 0,1
Weekly Return Distribution
Pioneer Investments Aktien Deu Index
UIB5 GR EQUITY FRNKSPR GR EQUITY
35
When we analyze the different ratio below added to the previous comment it comes clearly
that the Pionneer fund is the best of the three:
- Higher Sharpe Ratio;
- Lower MDD;
- Lower Skew.

Mais conteúdo relacionado

Mais procurados

Investment portfolio ppt
Investment portfolio pptInvestment portfolio ppt
Investment portfolio pptsupriyanayyar
 
Investment management intro
Investment management   introInvestment management   intro
Investment management introAhmed Zaidi, CMA
 
Investment Analysis and Portfolio Management
Investment Analysis and Portfolio ManagementInvestment Analysis and Portfolio Management
Investment Analysis and Portfolio ManagementBabasab Patil
 
Portfolio mangement
Portfolio mangementPortfolio mangement
Portfolio mangementPolite Man
 
Investment analysis and portfolio management
Investment analysis and portfolio managementInvestment analysis and portfolio management
Investment analysis and portfolio managementAkshay Kumar
 
Introduction to investment
Introduction to investmentIntroduction to investment
Introduction to investmentNandhakumar M
 
Net assets value of mutual fund
Net assets value of mutual fundNet assets value of mutual fund
Net assets value of mutual fundYashika Vashistha
 
Overview of Asset Management Firms
Overview of Asset Management Firms Overview of Asset Management Firms
Overview of Asset Management Firms Floyd Saunders
 
Investment Planning
Investment PlanningInvestment Planning
Investment PlanningJohn Daniel
 
Net Asset Value (NAV)
Net Asset Value (NAV)Net Asset Value (NAV)
Net Asset Value (NAV)SaraCooper161
 
portfolio management PPT
portfolio management PPTportfolio management PPT
portfolio management PPTShruti Mohan
 
Portfolio management
Portfolio managementPortfolio management
Portfolio managementkarishma
 
Unit 1 introduction to investment &amp; portfolio management
Unit 1 introduction to investment &amp; portfolio managementUnit 1 introduction to investment &amp; portfolio management
Unit 1 introduction to investment &amp; portfolio managementShaik Mohammad Imran
 
6. portfolio revision
6. portfolio revision6. portfolio revision
6. portfolio revisionAkash Bakshi
 
Investment management
Investment managementInvestment management
Investment managementDrAshaK1
 
Investment management
Investment managementInvestment management
Investment managementRajThakuri
 
Chapter 1 introduction to investment
Chapter 1 introduction to investmentChapter 1 introduction to investment
Chapter 1 introduction to investmentSuhairi Yunus
 

Mais procurados (19)

Investment portfolio ppt
Investment portfolio pptInvestment portfolio ppt
Investment portfolio ppt
 
Investment management intro
Investment management   introInvestment management   intro
Investment management intro
 
Investment Analysis and Portfolio Management
Investment Analysis and Portfolio ManagementInvestment Analysis and Portfolio Management
Investment Analysis and Portfolio Management
 
Portfolio mangement
Portfolio mangementPortfolio mangement
Portfolio mangement
 
Investment analysis and portfolio management
Investment analysis and portfolio managementInvestment analysis and portfolio management
Investment analysis and portfolio management
 
Introduction to investment
Introduction to investmentIntroduction to investment
Introduction to investment
 
An introduction to investment
An introduction to investmentAn introduction to investment
An introduction to investment
 
Net assets value of mutual fund
Net assets value of mutual fundNet assets value of mutual fund
Net assets value of mutual fund
 
Overview of Asset Management Firms
Overview of Asset Management Firms Overview of Asset Management Firms
Overview of Asset Management Firms
 
Investment Planning
Investment PlanningInvestment Planning
Investment Planning
 
Net Asset Value (NAV)
Net Asset Value (NAV)Net Asset Value (NAV)
Net Asset Value (NAV)
 
portfolio management PPT
portfolio management PPTportfolio management PPT
portfolio management PPT
 
Portfolio management
Portfolio managementPortfolio management
Portfolio management
 
Unit 1 introduction to investment &amp; portfolio management
Unit 1 introduction to investment &amp; portfolio managementUnit 1 introduction to investment &amp; portfolio management
Unit 1 introduction to investment &amp; portfolio management
 
6. portfolio revision
6. portfolio revision6. portfolio revision
6. portfolio revision
 
Concept of mutual fund
Concept of mutual fundConcept of mutual fund
Concept of mutual fund
 
Investment management
Investment managementInvestment management
Investment management
 
Investment management
Investment managementInvestment management
Investment management
 
Chapter 1 introduction to investment
Chapter 1 introduction to investmentChapter 1 introduction to investment
Chapter 1 introduction to investment
 

Destaque

A L BÚ M D E L P A R Q U E E C O LÓ G I C O
A L BÚ M  D E L  P A R Q U E  E C O LÓ G I C OA L BÚ M  D E L  P A R Q U E  E C O LÓ G I C O
A L BÚ M D E L P A R Q U E E C O LÓ G I C OBAT007
 
Teaching disgrace using Second Life
Teaching disgrace using Second LifeTeaching disgrace using Second Life
Teaching disgrace using Second Lifemediaplaylab
 
NMiEF 2011 - Toy or Tool: Using Mobile Devices & QR (Quick Response) Codes i...
NMiEF 2011 -  Toy or Tool: Using Mobile Devices & QR (Quick Response) Codes i...NMiEF 2011 -  Toy or Tool: Using Mobile Devices & QR (Quick Response) Codes i...
NMiEF 2011 - Toy or Tool: Using Mobile Devices & QR (Quick Response) Codes i...mediaplaylab
 
The Future in designing for the sex(es)
The Future in designing for the sex(es)The Future in designing for the sex(es)
The Future in designing for the sex(es)Cathy Wang
 
Balançar letroca 04
Balançar letroca 04Balançar letroca 04
Balançar letroca 04sansampa
 
Licentierea Software
Licentierea SoftwareLicentierea Software
Licentierea Softwaredianaifrim
 
Exposure Lecture 2014 - Tamil Language
Exposure Lecture 2014 - Tamil LanguageExposure Lecture 2014 - Tamil Language
Exposure Lecture 2014 - Tamil Languagemediaplaylab
 
Exposure Lecture 2014 - Literature
Exposure Lecture 2014 - LiteratureExposure Lecture 2014 - Literature
Exposure Lecture 2014 - Literaturemediaplaylab
 
Video Paper Builder
Video Paper BuilderVideo Paper Builder
Video Paper Buildermediaplaylab
 
RX for Fundraising in Hard Times
RX for Fundraising in Hard TimesRX for Fundraising in Hard Times
RX for Fundraising in Hard Timesguest5c1e21
 
Picture This: Better Visuals for Your WordPress Website
Picture This: Better Visuals for Your WordPress WebsitePicture This: Better Visuals for Your WordPress Website
Picture This: Better Visuals for Your WordPress WebsiteAaron Hockley
 
Социальное партнерство
Социальное партнерствоСоциальное партнерство
Социальное партнерствоACBE
 
Desitara-optimized-seo-plan-for-desitara-by-Shyam-Swaraj
Desitara-optimized-seo-plan-for-desitara-by-Shyam-SwarajDesitara-optimized-seo-plan-for-desitara-by-Shyam-Swaraj
Desitara-optimized-seo-plan-for-desitara-by-Shyam-SwarajEventXP
 
GuaridaAzul Community Platform
GuaridaAzul Community PlatformGuaridaAzul Community Platform
GuaridaAzul Community PlatformLooppa
 
After Launching a Couple Dozen Blogs, I Figured Out How To Do it Right
After Launching a Couple Dozen Blogs, I Figured Out How To Do it RightAfter Launching a Couple Dozen Blogs, I Figured Out How To Do it Right
After Launching a Couple Dozen Blogs, I Figured Out How To Do it RightAaron Hockley
 
朝鲜问题与形势分析
朝鲜问题与形势分析朝鲜问题与形势分析
朝鲜问题与形势分析volnet
 

Destaque (20)

A L BÚ M D E L P A R Q U E E C O LÓ G I C O
A L BÚ M  D E L  P A R Q U E  E C O LÓ G I C OA L BÚ M  D E L  P A R Q U E  E C O LÓ G I C O
A L BÚ M D E L P A R Q U E E C O LÓ G I C O
 
Teaching disgrace using Second Life
Teaching disgrace using Second LifeTeaching disgrace using Second Life
Teaching disgrace using Second Life
 
WTI - Recreational cycling and social media workshop slides
WTI - Recreational cycling and social media workshop slidesWTI - Recreational cycling and social media workshop slides
WTI - Recreational cycling and social media workshop slides
 
NMiEF 2011 - Toy or Tool: Using Mobile Devices & QR (Quick Response) Codes i...
NMiEF 2011 -  Toy or Tool: Using Mobile Devices & QR (Quick Response) Codes i...NMiEF 2011 -  Toy or Tool: Using Mobile Devices & QR (Quick Response) Codes i...
NMiEF 2011 - Toy or Tool: Using Mobile Devices & QR (Quick Response) Codes i...
 
The Future in designing for the sex(es)
The Future in designing for the sex(es)The Future in designing for the sex(es)
The Future in designing for the sex(es)
 
Balançar letroca 04
Balançar letroca 04Balançar letroca 04
Balançar letroca 04
 
Licentierea Software
Licentierea SoftwareLicentierea Software
Licentierea Software
 
Exposure Lecture 2014 - Tamil Language
Exposure Lecture 2014 - Tamil LanguageExposure Lecture 2014 - Tamil Language
Exposure Lecture 2014 - Tamil Language
 
Bbq Invitation
Bbq InvitationBbq Invitation
Bbq Invitation
 
Exposure Lecture 2014 - Literature
Exposure Lecture 2014 - LiteratureExposure Lecture 2014 - Literature
Exposure Lecture 2014 - Literature
 
Video Paper Builder
Video Paper BuilderVideo Paper Builder
Video Paper Builder
 
RX for Fundraising in Hard Times
RX for Fundraising in Hard TimesRX for Fundraising in Hard Times
RX for Fundraising in Hard Times
 
Picture This: Better Visuals for Your WordPress Website
Picture This: Better Visuals for Your WordPress WebsitePicture This: Better Visuals for Your WordPress Website
Picture This: Better Visuals for Your WordPress Website
 
Социальное партнерство
Социальное партнерствоСоциальное партнерство
Социальное партнерство
 
Desitara-optimized-seo-plan-for-desitara-by-Shyam-Swaraj
Desitara-optimized-seo-plan-for-desitara-by-Shyam-SwarajDesitara-optimized-seo-plan-for-desitara-by-Shyam-Swaraj
Desitara-optimized-seo-plan-for-desitara-by-Shyam-Swaraj
 
EPIC Plan Marketing
EPIC Plan MarketingEPIC Plan Marketing
EPIC Plan Marketing
 
Beyond the Mean
Beyond the MeanBeyond the Mean
Beyond the Mean
 
GuaridaAzul Community Platform
GuaridaAzul Community PlatformGuaridaAzul Community Platform
GuaridaAzul Community Platform
 
After Launching a Couple Dozen Blogs, I Figured Out How To Do it Right
After Launching a Couple Dozen Blogs, I Figured Out How To Do it RightAfter Launching a Couple Dozen Blogs, I Figured Out How To Do it Right
After Launching a Couple Dozen Blogs, I Figured Out How To Do it Right
 
朝鲜问题与形势分析
朝鲜问题与形势分析朝鲜问题与形势分析
朝鲜问题与形势分析
 

Semelhante a Performance of investment funds berhmani frigerio pan

Mutual Fund - Investment avenues.pdf
Mutual Fund - Investment avenues.pdfMutual Fund - Investment avenues.pdf
Mutual Fund - Investment avenues.pdfRanjitSingh211748
 
What-is-a-Mutual-Fund, description on Mutual funds aspects.pptx
What-is-a-Mutual-Fund, description on Mutual funds aspects.pptxWhat-is-a-Mutual-Fund, description on Mutual funds aspects.pptx
What-is-a-Mutual-Fund, description on Mutual funds aspects.pptxprashantrohit2002
 
The Mutual Fund Concept1. LG 12. LG 2Questions of which stoc.docx
The Mutual Fund Concept1. LG 12. LG 2Questions of which stoc.docxThe Mutual Fund Concept1. LG 12. LG 2Questions of which stoc.docx
The Mutual Fund Concept1. LG 12. LG 2Questions of which stoc.docxdennisa15
 
1672476656-22_mutual_funds_india_updated.pptx
1672476656-22_mutual_funds_india_updated.pptx1672476656-22_mutual_funds_india_updated.pptx
1672476656-22_mutual_funds_india_updated.pptxSAURAVNATH8
 
Mutual fund. doc
Mutual fund. docMutual fund. doc
Mutual fund. docRaj Gupta
 
91506566 portfolio-management-process-of-a-financial-institution
91506566 portfolio-management-process-of-a-financial-institution91506566 portfolio-management-process-of-a-financial-institution
91506566 portfolio-management-process-of-a-financial-institutionMuhammad Waseem
 
Analysis and explanation of various investment options in India
Analysis and explanation of various investment options in IndiaAnalysis and explanation of various investment options in India
Analysis and explanation of various investment options in Indiaumang22
 
abi mutul fundcprint.doc
abi mutul fundcprint.docabi mutul fundcprint.doc
abi mutul fundcprint.docSubhash Bajaj
 
Study on Mutual Fund is the Better Investment Plan
Study on Mutual Fund is the Better Investment PlanStudy on Mutual Fund is the Better Investment Plan
Study on Mutual Fund is the Better Investment PlanProjects Kart
 
Mutual Funds, Mutual Fund Basics, Types of Mutual Funds, Mutual Fund Investm...
Mutual Funds, Mutual Fund Basics, Types of Mutual Funds,  Mutual Fund Investm...Mutual Funds, Mutual Fund Basics, Types of Mutual Funds,  Mutual Fund Investm...
Mutual Funds, Mutual Fund Basics, Types of Mutual Funds, Mutual Fund Investm...SaraCooper161
 
I fund brochure
I fund brochure I fund brochure
I fund brochure Mark Micek
 
comparative study on mutual fund
comparative study on mutual fundcomparative study on mutual fund
comparative study on mutual fundnitesh tandon
 
Mutual fund is the better investment plan
Mutual fund is the better investment planMutual fund is the better investment plan
Mutual fund is the better investment planProjects Kart
 
Bilaspur_28042017fortheimportanceofmutualfundinindia.ppt
Bilaspur_28042017fortheimportanceofmutualfundinindia.pptBilaspur_28042017fortheimportanceofmutualfundinindia.ppt
Bilaspur_28042017fortheimportanceofmutualfundinindia.pptcoolgamelover95
 
ms mutual fund.ppt
ms mutual fund.pptms mutual fund.ppt
ms mutual fund.pptSahidKhan61
 

Semelhante a Performance of investment funds berhmani frigerio pan (20)

Pranav kapse sip
Pranav kapse sipPranav kapse sip
Pranav kapse sip
 
Pranav kapse sip
Pranav kapse sipPranav kapse sip
Pranav kapse sip
 
Mutual Fund - Investment avenues.pdf
Mutual Fund - Investment avenues.pdfMutual Fund - Investment avenues.pdf
Mutual Fund - Investment avenues.pdf
 
What-is-a-Mutual-Fund, description on Mutual funds aspects.pptx
What-is-a-Mutual-Fund, description on Mutual funds aspects.pptxWhat-is-a-Mutual-Fund, description on Mutual funds aspects.pptx
What-is-a-Mutual-Fund, description on Mutual funds aspects.pptx
 
The Mutual Fund Concept1. LG 12. LG 2Questions of which stoc.docx
The Mutual Fund Concept1. LG 12. LG 2Questions of which stoc.docxThe Mutual Fund Concept1. LG 12. LG 2Questions of which stoc.docx
The Mutual Fund Concept1. LG 12. LG 2Questions of which stoc.docx
 
1672476656-22_mutual_funds_india_updated.pptx
1672476656-22_mutual_funds_india_updated.pptx1672476656-22_mutual_funds_india_updated.pptx
1672476656-22_mutual_funds_india_updated.pptx
 
Mutual fund. doc
Mutual fund. docMutual fund. doc
Mutual fund. doc
 
91506566 portfolio-management-process-of-a-financial-institution
91506566 portfolio-management-process-of-a-financial-institution91506566 portfolio-management-process-of-a-financial-institution
91506566 portfolio-management-process-of-a-financial-institution
 
Analysis and explanation of various investment options in India
Analysis and explanation of various investment options in IndiaAnalysis and explanation of various investment options in India
Analysis and explanation of various investment options in India
 
abi mutul fundcprint.doc
abi mutul fundcprint.docabi mutul fundcprint.doc
abi mutul fundcprint.doc
 
Study on Mutual Fund is the Better Investment Plan
Study on Mutual Fund is the Better Investment PlanStudy on Mutual Fund is the Better Investment Plan
Study on Mutual Fund is the Better Investment Plan
 
Mutual Funds, Mutual Fund Basics, Types of Mutual Funds, Mutual Fund Investm...
Mutual Funds, Mutual Fund Basics, Types of Mutual Funds,  Mutual Fund Investm...Mutual Funds, Mutual Fund Basics, Types of Mutual Funds,  Mutual Fund Investm...
Mutual Funds, Mutual Fund Basics, Types of Mutual Funds, Mutual Fund Investm...
 
Mutual fund
Mutual fundMutual fund
Mutual fund
 
I fund brochure
I fund brochure I fund brochure
I fund brochure
 
comparative study on mutual fund
comparative study on mutual fundcomparative study on mutual fund
comparative study on mutual fund
 
Mutual fund is the better investment plan
Mutual fund is the better investment planMutual fund is the better investment plan
Mutual fund is the better investment plan
 
Bilaspur_28042017fortheimportanceofmutualfundinindia.ppt
Bilaspur_28042017fortheimportanceofmutualfundinindia.pptBilaspur_28042017fortheimportanceofmutualfundinindia.ppt
Bilaspur_28042017fortheimportanceofmutualfundinindia.ppt
 
MUTUAL FUND ICCMAI BILSPUR.pptx
MUTUAL FUND  ICCMAI BILSPUR.pptxMUTUAL FUND  ICCMAI BILSPUR.pptx
MUTUAL FUND ICCMAI BILSPUR.pptx
 
Mutual fund.ppt
Mutual fund.pptMutual fund.ppt
Mutual fund.ppt
 
ms mutual fund.ppt
ms mutual fund.pptms mutual fund.ppt
ms mutual fund.ppt
 

Último

High Class Call Girls Nashik Maya 7001305949 Independent Escort Service Nashik
High Class Call Girls Nashik Maya 7001305949 Independent Escort Service NashikHigh Class Call Girls Nashik Maya 7001305949 Independent Escort Service Nashik
High Class Call Girls Nashik Maya 7001305949 Independent Escort Service NashikCall Girls in Nagpur High Profile
 
(DIYA) Bhumkar Chowk Call Girls Just Call 7001035870 [ Cash on Delivery ] Pun...
(DIYA) Bhumkar Chowk Call Girls Just Call 7001035870 [ Cash on Delivery ] Pun...(DIYA) Bhumkar Chowk Call Girls Just Call 7001035870 [ Cash on Delivery ] Pun...
(DIYA) Bhumkar Chowk Call Girls Just Call 7001035870 [ Cash on Delivery ] Pun...ranjana rawat
 
Solution Manual for Financial Accounting, 11th Edition by Robert Libby, Patri...
Solution Manual for Financial Accounting, 11th Edition by Robert Libby, Patri...Solution Manual for Financial Accounting, 11th Edition by Robert Libby, Patri...
Solution Manual for Financial Accounting, 11th Edition by Robert Libby, Patri...ssifa0344
 
05_Annelore Lenoir_Docbyte_MeetupDora&Cybersecurity.pptx
05_Annelore Lenoir_Docbyte_MeetupDora&Cybersecurity.pptx05_Annelore Lenoir_Docbyte_MeetupDora&Cybersecurity.pptx
05_Annelore Lenoir_Docbyte_MeetupDora&Cybersecurity.pptxFinTech Belgium
 
VIP Call Girls LB Nagar ( Hyderabad ) Phone 8250192130 | ₹5k To 25k With Room...
VIP Call Girls LB Nagar ( Hyderabad ) Phone 8250192130 | ₹5k To 25k With Room...VIP Call Girls LB Nagar ( Hyderabad ) Phone 8250192130 | ₹5k To 25k With Room...
VIP Call Girls LB Nagar ( Hyderabad ) Phone 8250192130 | ₹5k To 25k With Room...Suhani Kapoor
 
Call Girls Koregaon Park Call Me 7737669865 Budget Friendly No Advance Booking
Call Girls Koregaon Park Call Me 7737669865 Budget Friendly No Advance BookingCall Girls Koregaon Park Call Me 7737669865 Budget Friendly No Advance Booking
Call Girls Koregaon Park Call Me 7737669865 Budget Friendly No Advance Bookingroncy bisnoi
 
The Economic History of the U.S. Lecture 26.pdf
The Economic History of the U.S. Lecture 26.pdfThe Economic History of the U.S. Lecture 26.pdf
The Economic History of the U.S. Lecture 26.pdfGale Pooley
 
20240429 Calibre April 2024 Investor Presentation.pdf
20240429 Calibre April 2024 Investor Presentation.pdf20240429 Calibre April 2024 Investor Presentation.pdf
20240429 Calibre April 2024 Investor Presentation.pdfAdnet Communications
 
WhatsApp 📞 Call : 9892124323 ✅Call Girls In Chembur ( Mumbai ) secure service
WhatsApp 📞 Call : 9892124323  ✅Call Girls In Chembur ( Mumbai ) secure serviceWhatsApp 📞 Call : 9892124323  ✅Call Girls In Chembur ( Mumbai ) secure service
WhatsApp 📞 Call : 9892124323 ✅Call Girls In Chembur ( Mumbai ) secure servicePooja Nehwal
 
Booking open Available Pune Call Girls Wadgaon Sheri 6297143586 Call Hot Ind...
Booking open Available Pune Call Girls Wadgaon Sheri  6297143586 Call Hot Ind...Booking open Available Pune Call Girls Wadgaon Sheri  6297143586 Call Hot Ind...
Booking open Available Pune Call Girls Wadgaon Sheri 6297143586 Call Hot Ind...Call Girls in Nagpur High Profile
 
Malad Call Girl in Services 9892124323 | ₹,4500 With Room Free Delivery
Malad Call Girl in Services  9892124323 | ₹,4500 With Room Free DeliveryMalad Call Girl in Services  9892124323 | ₹,4500 With Room Free Delivery
Malad Call Girl in Services 9892124323 | ₹,4500 With Room Free DeliveryPooja Nehwal
 
The Economic History of the U.S. Lecture 18.pdf
The Economic History of the U.S. Lecture 18.pdfThe Economic History of the U.S. Lecture 18.pdf
The Economic History of the U.S. Lecture 18.pdfGale Pooley
 
03_Emmanuel Ndiaye_Degroof Petercam.pptx
03_Emmanuel Ndiaye_Degroof Petercam.pptx03_Emmanuel Ndiaye_Degroof Petercam.pptx
03_Emmanuel Ndiaye_Degroof Petercam.pptxFinTech Belgium
 
Top Rated Pune Call Girls Viman Nagar ⟟ 6297143586 ⟟ Call Me For Genuine Sex...
Top Rated  Pune Call Girls Viman Nagar ⟟ 6297143586 ⟟ Call Me For Genuine Sex...Top Rated  Pune Call Girls Viman Nagar ⟟ 6297143586 ⟟ Call Me For Genuine Sex...
Top Rated Pune Call Girls Viman Nagar ⟟ 6297143586 ⟟ Call Me For Genuine Sex...Call Girls in Nagpur High Profile
 
00_Main ppt_MeetupDORA&CyberSecurity.pptx
00_Main ppt_MeetupDORA&CyberSecurity.pptx00_Main ppt_MeetupDORA&CyberSecurity.pptx
00_Main ppt_MeetupDORA&CyberSecurity.pptxFinTech Belgium
 
Solution Manual for Principles of Corporate Finance 14th Edition by Richard B...
Solution Manual for Principles of Corporate Finance 14th Edition by Richard B...Solution Manual for Principles of Corporate Finance 14th Edition by Richard B...
Solution Manual for Principles of Corporate Finance 14th Edition by Richard B...ssifa0344
 
CALL ON ➥8923113531 🔝Call Girls Gomti Nagar Lucknow best sexual service
CALL ON ➥8923113531 🔝Call Girls Gomti Nagar Lucknow best sexual serviceCALL ON ➥8923113531 🔝Call Girls Gomti Nagar Lucknow best sexual service
CALL ON ➥8923113531 🔝Call Girls Gomti Nagar Lucknow best sexual serviceanilsa9823
 
VIP Call Girls Service Dilsukhnagar Hyderabad Call +91-8250192130
VIP Call Girls Service Dilsukhnagar Hyderabad Call +91-8250192130VIP Call Girls Service Dilsukhnagar Hyderabad Call +91-8250192130
VIP Call Girls Service Dilsukhnagar Hyderabad Call +91-8250192130Suhani Kapoor
 

Último (20)

High Class Call Girls Nashik Maya 7001305949 Independent Escort Service Nashik
High Class Call Girls Nashik Maya 7001305949 Independent Escort Service NashikHigh Class Call Girls Nashik Maya 7001305949 Independent Escort Service Nashik
High Class Call Girls Nashik Maya 7001305949 Independent Escort Service Nashik
 
(DIYA) Bhumkar Chowk Call Girls Just Call 7001035870 [ Cash on Delivery ] Pun...
(DIYA) Bhumkar Chowk Call Girls Just Call 7001035870 [ Cash on Delivery ] Pun...(DIYA) Bhumkar Chowk Call Girls Just Call 7001035870 [ Cash on Delivery ] Pun...
(DIYA) Bhumkar Chowk Call Girls Just Call 7001035870 [ Cash on Delivery ] Pun...
 
Solution Manual for Financial Accounting, 11th Edition by Robert Libby, Patri...
Solution Manual for Financial Accounting, 11th Edition by Robert Libby, Patri...Solution Manual for Financial Accounting, 11th Edition by Robert Libby, Patri...
Solution Manual for Financial Accounting, 11th Edition by Robert Libby, Patri...
 
05_Annelore Lenoir_Docbyte_MeetupDora&Cybersecurity.pptx
05_Annelore Lenoir_Docbyte_MeetupDora&Cybersecurity.pptx05_Annelore Lenoir_Docbyte_MeetupDora&Cybersecurity.pptx
05_Annelore Lenoir_Docbyte_MeetupDora&Cybersecurity.pptx
 
VIP Call Girls LB Nagar ( Hyderabad ) Phone 8250192130 | ₹5k To 25k With Room...
VIP Call Girls LB Nagar ( Hyderabad ) Phone 8250192130 | ₹5k To 25k With Room...VIP Call Girls LB Nagar ( Hyderabad ) Phone 8250192130 | ₹5k To 25k With Room...
VIP Call Girls LB Nagar ( Hyderabad ) Phone 8250192130 | ₹5k To 25k With Room...
 
Call Girls Koregaon Park Call Me 7737669865 Budget Friendly No Advance Booking
Call Girls Koregaon Park Call Me 7737669865 Budget Friendly No Advance BookingCall Girls Koregaon Park Call Me 7737669865 Budget Friendly No Advance Booking
Call Girls Koregaon Park Call Me 7737669865 Budget Friendly No Advance Booking
 
The Economic History of the U.S. Lecture 26.pdf
The Economic History of the U.S. Lecture 26.pdfThe Economic History of the U.S. Lecture 26.pdf
The Economic History of the U.S. Lecture 26.pdf
 
20240429 Calibre April 2024 Investor Presentation.pdf
20240429 Calibre April 2024 Investor Presentation.pdf20240429 Calibre April 2024 Investor Presentation.pdf
20240429 Calibre April 2024 Investor Presentation.pdf
 
WhatsApp 📞 Call : 9892124323 ✅Call Girls In Chembur ( Mumbai ) secure service
WhatsApp 📞 Call : 9892124323  ✅Call Girls In Chembur ( Mumbai ) secure serviceWhatsApp 📞 Call : 9892124323  ✅Call Girls In Chembur ( Mumbai ) secure service
WhatsApp 📞 Call : 9892124323 ✅Call Girls In Chembur ( Mumbai ) secure service
 
Booking open Available Pune Call Girls Wadgaon Sheri 6297143586 Call Hot Ind...
Booking open Available Pune Call Girls Wadgaon Sheri  6297143586 Call Hot Ind...Booking open Available Pune Call Girls Wadgaon Sheri  6297143586 Call Hot Ind...
Booking open Available Pune Call Girls Wadgaon Sheri 6297143586 Call Hot Ind...
 
Malad Call Girl in Services 9892124323 | ₹,4500 With Room Free Delivery
Malad Call Girl in Services  9892124323 | ₹,4500 With Room Free DeliveryMalad Call Girl in Services  9892124323 | ₹,4500 With Room Free Delivery
Malad Call Girl in Services 9892124323 | ₹,4500 With Room Free Delivery
 
The Economic History of the U.S. Lecture 18.pdf
The Economic History of the U.S. Lecture 18.pdfThe Economic History of the U.S. Lecture 18.pdf
The Economic History of the U.S. Lecture 18.pdf
 
03_Emmanuel Ndiaye_Degroof Petercam.pptx
03_Emmanuel Ndiaye_Degroof Petercam.pptx03_Emmanuel Ndiaye_Degroof Petercam.pptx
03_Emmanuel Ndiaye_Degroof Petercam.pptx
 
Top Rated Pune Call Girls Viman Nagar ⟟ 6297143586 ⟟ Call Me For Genuine Sex...
Top Rated  Pune Call Girls Viman Nagar ⟟ 6297143586 ⟟ Call Me For Genuine Sex...Top Rated  Pune Call Girls Viman Nagar ⟟ 6297143586 ⟟ Call Me For Genuine Sex...
Top Rated Pune Call Girls Viman Nagar ⟟ 6297143586 ⟟ Call Me For Genuine Sex...
 
00_Main ppt_MeetupDORA&CyberSecurity.pptx
00_Main ppt_MeetupDORA&CyberSecurity.pptx00_Main ppt_MeetupDORA&CyberSecurity.pptx
00_Main ppt_MeetupDORA&CyberSecurity.pptx
 
(INDIRA) Call Girl Mumbai Call Now 8250077686 Mumbai Escorts 24x7
(INDIRA) Call Girl Mumbai Call Now 8250077686 Mumbai Escorts 24x7(INDIRA) Call Girl Mumbai Call Now 8250077686 Mumbai Escorts 24x7
(INDIRA) Call Girl Mumbai Call Now 8250077686 Mumbai Escorts 24x7
 
Solution Manual for Principles of Corporate Finance 14th Edition by Richard B...
Solution Manual for Principles of Corporate Finance 14th Edition by Richard B...Solution Manual for Principles of Corporate Finance 14th Edition by Richard B...
Solution Manual for Principles of Corporate Finance 14th Edition by Richard B...
 
CALL ON ➥8923113531 🔝Call Girls Gomti Nagar Lucknow best sexual service
CALL ON ➥8923113531 🔝Call Girls Gomti Nagar Lucknow best sexual serviceCALL ON ➥8923113531 🔝Call Girls Gomti Nagar Lucknow best sexual service
CALL ON ➥8923113531 🔝Call Girls Gomti Nagar Lucknow best sexual service
 
VIP Call Girls Service Dilsukhnagar Hyderabad Call +91-8250192130
VIP Call Girls Service Dilsukhnagar Hyderabad Call +91-8250192130VIP Call Girls Service Dilsukhnagar Hyderabad Call +91-8250192130
VIP Call Girls Service Dilsukhnagar Hyderabad Call +91-8250192130
 
Veritas Interim Report 1 January–31 March 2024
Veritas Interim Report 1 January–31 March 2024Veritas Interim Report 1 January–31 March 2024
Veritas Interim Report 1 January–31 March 2024
 

Performance of investment funds berhmani frigerio pan

  • 1. Performance of Investment Funds Master of Finance – Capital Markets Asset Management Lecturer: Prof. Dr. Sikandar Siddiqui Program: Master of Finance Course: Asset Management Students: Samuel Berhmani 4906129 Paolo Frigerio 4915418 Hong Pan 4915918
  • 2. Abstract Nowadays Mutual Funds are the most important type of Investment Company in the world. According to the “2012 Investment Company Fact Book” by the Investment Company Institute, at the end of 2011 the value of the Worldwide Total Nets Assets of Mutual Funds was $23,779,874,000, managed by a total number of 72,657 Mutual Funds. Despite the strong financial crisis that is hurting globally the financial markets in these last years, and the challenge of competing investment products like ETFs, the industry of Mutual Fund seems quite healthy: the AUM declined slightly from 2010, but the trend has remained positive and the number of funds is increasing1 . In this framework, it is always important and relevant understand if in the end this kind of investment succeeds to add value to the investors, or instead is not able to give an adequate level of return that compensate all the risk investors bear. This task is particularly relevant when we consider actively managed Mutual Funds. Managers of these types of Funds have the ambition to beat the market but, as has been often showed by empirical studies, they rarely succeed in their efforts. In our study, after a first general overview of Mutual Funds’ characteristics and a short comparison between them and ETFs, we present the results of the most important empirical studies regarding the performance of the Mutual Funds and the persistence over time of this performance. Usually, these studies investigate the ability of the managers to earn excess returns, and the persistence of this ability over time: this last point in fundamental to assess if a fund has beaten the market thanks to the skill of his managers or simply due to luck. These studies have given interesting outcomes most of the time in line with the Efficient Market Hypothesis (EMH). After the review of the existing literature on the subject, we go deeper about the traditional measures used by the researchers and by the professionals in order to evaluate the risk-adjusted returns (Sharpe ratio, Treynor ratio, Jensen measure, Information ratio, The Fama and French 3 Factors Model, The Carhart 4 Factors Model) and we look also at the problems that could arise in the use of these measures. Then we focus our attention on some more practical aspects: firstly, we run a style analysis to see if the returns in our sample of actively managed funds are effectively correlated with their funds’ benchmark, and if they are correlated by what amount. Style analysis is also 1 “2012 Investment Company Fact Book”, Investment Company Institute, 2012.
  • 3. another possible way to evaluate the performance of a fund. Secondly, we try to select some funds that seem able to outperform their benchmarks over a period of time, and we try to run a performance attribution analysis in order to understand where the added value comes from. In addition to this analysis, we use others two methods, the return decompositions and the market models method, with the purpose to get a deeper knowledge of the performance, and so about the real ability of the fund’ managers. We conclude our work with an interview with a professional portfolio manager. He has explained us all the tools that he uses in real life in order to select better funds: we have tried to use them to run a complete quantitative analysis on several funds. This last part of the work is presented in the Appendix.
  • 4. 1 1. Investment Funds: the case of mutual funds. a. Investment Funds: general definition and case of Mutual Funds Investment companies are financial intermediaries that collect funds from individual investors and invest, at an aggregate level, those funds in securities or other assets. In general Investment companies fulfill several important functions for their investors: I. Diversification and divisibility. Investment companies pool together the money raised from many investors and enable them to act as a unique large investor. They build up a well-diversified portfolio. Small investors could benefit from diversification (as we know diversification implies lower risk because enable us to avoid the idiosyncratic risk) because they could not do that at a personal level. Single investor holds a fraction of the large portfolio (ownership is proportional to the number of shares purchased). II. Professional management. Investment companies have securities analysts and portfolio managers who professionally attempt to achieve superior investment results for their investors. III. Lower transaction costs. Investment companies trade large blocks of securities, and so they can get substantial savings on brokerage fees and commissions: they benefit from economy of scale. Moreover, investment companies keep track of capital gains distributions, dividends, investment and redemptions, and they also may reinvest dividends and interest for shareholders. The market value of an investment fund is given by the product between the NAV of the fund itself and the number of shares outstanding. The Net Asset Value (NAV) is the market value of the assets hold by the funds minus the market value of the liabilities of the fund. The NAV is expressed on a per share basis: 𝑁𝐴𝑉 = 𝐴𝑠𝑠𝑒𝑡𝑠 − 𝐿𝑖𝑎𝑏𝑖𝑙𝑖𝑡𝑖𝑒𝑠 𝑁𝑟. 𝑜𝑓 𝑆ℎ𝑎𝑟𝑒𝑠 𝑂𝑢𝑡𝑠𝑡𝑎𝑛𝑑𝑖𝑛𝑔 So, the NAV is the value of each share. Open-end funds stand ready to issue or redeem shares at their NAV: investors buy shares of the fund directly by the fund at current NAV, and when they want to close their investment position they simply sell back shares to the fund at NAV. So the number of outstanding shares of these funds changes daily. By contrast, close-end funds do not redeem or issue shares: investors in these funds operate on exchange, and often prices could depart from the actual current NAV. The rate of return of the fund equals the gross return on the underlying portfolio minus the total expense ratio. As we will see, expenses can have a big impact on the performance of the portfolio. 𝑅𝑎𝑡𝑒 𝑜𝑓 𝑅𝑒𝑡𝑢𝑟𝑛 = (𝑁𝐴𝑉1 − 𝑁𝐴𝑉0 + 𝐼𝑛𝑐𝑜𝑚𝑒 𝑎𝑛𝑑 𝐶𝑎𝑝𝑖𝑡𝑎𝑙 𝐺𝑎𝑖𝑛𝑠 𝑑𝑖𝑠𝑡𝑟𝑖𝑏𝑢𝑡𝑖𝑜𝑛𝑠) 𝑁𝐴𝑉0 Several kinds of investment companies exist: Unit Investment Trusts, Open-end Funds, Close-end Funds, Commingled Funds, Real Estate Investment Trusts and Hedge Funds. The most common type between these is the Open-end Fund. They are commonly called
  • 5. 2 Mutual Funds. As we have pointed out in the introduction, according to the “2012 Investment Company Fact Book” by the Investment Company Institute, at the end of 2011 the value of the Worldwide Total Nets Assets of Mutual Funds was $23,779,874,000, managed by a total number of 72,657 Mutual Funds2 . They are accounting for more than 90% of investment funds’ assets3 . Moreover, the most part of academic articles concerning the evaluation of the performance of investment funds are written about mutual funds. This is why we have focused our attention only on this particular investment company. Each mutual fund, according with its specific investment policy described in the fund’s prospectus, can be classified in one of the subcategories traditionally used to differentiate mutual funds. Money Market Funds invest in money market securities such as commercial paper, repurchase agreements and certificates of deposit. The average maturity of these assets tends to be a bit more than 1 month. Often they offer check-writing features. Bond Funds are specialized in fixed-income sector. Further possible specializations are funds that invest in specific kind of bonds according with the type of issuer: corporate bonds, Government bonds, mortgage-back securities. It’s also observable specialization by credit risk of the issuer (from safe to high yield) and by maturity: short term, intermediate, long term. Equity Funds invest primarily in stock, although they may hold fixed-income or other types of securities. Usually they hold between 4% and 5% of total assets in money market securities to provide liquidity necessary to meet potential redemption of shares. Common subclass of equity funds are Income Funds, which tend to hold stock with high dividend yields, and Growth Funds, which are focusing on prospects for capital gains. Sector Funds are equity funds concentrate on a particular industry (utilities, banks, telecommunications), or funds specialize in securities of particular country. International Funds have a geographical focus: Global funds invest in securities worldwide, Regional funds invest in a particular part of the world, Emerging markets funds invest in companies of developing nations. Balance Funds hold both equity and fixed income securities in a relatively stable proportions. Asset Allocation and Flexible Funds hold both stocks and bonds, but the asset allocation may vary dramatically in accord with the portfolio’s manager forecast of the relative performance of each sector. Typically they are engaged in market timing and are not a low risk profile investment vehicle. Index Funds try to match the performance of a market index replicating the composition of the market index. It is a passive investment strategy: to invest without engaging in security analysis. They can be tied on non-equity index as well. Fund of Funds hold a portfolio of other investment funds rather than investing directly in stocks, bonds or other securities. A FoF manager aims to select the best performing funds to invest in based upon the managers past performance. Quant Funds select securities based on quantitative analysis. Managers build computer-based models to determine whether an investment is attractive, thus the final decision to buy or sell is made by this model. Investing in mutual funds presents some costs. These costs can vary a lot across different types of funds: typically, the more the investment policy is complex, the higher are the costs charged to investors. Usually, investors face operating expenses, namely costs incurred by the mutual fund in the operating the portfolio (including administrative 2 “2012 Investment Company Fact Book”, Investment Company Institute, 2012. 3 “Investments”, Zvi Bodie, Alex Kane, Alan J. Marcus, 9th edition, 2011, McGraw-Hill/Irwin.
  • 6. 3 expenses and advisory fees paid to the investment manager). They are expressed as a percentage of the total Asset Under Management (AUM), may range from 0.2% to 2%. They are not explicit, but they are periodically deducted from the assets of the fund. If investors buy the shares of the fund by brokers, they can incur also marketing and distribution costs not accounted in the operating expenses. In addition, some funds charge front-end load: it is a commission paid when investors buy the shares. Loads reduce the amount of money invested, typically they are in average around 5% (rarely are higher than 6%). Instead back- end load is a redemption (or “exit”) fee incurred when investors sell their shares: funds that charge it typically start at 6% and then reduce it by 1% for every year the funds are left invested. Furthermore, some funds charge also distribution and marketing costs: they are not explicit, but are periodically deducted from the assets of the fund. They are limited to 1% of the fund’s NAV per year. The sum of operating expenses and distribution and marketing costs give us the annual total expense ratio (TER) of the fund: TER is the measure of the total cost of a fund to the investor. Not included in the TER are transactions costs (for trading activities) and performance fees. Taxation on mutual funds can cause disadvantages to individual investors. Indeed, under the U.S. tax code, taxes on income from mutual funds are directly paid by investor: capital gains and dividends are passed through to investors as though the investor earned the income directly. The disadvantage for the investors is that they cannot control the timing of the sale of securities from the portfolio: this reduces their ability to engage in tax management. This disadvantage is even stronger if the fund experiences high portfolio turnover rate: high turnover means that capital gains or losses are being realized constantly and hence that the investor cannot time the realizations to manage his overall tax obligation. Turnover is the ratio of the trading activity of a portfolio to the assets of the portfolio. It measures the fraction of the portfolio that is replaced each year. Low turnover fund, such as index fund, may have a turnover as low as 2%, which is both tax efficient and economical with respect to trading costs. A fund with a high portfolio turnover rate can be particularly “tax inefficient”. b. Exchange Traded Funds (ETFs) ETFs are open-end funds. They allow investors to trade index portfolio just as they do with shares of stock. Their investment purpose is similar to the one of index funds, but they are characterized by a completely passive strategy of replication. Nowadays the industry of ETFs is well developed: as we can see from the chart below, at the end of January 2011 globally the number of ETFs was 2,501, for an AUM equal to 1,334.6 billion of US dollar. They do not undermine the supremacy of actively managed funds yet, but all the forecasts say that in the future the market share of ETFs will be more and more relevant4 . 4 BlackRock. “ETF LandScape. Industry Review”, end January 2011.
  • 7. 4 As for common mutual funds, also for ETFs we can distinguish different classes regarding to the investment object: there are ETFs with Equity index (international, single country, industry) as benchmark, but also ETFs on bonds index or on commodities exist. In the last period the industry is developing actively managed ETF funds that attempt to outperform market indexes (but they count for less than 1% of AUM in the ETFs industry, at the moment they are not relevant). ETFs present some relevant advantages over conventional Mutual Funds: • Mutual fund’s NAV is quoted only once a day; instead ETFs trade continuously (in every moment during the day you can know the value of your investment), and like shares they can be sold short or purchased on margin. • Tax efficiency: when small investor wishes to redeem its position in an ETF, he simply sells his/her shares to other trades, with no need for the fund to sell any assets of the underlying portfolio. It’s a form of redemption that avoids tax events for the rest of the investors in the fund. • ETFs are cheaper than Mutual Funds: lower management fees charged by the funds to the investors because there is not active management to remunerate. • In general ETFs do not charge front-end load, back-end load or performance fees. Although, ETFs have also some disadvantages: • There are possibilities that ETFs’ prices can depart by small amounts from net asset value before arbitrage activity restore equality. • TER is the explicit cost and generally for ETFs it is lower than Mutual Funds. But ETFs must be purchased from brokers for a fee. And then you must consider another implicit cost that is the bid-ask spread. When it comes to evaluating the performance of mutual funds, researchers mainly put their emphasis on whether active management can earn excess returns which is able to cover its additional costs in spending effort to improve investment performance. No improvement strategies involved in portfolios is what we called passive management (as strategies used by ETFs). Compared to passive management, active management is the attempt to improve
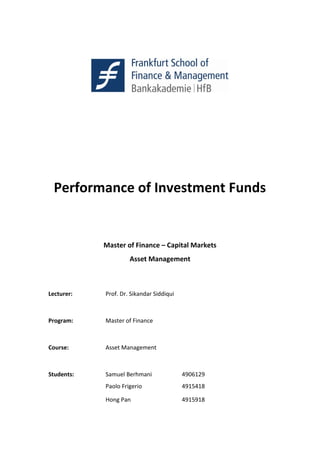
  • 8. 5 performance either by identifying mispriced securities or by timing the performance of broad asset classes5 . In the chart below we present a brief comparison between a mutual fund and an ETF invested on the same benchmark. As you can see, the total expenses ratio is higher for the mutual fund: the difference is almost equal to 100 basis points. It is a big difference and probably this has negative effects on the performance of the mutual fund relatively to the one of ETF: indeed, we see that the actively managed mutual fund is not able to beat is passive competitor. The performance are quite similar, it seems even that the ETF has done better in the past. One possible explanation of the poor performance of the active fund could be that, if it is able to generate outperformance as active managers usually presume, this will be probably destroyed by the higher costs that the fund generate due to his active strategy. Does the active management actually add value to the funds? A lot of researches have been done to figure this issue out. Some suggest that mutual fund managers have the ability to choose stocks that outperform their benchmarks, before any expenses are deducted. We will offer a deeper view about this important aspect in the next section. 2. Literature Review (Summary of Empirical Results) Before starting with our personal analysis, we would like to present briefly the results of some of the most important empirical studies regarding the performance of mutual funds. These studies are important not only to assess whether the investment in mutual funds is on average a good investment in terms of returns adjusted for risk, but, from an academic perspective, assessing the existence and the persistence of mutual fund managerial ability is an important test of the efficient market hypothesis: evidence of persistence ability would support a rejection of its semi-strong form. The first study that we have looked is the one by Elton, Gruber, Das, Hlavka (1993) 6 . They have found that mutual fund managers underperform passive portfolios. Furthermore, 5 Zvi Bodie, Alex Kane, Alan J. Marcus, “Investments”, 9th edition, 2011, McGraw-Hill/Irwin. 6 Edwin J. Elton, Martin J. Gruber, Sanjiv Das, Matthew Hlavka, “Efficiency with Costly Information: A Reinterpretation of Evidence from Managed Portfolios”, The Review of Financial Studies, Vol. 6, No.1 (1993), pp. 1-22. UBS (lux) Equity Fund Euro STOXX 50 (EUR) UBS-ETF Euro STOXX 50 Ticker UBFA:GR Ticker E50EUA:GR NAV (EUR) 134,09 NAV (EUR) 24,87 assets (mln EUR) 396,0382 assets (mln EUR) 637,7014 TER 1,26% TER 0,30% 1-Month -3,66% 1-Month -3,38% 3-Month +13,61% 3-Month +14,33% 1-Year +13,33% 1-Year +11,33% 3-Year -2,10% 3-Year -1,32% 5-Year -8,07% 5-Year -7,36% Source: Bloomberg
  • 9. 6 funds with higher fees and turnover underperform those with lower fees and turnover. Funds do not adjust expenses over time to reflect their performance. Carhart (1997)7 finds that expense ratios, portfolio turnover, and load fees are significantly and negatively related to the performance. Expense ratios appear to reduce performance a little more than one-for-one. Load funds substantially underperform no-load funds: the average load fund underperforms the average no-load fund by approximately 80 basis points per year. The evidence is consistent with market efficiency. Although the top-decile mutual funds earn back their investment costs, most funds underperform by about the magnitude of their investment expenses. The bottom-decile funds (they typically are the smallest funds), however, underperform by about twice their reported investment costs. In the end, regarding the issue of consistency in mutual fund performance, he finds that, after controlling for the 4 factors, there is only minor persistence in relative performance across managers, and moreover much of that persistence seems due to expenses and transactions costs rather than gross investment returns. This result suggests that fund managers possess little stock selection skill. The evidence that performance does not persist is widely regarded as implying that superior performance, when it exists, is attributable to luck rather than to differential ability across managers. If all performance is due to luck, there should be no reason to reward it. But in reality managers appear to reap rich rewards from superior past performance. This lead to say that investors are not rational, or their behaviors are due to asymmetric information or moral hazard. Hence, from this study we can derive 3 rules-of-thumb: I. Avoid funds with persistently poor performance; II. Funds with high returns last year have higher-than average expected returns next year, but not in the years thereafter; III. The investment costs of expense ratios, transaction costs, and load fees all have a direct, negative impact on performance. Daniel, Grinblatt, Titman, Wermers (1997)8 find that the average active mutual fund beats a mechanical strategies based on stock characteristics like book-to-market, size, and momentum. But the amount by which the average mutual fund beat a mechanical strategy is fairly small (under 100 basis points) and is approximately equal to the average management fee. Moreover they find that aggressive-growth and growth funds, which exhibit the highest performance, probably generate the largest costs as well. Wermers (2002)9 has used a database containing quarterly portfolio holdings for all US equity mutual funds existing between January 1, 1975, and December 31, 1994. He has found that over the period ‘75-‘94 mutual funds held stock portfolios that outperform a broad market index (the CRSP value-weighted index) by 1.3 percent per year. About 60 basis points is due to the higher average returns associated with the characteristics of stocks held by the funds, whereas the remaining 70 basis point is due to talents in picking stocks that beat their characteristic benchmark portfolios. However, on a 7 Mark M. Carhart, “On Persistence in Mutual Fund Performance,” Journal of Finance 52 (1997), pp. 57–82. 8 Kent Daniel, Mark Grinblatt, Sheridan Titman, Russ Wermers, “Measuring Mutual Fund Performance with Characteristic- Based Benchmarks”, The Journal of Finance, Vol. 52, No. 3 (1997), pp. 1035-1058. 9 Russ Wermers, “Mutual Fund Performance: An Empirical Decomposition into Stock-Picking Talent, Style, Transactions Costs, and Expenses”, The Journal of Finance, Vol. LV, No. 4 (2000), pp. 1655-1695.
  • 10. 7 net return level, the funds underperform broad market indexes by 1% per year. Of the 2.3% difference between the returns on stock holdings and the net returns of funds, 0.7 % per year is due to the lower average return of the non-stock holdings (bonds and cash) of the funds during the period (relative to the stocks). The remaining 1.6% is split almost evenly between the expense ratios and the transaction costs of the fund. So, considering only the stock holdings, mutual fund manager hold stocks that beat the market portfolio by almost enough to cover their expenses and transactions costs, which is consistent with the equilibrium model of Grossman and Stiglitz (1980)10 . Grossman and Stiglitz show that while mutual funds can outperform on a gross-return basis, net of costs (including research costs) they will not be able to do so in a strongly efficient market. Mutual funds holdings of cash and bonds, presumably to maintain liquidity in the face of uncertain investment inflows and redemptions, put a substantial drag on the net returns of funds relative to the market. Besides high-turnover funds, although incurring in substantially higher transactions costs and charging higher expenses, also hold stocks with much higher average return than low- turnover funds. At least a portion of this higher return level is due to the better stock picking skills of managers of high turnover funds. All results ignore the higher tax burden of actively managed (especially high turnover) funds. Bollen and Busse (2004)11 have used daily mutual funds returns, and Carhart 4-factors model to investigate short-term persistence in mutual fund performance. Their results suggest that superior performance is a short-lived phenomenon that is observable only when funds are evaluated several times a year (quarterly: they focus on a relatively short measurement period of three months). Although their findings are statistically significant and are robust to tests, the economic significance of persistence in mutual fund abnormal return is questionable: after taking into account transaction costs and taxes, investors may generate superior returns by following a naïve buy-and-hold approach rather than a performance-chasing strategy, even if short term performance is predictable. Berk and Green (2004) 12 have found that fund flows rationally respond to past performance even though performance is not persistent and investments with active management do not outperform passive benchmarks on average. They believe that skilled mutual funds managers with abnormal performance will attract new funds until the additional costs and complexity of managing those extra funds drive alphas down to zero. This means that even if managers are skilled, alphas will be short lived. Fama and French (2009)13 find that from 1984 to 2006 mutual fund investors in aggregate get net returns that underperform CAPM, 3-Factors, 4-Factors benchmarks by about the costs in expense ratios. Thus if there are fund managers with enough skill to produce 10 Sanford J. Grossman, Joseph E. Stiglitz, “On the Impossibility of Informationally Efficient Markets”, American Economic Review, 70 (1980), pp. 393-408. 11 Nicolas P. B. Bollen, Jeffrey A. Busse, “Short-Term Persistence in Mutual Fund Performance”, The Review of Financial Studies, Vol. 18, No. 2 (2004), pp. 569-597. 12 Jonathan B. Berk, Richard C. Green, “Mutual Fund Flows and Performance in Rational Markets”, Journal of Political Economy, Vol. 112, No. 6 (2004), pp. 1269-1295. 13 Eugene F. Fama, Kenneth R. French, “Luck versus Skill in the Cross Section of Mutual Fund Returns”, Working Paper, forthcoming in the Journal of Finance, December 2009.
  • 11. 8 benchmark adjusted expected returns that cover costs, their track are hidden in the aggregate results by the performance of managers with insufficient skill. Otten and Bams (2002)14 have studied the European Mutual funds industry. They have found that European Mutual Funds prefer small and high-to-book ratio stock (value). In Europe small cap mutual funds as an investment style outperform their benchmark. Four out of five countries deliver positive aggregate alphas, where only UK-funds out-perform significantly. If we look at European fund returns with costs added back: French, Italian, Dutch and UK funds out-perform significantly, while German funds still underperform the market, though not significantly. Regarding the influence of fund characteristics on risk-adjusted performance, they have found that expense ratio and age are negatively related to risk adjusted performance, while fund assets are positively related. Thus the results suggest that most European Mutual Funds deliver positive risk adjusted performance to their investors. Contrary to most US evidence, the majority of European funds seem to be able to find and implement new information to offset their expenses and therefore add value for the investors. A factor influencing this could be the smaller market importance of the European versus the US industry. While the US industry holds almost the 30% of the domestic equity market, European funds are rather small players (up to 11% domestic market importance). If the mutual fund sector grows larger, relative to the market, it becomes more difficult to outperform the market as a group (smaller market importance: better position to follow or even beat the market). The conclusion of this study is that European small cap funds significantly out-perform market as a group. Thus, summarizing the empirical evidence we have just presented, we can say that overall there are relatively few mutual funds which have genuinely positive alphas and picking ex- ante winners is very difficult when one considers potential data snooping bias, model/estimation errors and transactions costs due to rebalancing. About the persistence in mutual fund performance, empirical literature provides fairly strong evidence of persistence in negative performance (persistence among past loser funds is well established), but much weaker persistence in positive performance. Sensible advice for most investors would be to hold low cost index funds (high expenses are positive correlated with bad performance) and avoid holding past “active” loser funds. Current evidence suggests that only very sophisticated investors should pursue an active investment strategy of trying to pick winners. Moreover, as past looser funds are likely to continue to exist and they rarely experience severe outflows, it is necessary to provide impartial and independent information on fund past performance: it is very important for investors to have easy access to reliable information on underperforming funds so they can modify their investment strategies accordingly15 . 14 Roger Otten, Dennis Bams, “European Mutual Fund Performance”, European Financial Management, Vol. 8, No. 1 (2002), pp. 75-101. 15 David Blake, Allan Timmermann, “Performance Persistence in Mutual Fund: An Independent Assessment of the Studies Prepared by Charles River Associates for the Investing Management Association”, Prepared for the FSA, April 2003.
  • 12. 9 3. Measures of Performance and Style Analysis Measures of Performance The efficient market hypothesis suggests that earnings from active management are less than the expenses; therefore passive investment strategy is advisable, say investing an index fund. And we all know this is not the case in reality. Indeed, we assume that the market is near efficient, which means almost all available information is symmetric to investors. Investors will spare time and effort to search the stocks and securities only if they can better off from the activity. When it comes to the measurement of active performance, we have to set a benchmark to see if it will generate better outcomes than index fund. To begin with, we have to get the rate of return from the cash flows. There are two common ways in calculating. One is called dollar-weighted method; the other is called time- weighted method. Although both methods provide accurate return of the funds, dollar- weighted method is not able to present true performance of the funds16 . Therefore, we will mainly focus on time weighted method in computing rate of return. Suppose the fund is compared in one year basis, and there are m-periods in a year which have cash inflows and out flows. Thus we have: 1 2(1 )(1 )...(1 ) 1mr i i i= + + + − Where: 1 1 , 1,2...j j j j B i j m B C− − = = + jB is the balance of funds at the beginning of jt . jC is the net contribution to the funds at jt . If there are k stocks in the portfolio, each weighted 1 2, ,..., kw w w , and 1 1 k i i w = =∑ . We can compute each return of the stocks, giving rise to the return of the portfolio. 1 k p i i i r w r = = ∑ Measures for risk-adjusted return As it stated earlier, it is returns and costs that determine the performance of the portfolios. Returns should be carefully adjusted if we take risks into consideration. Several classic risk adjusted measure will be introduced1718 . 16 Stephen G. Kellison, “The Theory of Interest”, 3rd edition, 2008, McGraw-Hill/Irwin. 17 Zvi Bodie, Alex Kane, Alan J. Marcus, “Investments”, 9th edition, 2011, McGraw-Hill/Irwin. 18 Edwin J.Elton , Martin J.Gruber, Stephen J.Brown, William N. Goetzmann, “Modern portfolio theory and investment analysis”,6th edition, 2003, Wiley.
  • 13. 10 a. Sharpe Measure Sharpe’s measure is one of the first measures in evaluating portfolio performance. It divides average portfolio excess return over the sample period by the standard deviation of returns over that period. It can be written as followed. ( ) /p f pr r σ− Where: 𝑟𝑓: risk-free rate 𝜎 𝑝: standard deviation of the portfolio returns. This ratio is often compared to the market Sharpe ratio, which is calculated in the same way, using market return and standard deviation instead. ( ) /M f Mr r σ− From the perspective of investors, if ( ) /p f pr r σ− is larger than( ) /M f Mr r σ− , we say the portfolio is outperformed than the market. From the view of managers, we can use Sharpe measure to evaluate fund performance in the same level risk. Given market’s return and standard deviation, the return in negative management can be derived through each risks level. M f i f i M r r r r σ σ − = + Then we compare actual return on active management with the passive one. If 0p ir r− > , we can conclude that the managerial effort is merit. b. Treynor Measure Treynor’s measure gives us the excess return per unit of risk, but it uses systematic risks (non-diversifiable risks) instead of total risk. ( ) /p f pr r β− The systematic risk of the portfolio is defined as 2 ( )( ) ( ) p p M M p M M r r r r r r β − − = − ∑ ∑ Treynor’s measure, to some extent, is similar to Sharpe’s measure. Treynor’s measure also has to be measured against market Treynor ratio. Again, investors prefer portfolios which have a higher ratio. However, Treynor’s measure considers non-diversifiable risks in portfolios, which is the biggest difference between the two methods. c. Jensen Measure Jensen’s measure is the average return on the portfolio that predicted by the CAPM, given the portfolio’s beta and the average market return. From the definition of the systematic risk, it is easy to get that: 1Mβ = 0fβ =
  • 14. 11 Applying the same rule to compute the portfolio performance at the portfolio risk level, we have: ( ) M f passive f p M f M f p r r r r r r r β β β − = + = + − We say that managers’ selection on stocks perform better than the market if: 0p passiver r− ≥ The difference between true return and the one in passive management is referred to portfolio’s alpha value 𝛼 𝑝�, we call it Jensen’s alpha. M=p p f p fr r r rα β− − − ( ) If Jensen’s alpha has a positive value, it suggests that managers do better than the market, otherwise alpha will show a negative value. d. Information Ratio The information ratio divides the expected excess value in active management by “tracking error”, which is nonsystematic risk of the portfolio. Thus, we have: / ( )p peα σ Information ratio measures excess return per unit of risk which can be diversified away by holding market portfolios. The alpha here is different from Jensen’s alpha, because it measures the excess return, not risk-adjusted return. =p p indexr rα − Thus information ratio can be written as ( ) / ( )p index pr r eσ− Information ratio and Sharpe measure are similar in form, but Sharpe measure uses the risk premium divided by standard deviation of the return, while information ratio uses the excess return relative to the benchmark divided by standard deviation of active return error. e. Fama and French three-factor model and Carhart four-factor model The three factors model is introduced by Fama and French in 1993, which explains risk premium of a portfolio. This model is also an improved model compared to CAPM for better evaluation. It not only considers the excess return from market portfolios as CAPM does, but also takes the size and value-growth returns into consideration. The model reads as follows. ( )it ft i i Mt ft i t i t itR R a b R R s SMB h HML e− = + − + + + Where:
  • 15. 12 itR , ftR , MtR represent the return of fund i, risk free rate, Market return, respectively. tSMB is size effect return, and tHML is value-growth return. The alpha here measures average return, and reflects managers’ impact on the fund. People are always glad to see a positive alpha, which implies a good performance of the fund managers. Later, there-factor model is developed into four-factor model by Carhart in 1997. He adds momentum factor into the model, making the whole model closer the reality. (  )it ft i i Mt ft i t i t tit iR R a b R R s SMB h H m MOMML e− = + − + + + + Although both of the three-factor model and four-factor model are classic models in portfolio evaluation, the latter is referred as a more robust one because it looks into momentum factor, and is widely used as a full version of time-series regression model. After comparing passive management and active management performances, researches also want to know what consist of the active management. To distinguish whether it is luck or due to the managerial skills from fund managers, Fama and French (2009)19 have conducted an empirical research using three-factors and four- factor models to form benchmarks respectively. They estimated each fund in AUM group. In 3 factors model, net return is slightly above or in most cases below the average values, and in 4 factors model, the result is more pessimistic. When it turns to gross return, situations get better and managers’ skills are committed. Overall, they found that during the period of 1984 to 2006 mutual fund investors in aggregate get net returns are underperformed by the costs in expense ratios. Only very few managers have sufficient skills to cover costs. Thus luck seems to be a key element in fund management rather than managerial skills. However, they also found that if we get rid of the expense ratio, it showed a strong relationship between returns and managerial skills. Alternative Method in Evaluation: Style Analysis Mutual funds may systematically follow certain styles. Style analysis provides an alternative way in evaluating fund performance. Style analysis refers to the process of determining what type of investment behavior an investor or money manager employs when making investment decisions. According to Bodie, Kane, Marcus(2010)20 , style analysis reveals the strategy that most closely tracks the fund’s activity and measures performance relative to this strategy. Through style analysis mutual funds are compared freely with each other from different indexes, not only with market benchmark. Sharpe has introduced the style analysis method in 1989-1992, which can be used to evaluate fund’s performance. He makes a regression on mutual fund returns with a number of asset classes. Suppose assets are divided into k classes. Then the rate of return can be described as followed. 19 Eugene F. Fama, Kenneth R. French, “Luck versus Skill in the Cross Section of Mutual Fund Returns”, Working Paper, forthcoming in the Journal of Finance, December 2009. 20 Zvi Bodie, Alex Kane, Alan J. Marcus, “Investments”, 9th edition, 2011, McGraw-Hill/Irwin.
  • 16. 13 1 1 1 , 0 k t i it t i k i i i r rα β ε β β = =  = + +   = ≥  ∑ ∑ Where: iβ , the regression coefficients, represent the sensitivities to each index itr at time t. 1 k i it i rβ = ∑ , the return on passive management which have the same style as the mutual funds; Constraint is put on regression coefficients because they have to be 1 in total and each coefficient need to be larger or equal to zero; It is not hard to get the idea that sensitivities to each index consist of a complete asset allocation. Therefore, regression coefficients can be interpreted as the style of the funds. We usually use a benchmark to compare with the actual performance, and this benchmark can be derived from returns-based style analysis. The returns-based style analysis is based on historical behavior of a fund. To analyze a mutual fund, the only data required are the total returns for the mutual fund and a set of passive indexes. Statistically, analysts use R- square as an indicator to tell how well the performance is, since it measures the degree to which the benchmark portfolio can explain the long-term behavior of the mutual fund21 . We tried to compose a portfolio, only related to Health & Biotechnology sector and Financial Services sector. We have regressed 38 funds in these two sectors, using data from January 2010 to October 2012. SXDP Index and SX7P Index are fund benchmarks for Health & Biotechnology sector and Financial Services sector, respectively. The strategies for these 38 funds are different; therefore each of them has different styles. Just take one of the funds as an example. Beta coefficients for this specific fund are 80% and 20%, which indicates that the style of the portfolio is 80% (SXDP) to 20% (SX7P). In addition, R-square (89%) in this regression is really high, meaning that the benchmark portfolio is enough trustful to explain its performance. Fund β SXDP β SX7P R² BNPAPSA FP Equity (Health Care) 80% 20% 89% However, no matter how sophisticated the models are, problems still remain in performance evaluation22 . Due to the changes in expected returns or decomposition of the portfolio, the risk levels may change through the time which makes the evaluation more difficult. Beta coefficients from the historical data will not be consistent all the time especially when the portfolio is actively managed. Thus, estimating risk levels in the past 21 Lori Lucas, Mark W. Riepe, “The Role of Returns-Based Style Analysis: Understanding, Implementing, and Interpreting the Technique”, 1996, working paper. 22 Zvi Bodie, Alex Kane, Alan J. Marcus, “Investments”, 9th edition, 2011, McGraw-Hill/Irwin.
  • 17. 14 cannot guarantee a proper performance evaluation. In addition, performance evaluation is in high demand of sample pools for significant results. Theoretical models are just a basic knowledge in evaluation, and portfolio managers may change their strategies from time to time according to different financial situations. Therefore, we have to go deeper and find out what kind of methods the portfolio managers used in reality. 4. Performance attribution analysis The interest of the performance attribution analysis is to understand where the added value comes from: it’s to explain the performance, what is behind the so called “return”. It is easy to identify which funds have outperformed or not their benchmark over a period of time. But this lacks a deeper analysis and cannot be the only tool to know if this fund is good or not. The performance attribution analysis tells us whether or not the portfolio managers has met his management objectives and if it is coherent with what it is announced in the commercial prospectus of the fund. It is all about to know the causes of success and failed investments inside a portfolio. a. Choice of the benchmark To analyze a return of a portfolio in comparison to a benchmark, the benchmark has to correspond to the same asset class, with the same kind of asset that the managers have drawn in its prospectus. That’s why sometimes it is important to look carefully the benchmark given by the asset management firm to know if it is really relevant. Otherwise, if we think that the benchmark provided by the asset management firm is not a good proxy for our investment not, it is possible to find another one or to build a composite one. This is especially the case with “Absolute Return Funds” which very often use the LIBOR or the EURIBOR as benchmark. To get a relevant analysis it is necessary to find a proxy for the fund. b. Formula and theory As we said, portfolio attribution is a big part component in the investment process and value chain for an asset manager: it is an aid for sales team and marketing to stress the qualities of the fund or the success of a manager strategy. The main idea of the performance attribution is to decompose the added value of a fund performance in comparison to its benchmark. Technically there are two main ways to do it: - Return decomposition methods (also Brinson Attribution or Accountancy methods); - Financial model based method (CAPM).
  • 18. 15 Return decomposition methods (Brinson Attribution)23 The aim of the Return Decomposition Methods is not to get into deep mathematical models based on regression and so on. Rather, it is just to explain the added value through a possible decomposition of its factors. The advantages of this method could be summarizing in the following points: - Can focus on allocation (top/down approach) or on selection (bottom up approach); - Easy to calculate (requires benchmark and portfolio returns and weights); - Easy to understand and explain; - Used by large portion of investment community; - Widely accepted in industry. The simplest way is to consider the added value as a sum of two factors: or top-down or bottom up. The manager chooses a sector and inside this sector he picks up a certain number or asset. He can choose a sector that globally outperforms the market or not (top down) and can choose an asset that outperform its peers or not (bottom up). B = Global Benchmark Performance; bi = performance of the subsector/subpart i of the benchmark; wbi = weight of the subsector/subpart i. So that: 𝐵 = � 𝑤𝑏𝑖 ∗ 𝑏𝑖 𝑛 𝑖=1 Sometimes it might be complicated to have the exact weight with the exact performance of the subsector. 𝐵∗ = � 𝑤𝑏∗ 𝑖 ∗ 𝑏∗ 𝑖 𝑛 𝑖=1 And: P = performance of the fund; pi = performance of a bucket whose bi can be a proxy; wpi = weight of the bucket i. 𝑃 = � 𝑤𝑝𝑖 ∗ 𝑝𝑖 𝑛 𝑖=1 The added value can be decomposed as following: 𝐴𝑉 = 𝑃 − 𝐵∗ + 𝐵∗ − 𝐵 𝐴𝑉 = � 𝑤𝑝𝑖 ∗ (𝑝𝑖 − 𝑏∗ 𝑖) + �(𝑤𝑝𝑖 − 𝑤𝑏∗ 𝑖)(𝑏∗ 𝑖 − 𝑛 𝑖=1 𝑛 𝑖=1 𝐵∗ ) + � 𝑤𝑏∗ 𝑖( 𝑛 𝑖=1 𝐵∗ − 𝐵) 23 Gary P. Brinson, L. Randolph Hood and Gilbert L. Beebower, “Determinants of Portfolio Performance”, Financial Analysts Journal Vol. 42, No. 04 (1986), pp.39-44.
  • 19. 16 Bottom Up: ∑ 𝑤𝑝𝑖 ∗ (𝑝𝑖 − 𝑏∗ 𝑖)𝑛 𝑖=1 Top down: ∑ (𝑤𝑝𝑖 − 𝑤𝑏∗ 𝑖)(𝑏∗ 𝑖 − 𝐵∗𝑛 𝑖=1 ) + ∑ 𝑤𝑏∗ 𝑖(𝑛 𝑖=1 𝐵∗ − 𝐵) Now we present another example how we could build such decomposition of the returns with an International Fund. This time the factors that we will consider are the following: - Under or over exposure thought a market (top down); - Pick up; - Currencies exposures. 𝑤𝑖 𝐹 : weight of the country i in the fund; 𝑤𝑖 𝐵 : weight of the country i in the benchmark; 𝑝𝑖 𝐹 : return of the fund in local currency in the bucket of the country I; 𝑝𝑖 𝐵 : return of the bench in local currency in the bucket of the country I; 𝑐𝑖 : return of the exchange rate of the local currency against euro (or the fund currency). 𝑃𝐵 = � 𝑤𝑖 𝐵 ∗ 𝑖 𝑝𝑖 𝐵 𝐶 𝐵 = � 𝑤𝑖 𝐵 ∗ 𝑖 𝑐𝑖 𝑃𝐹 𝐸𝑈𝑅 = � 𝑤𝑖 𝐹 ∗ ��1 + 𝑝𝑖 𝐹 � ∗ �1 + 𝑐𝑖 � − 1� 𝑖 𝑃𝐵 𝐸𝑈𝑅 = � 𝑤𝑖 𝐵 ∗ ��1 + 𝑝𝑖 𝐵 � ∗ �1 + 𝑐𝑖 � − 1� 𝑖 𝐴𝑉 = 𝑃𝐹 𝐸𝑈𝑅 − 𝑃𝐵 𝐸𝑈𝑅 𝐴𝑉 = � 𝑤𝑖 𝐹 ∗ ��1 + 𝑝𝑖 𝐹 � ∗ �1 + 𝑐𝑖 � − 1� 𝑖 − � 𝑤𝑖 𝐵 ∗ ��1 + 𝑝𝑖 𝐵 � ∗ �1 + 𝑐𝑖 � − 1� 𝑖 = � 𝑤𝑖 𝐹 ∗ �𝑐𝑖 ∗ 𝑝𝑖 𝐹 + 𝑝𝑖 𝐹 + 𝑐𝑖 � 𝑖 − � 𝑤𝑖 𝐵 ∗ �𝑐𝑖 ∗ 𝑝𝑖 𝐵 + 𝑝𝑖 𝐵 + 𝑐𝑖 � 𝑖 = � 𝑤𝑖 𝐹 ∗ �𝑐𝑖 ∗ 𝑝𝑖 𝐹 + 𝑝𝑖 𝐹 + 𝑐𝑖 + 𝑝𝑖 𝐵 − 𝑝𝑖 𝐵 + 𝑃𝐵 − 𝑃𝐵 + 𝐶 𝐵 − 𝐶 𝐵� 𝑖 − � 𝑤𝑖 𝐵 ∗ �𝑐𝑖 ∗ 𝑝𝑖 𝐵 + 𝑝𝑖 𝐵 + 𝑐𝑖 + 𝑝𝑖 𝐹 − 𝑝𝑖 𝐹 + 𝑃𝐵 − 𝑃𝐵 + 𝐶 𝐵 − 𝐶 𝐵� 𝑖 = ��𝑤𝑖 𝐹 − 𝑤𝑖 𝐵 � ∗ �𝑝𝑖 𝐵 − 𝑃𝐵� 𝑖 + ��𝑤𝑖 𝐹 − 𝑤𝑖 𝐵 � ∗ �𝑐𝑖 − 𝐶 𝐵� 𝑖 + ��𝑤𝑖 𝐵 ∗ �𝑝𝑖 𝐹 − 𝑝𝑖 𝐵 �� 𝑖 + ���𝑤𝑖 𝐹 − 𝑤𝑖 𝐵 � ∗ �𝑝𝑖 𝐹 − 𝑝𝑖 𝐵 �� 𝑖 + �� 𝑤𝑖 𝐹 𝑖 − � 𝑤𝑖 𝐵 𝑖 � ∗ (𝑃𝐵 + 𝐶 𝐵) + � 𝑐𝑖 ∗ �𝑝𝑖 𝐹 𝑤𝑖 𝐹 − 𝑝𝑖 𝐵 𝑤𝑖 𝐵 � 𝑖
  • 20. 17 As you can see, we have separated the added value into 6 factors: • Country allocation; • Currency allocation; • Selection effect; • Interaction; • Leverage; • Cross-terms. Let’s see a numerical example: we are considering a fund invested in two different countries and using a small leverage of 10%. We build an ad-hoc benchmark composed of 70% and country 1 and 30% of country 2. We have tables summarizing the different returns in the two countries: Initial weight Fund Bench Country 1 45% 70% Country 2 65% 30% Total 110% 100% Local return Fund Bench Return Country 1 7% 5% Return Country 2 5% 6% Exchange rate/EUR Country 1 1% Country 2 1,5% We have calculated each factor using the given formulas: Fund Performance: 45% × [ (1+7%) × (1+1%) – 1 ] + 65% × [ (1+5%) × (1+1.5%) – 1 ] = 7.91% Benchmark Performance: 70% × [ (1+5%) × (1+1%) – 1 ] + 30% × [ (1+6%) × (1+1.5%) – 1 ] = 6.51% Thus, the fund was able to add value, and precisely the added value is about 1.39% (Fund Performance – Benchmark Performance = 7.91% - 6.51%). Market performance: (70% × 5%) + (30% × 6%) = 5.30% FX performance: (70% × 1%) + (30% × 1.5%) = 1.15%
  • 21. 18 Country effect contribution: [ (45% - 70%) × (5% - 5.3%) ] + [ (65% - 30%) × (6% - 5.3%) ] =0.07% + 0.25% = 0.32% Currency effect contribution: [ (45% - 70%) × (1% - 1.2%) ] + [ (65% - 30%) × (1.5% - 1.2%) ] =0.03% + 0.12% = 0.15% Selection effect contribution: [ 70% × (7% - 5%) ] + [ 30% × (5% - 6%) ] =1.40% + -0.30% = 1.10% Cross terms contribution: 1% × [ (45% × 7%) - (70% × 5%) ] + 1.5% × [ (65%× 5%) - (30% × 6%) ] = 0.00% + 0.02% = 0.02% Interaction effect contribution: [ (45% - 70%) × (7% - 5%) ] + [ (65% - 30%) × (5% - 6%) ] =-0.50% + -0.35% = -0.85% Leverage effect contribution: [ (45% + 65%) - (70% + 30%) ] × (5.30% + 1.15%) = 10% × 6.45% = 0.65% To sum up: Returns Fund 7,91% Bench 6,51% Spread 1,39% Perf. Attrib. details Country 1 Country 2 Total Country allocation 0,07% 0,25% 0,32% Currency allocation 0,03% 0,12% 0,15% Selection effect 1,40% -0,30% 1,10% Interaction -0,50% -0,35% -0,85% Leverage 0,65% Cross Terms 0,00% 0,02% 0,02% Total 1,39% What we can analysis is that the fund outperforms very well by investing in the country number two (+25bps) but the underlying of this bucket are bad (-30bps) which leads to a - 35bps interaction effects. The choice of country 1 is still a good investment, what we can also see is that he has got a 140bps outperformances in his stock picking effect. Leverage is positive because the position even without leverage is profitable, therefore, in this specific case, using leverage has a positive effect on the fund’s performance.
  • 22. 19 SCENARIO + SCHEME We can simplify the precedent model to get just three factors very simple to explain. This is based on the work of Riordan Consulting.24 i. Allocation Effect The general formula to figure out the allocation effect is the following: [(portfolio sector weight) – (benchmark sector weight)] * [(benchmark sector return)-(benchmark total return)] The allocation effect measures the portfolio manager performance through a top-down point of view. It allows answering the following question: does he have effectively allocates its asset throughout different sector/country/segment (regarding the decomposition chosen)? The figures given by this effect tell whether or not the investment manager has over weight such bucket relatively to the benchmark bucket. If its value is positive it means that the manager has put his investment in an over performing sector (vs. benchmark). Benchmark return Segment Weight Segment > Total Bench return Segment < Total Bench Return Portfolio > Bench Scenario 1 Scenario 2 Portfolio < Bench Scenario 3 Scenario 4 The allocation effect could be positive in two cases: if the portfolio segment is overweighed in a segment that outperforms the global benchmark (scenario 1) or if the portfolio manager underweights a segment that underperforms the global benchmark (scenario 4). Instead, this effect could be negative if he overweight a bad segment (scenario 2) or if he underweight an outperformer segment (scenario 3). ii. Selection effect The general formula to calculate the selection effect is the following: (benchmark sector weight)] * [(portfolio sector return)-(benchmark sector return)] The selection effect can be seen as the stock-picking skill of the asset manager. Within a certain sector/country/segment it measures the outperformance of the fund relative to the benchmark. If the fund under performs it means that globally the investment manager selects the worst value among the bucket. The over or underperformance of the portfolio is weighted by the benchmark weight, therefore, selection is not affected by the manager’s allocation to the segment. The weight of the segment in the portfolio determines the size of the effect - the larger the segment, the larger the effect is (it could be either positive or negative). Segment Returns Portfolio > Benchmark Portfolio < Benchmark Scenario 1 Scenario 2 24 http://www.riordan-consulting.com/
  • 23. 20 A positive selection effect is obtained when the portfolio manager can get a return which is higher the benchmark return (considering a sector/subsector): it means that the investment manager has made good decisions in selecting securities that, as a whole, have outperformed similar security in the benchmark. A negative selection effect simply means that the portfolio manager has made poor investment decision inside a particular bucket. iii. Interaction Effect The general formula to estimate the interaction effect is the following: [(portfolio sector weight) – (benchmark sector weight)] * [(portfolio sector return) – (benchmark sector return)] Segment return Segment Weight Portfolio > Bench return Portfolio < Bench Return Portfolio > Bench Scenario 1 Scenario 2 Portfolio < Bench Scenario 3 Scenario 4 The interaction effect measures the combined impact of the portfolio manager selection and allocation decisions within a sector/country/segment. To give an example, the manager may have an outperformance regarding the stock picking criteria, and the portfolio could overweight a specific sector/country/segment which outperforms the benchmark as well. The interaction is thus positive. Instead, if he would have underweighted this particular segment the interaction effect would have been negative. The manager did not take any more advantage of its good selection by putting more money in it. We have also to notice that many asset managers consider this interaction effect as a part of the bottom up or top down effect. To be more precise, a positive interaction effect occurred because the portfolio weight was greater than the benchmark weight and so the portfolio return was greater than the benchmark return. The investment manager exercised good selection and over allocated assets to that segment (scenario 1). Another way to get a positive interaction factor is when the manager decides to underweight a poor performing segment (scenario 4). Instead, a negative interaction effect occurred because the investment manager overweight a sector that underperforms the global benchmark and its returns on its particular segment is below the segment average (scenario 2). Another case is when the manager underweight a sector relative to the bench but outperforms its peers. The investment manager underweighted the segment with good selection. The manager exercised good selection but poor allocation (scenario 3).As we can see in this kind of analysis, with 3 factors, it is possible to come up with a negative term regarding interaction between the asset allocation added value and the bottom up, although the top down and the bottom up are separately positives. It’s just to get big pictures because some other factors, important in the investment process, are absents: - It says nothing about the cash performance of the fund, management fees, transaction costs, etc… This model is very often used in the fund of funds or diversified portfolio.
  • 24. 21 Financial model based method (CAPM) A model based on the CAPM allows decomposing the return into two factors: alpha and beta. Beta: Market influence, market sensitivity the market timing Alpha: stock picking effect; the return of the fund if we consider no market variations. By neglecting the epsilon in the CAPM formula: 𝐴𝑉 = 𝑃𝐹 𝐸𝑈𝑅 − 𝑃𝐵 𝐸𝑈𝑅 𝐴𝑉 = 𝑃𝐹 𝐸𝑈𝑅 − 𝛽𝑃𝐵 𝐸𝑈𝑅 + 𝛽𝑃𝐵 𝐸𝑈𝑅 − 𝑃𝐵 𝐸𝑈𝑅 𝐴𝑉 = 𝑃𝐹 𝐸𝑈𝑅 − 𝛽𝑃𝐵 𝐸𝑈𝑅 + (𝛽 − 1)𝑃𝐵 𝐸𝑈𝑅 But it is important to notice that the choice of the factors is subjective. Another point which is critical when comparing a NAV vs. a Benchmark or an Index:  We have to be careful of how the NAV is calculated. Sometimes the fund underlying stock market prices hours are different from the benchmark and can lead to distortions especially in a volatile market. o Example: The fund NAV calculation processes (settlement and delivery for example) force the fund to value some stock with the day before stock market price.  You have to look during the time the composition of the portfolio regards the benchmark. Sometime the outperformance is only due to an underinvestment of the portfolio. We can see that with “EdR Tricolore Rendement” in 2008 which has a part of its asset in cash25 . During a bearish market, a manager can simply chooses to invest in cash to avoid a certain exposure to the market (lowering its beta). This has to be carefully taken into account regarding the investment style and the investment process. An equity fund is not supposed to be invested in cash (we do not pay fees for that!!) and in a certain way stress a sort of incapacity of the manager to decide in a certain environment. Technical limits of Financial Model based Method If we consider that the returns are compounding, investing in a good fund in a bull market make more money by the implicit reinvestment of the excess return. In this way a portfolio 25 „Tricolore rendement“ presentation 2011.
  • 25. 22 manager who has got a 2% added value every year for 5 years will have a spread performance with the bench of 21.4% if the market has been growing during these five years. But if the market were flat he would have only got a 10.4% outperformance. In the accountancy method with international portfolio there is a crossed term between the market effect and the currency effect. If the market grows by 10% and the foreign currency will go up by 5% against euro: the investment will have a 15.5% total return. How to attribute this 0.5% excess return? Problem: No risk information, no volatility information To be consistent, the risk taken by the portfolio managers (i.e. the volatility) must be the same vein as said at the beginning. If not the measurement are biased and you can come up with completely wrong conclusion or misunderstanding of the nature of the portfolio. It is crucial to choose the benchmark in terms of its composition as well as in terms of its volatility If this is not considered there is a risk in misunderstanding the added value created by the portfolio manager and the risk premium linked to a higher systematic risk over the benchmark. All these previous methods just highlight a situation at a certain time but nothing is said what happened between two the path. 5. Conclusion As Mutual Funds are, in terms of AUM and of number of entities, the most important type of investment company worldwide 26 , we have focused our efforts to present in this thesis all the relevant aspects in performance evaluation for the specific case of this asset class. First of all, we have given a general definition of Mutual Fund, showing all their traditional features and peculiarities around different subclasses of Mutual Funds. Then, we have mentioned a relatively new class of open-end funds: Exchange Traded Funds. We have underlined the differences between them and Mutual Funds because, nowadays, a very lively debate is taking place, both in the industry and among academics, about which is the best investment vehicle among these two kind of open-end fund in terms of performance (active management vs. passive management). If we look at the empirical evidence, that we have presented in the second part of our thesis, we can come up saying that probably, in the case of investment in efficient financial markets, as the US financial market, Mutual Funds are not very efficient: only few Mutual Funds seem able to achieve positive alphas when we adjusted returns for risks. Typically, expense ratios, portfolio turnover, and load fees of the fund are significantly and negatively related to the performance 2728 . Empirical evidence says also 26 “2012 Investment Company Fact Book”, Investment Company Institute, 2012. 27 Edwin J. Elton, Martin J. Gruber, Sanjiv Das, Matthew Hlavka, “Efficiency with Costly Information: A Reinterpretation of Evidence from Managed Portfolios”, The Review of Financial Studies, Vol. 6, No.1 (1993), pp. 1- 22. 28 Mark M. Carhart, “On Persistence in Mutual Fund Performance,” Journal of Finance 52 (1997), pp. 57–82.
  • 26. 23 that also persistence of performance is difficult to find between Mutual Funds: Carhart 29 has found strong evidence of persistence in negative performance, but much weaker persistence in positive performance, and even persistence seems related to expenses and transactions costs rather than gross investment returns. This evidence suggests that Mutual Funds don’t create value for investors, even they have the ambition to beat the market, and probably ETFs, given the important role played by costs in determining the net performance of a fund, as they usually are cheaper than Mutual Funds, are able to provide better net returns adjusted for risk than Mutual Funds. The fact that we can observe a great number of Active Mutual Funds with poor past performance, leads to say that investors are not rational: but probably the explanation is that there is a lack of impartial and independent information on fund past performance and investors have difficult access to information on funds (and when it is easily available, it is normally very difficult understandable by a non-professional) 30 . In the third part of the thesis we have presented the traditional measures such as risk adjusted ratios and factor models widely used to evaluate returns of the portfolios. Naturally, they are different from each other, and so can be used to evaluate different aspects of the performance. These ratios enable us to measure the returns not only on the aspect of total risks, but also on systematic risks of the portfolios. They are also used to compare the performance between passive management and active management. Apart from the indicators above, Style Analysis 31 provides an alternative way in analyzing the funds performances from the perspective of investment behaviors. It reveals the strategy that most closely tracks the fund’s activity and measures performance relative to this strategy. Finally, we explain what a Performance Attribution Analysis is and how it works. This is a very important aspect in evaluation of mutual fund performance: it enables us to understand how those activities that compose the investment management process – investment policy, market timing and security selection – affect the returns 32 . We have presented the two main methods that are used to perform this analysis: the Return Decomposition Method (also known as Brinson Attribution) and the Financial Model Based Method. The first one is the most common approach, developed by Gary Brinson and widely accepted by the industry, and it is also the more precise one: it allows us to decompose the added value of a fund performance in 6 different factors. The second model, instead, is less sophisticated than the first one, and it is based on CAPM model. It decomposes the performance in two factors: beta, namely the market sensitivity, and alpha, that capture the stock picking effect. 29 Mark M. Carhart, “On Persistence in Mutual Fund Performance,” Journal of Finance 52 (1997), pp. 57–82. 30 David Blake, Allan Timmermann, “Performance Persistence in Mutual Fund: An Independent Assessment of the Studies Prepared by Charles River Associates for the Investing Management Association”, Prepared for the FSA, April 2003 31 “Investments”, Zvi Bodie, Alex Kane, Alan J. Marcus, 9th edition, 2011, McGraw-Hill/Irwin. 32 Gary P. Brinson, L. Randolph Hood and Gilbert L. Beebower, “Determinants of Portfolio Performance”, Financial Analysts Journal Vol. 42, No. 04 (1986), pp.39-44.
  • 27. 24 Bibliography • “2012 Investment Company Fact Book”, Investment Company Institute, 2012. • BlackRock. “ETF LandScape. Industry Review”, end January 2011. • Carl Bacon, “Evolution of Performance Attribution Methodologies”, June 2004. • Damien Laker, “Fundamentals of Performance Attribution: The Brinson Model.” • David Blake, Allan Timmermann, “Performance Persistence in Mutual Fund: An Independent Assessment of the Studies Prepared by Charles River Associates for the Investing Management Association”, Prepared for the FSA, April 2003. • Dr. Stefan J. Illmer, “Overview of Performance Attribution”, April 2010. • Edwin J.Elton , Martin J.Gruber, Stephen J.Brown, William N. Goetzmann, “Modern portfolio theory and investment analysis”,6th edition, 2003, Wiley. • Edwin J. Elton, Martin J. Gruber, Sanjiv Das, Matthew Hlavka, “Efficiency with Costly Information: A Reinterpretation of Evidence from Managed Portfolios”, The Review of Financial Studies, Vol. 6, No.1 (1993), pp. 1-22. • Eugene F. Fama, Kenneth R. French, “Luck versus Skill in the Cross Section of Mutual Fund Returns”, Working Paper, forthcoming in the Journal of Finance, December 2009. • Fama, Eugene F., French, Kenneth R., “The Cross-Section of Expected Stock Returns”, Journal of Finance, Vol. 47, No. 2 (1992), pp. 427-465. • Gary P. Brinson, L. Randolph Hood and Gilbert L. Beebower, “Determinants of Portfolio Performance”, Financial Analysts Journal Vol. 42, No. 04 (1986), pp.39-44. • Jensen, M.C., “The Performance of Mutual Fund in the Period 1945-1964”, Journal of Finance, No.23 (1968), pp. 389-416. • Jason C. Hsu, Vitali Kalesnik, and Brett W. Myers, “Performance Attribution: Measuring Dynamic Allocation Skill”. • Jonathan B. Berk, Richard C. Green, “Mutual Fund Flows and Performance in Rational Markets”, Journal of Political Economy, Vol. 112, No. 6 (2004), pp. 1269-1295. • Kent Daniel, Mark Grinblatt, Sheridan Titman, Russ Wermers, “Measuring Mutual Fund Performance with Characteristic-Based Benchmarks”, The Journal of Finance, Vol. 52, No. 3 (1997), pp. 1035-1058. • Lori Lucas, Mark W. Riepe, “The Role of Returns-Based Style Analysis: Understanding, Implementing, and Interpreting the Technique”, 1996, working paper. • Luc Dumontier, “Gestion Quantitative”. • Mark M. Carhart, “On Persistence in Mutual Fund Performance,” Journal of Finance 52 (1997), pp. 57–82. • Nicolas P. B. Bollen, Jeffrey A. Busse, “Short-Term Persistence in Mutual Fund Performance”, The Review of Financial Studies, Vol. 18, No. 2 (2004), pp. 569-597 • Performance Attribution for Equity Funds and Categories Methodology, Morningstar Methodology Paper, September 30, 2011 • Roger Otten, Dennis Bams, “European Mutual Fund Performance”, European Financial Management, Vol. 8, No. 1 (2002), pp. 75-101.
  • 28. 25 • Russ Wermers, “Mutual Fund Performance: An Empirical Decomposition into Stock-Picking Talent, Style, Transactions Costs, and Expenses”, The Journal of Finance, Vol. LV, No. 4 (2000), pp. 1655-1695. • Sanford J. Grossman, Joseph E. Stiglitz, “On the Impossibility of Informationally Efficient Markets”, American Economic Review, 70 (1980), pp. 393-408. • Sharpe, W. F., “Mutual Fund Performance”, Journal of Business, No. 39 (1966), pp. 119-138. • Stephen G. Kellison, “The Theory of Interest”, 3rd edition, 2008, McGraw-Hill/Irwin. • Zvi Bodie, Alex Kane, Alan J. Marcus, “Investments”, 9 th edition, 2011, McGraw-Hill/Irwin.
  • 29. 26 APPENDIX 1. Interview with a Fund of Funds Manager We have decided to interview a professional portfolio manager in order to get a view of how, in the asset management business, professionals assess performance of funds. We choose precisely a fund of fund manager because his job is to look at the fund performances and to pick up the best fund in order to generate alpha, and so create value for investors. It is a French famous asset management firm among the group Edmond de Rothschild. They manage about 20 billion euros and this desk about 2 billion euros. The portfolio manager is named Quentin Doulcet, junior, and dedicated to Fixed Income funds. Can you explain to us how do you manage to invest in funds, what are your criteria in your investment process? Q.D.: The moment we meet with the investment manager, the responsible of the portfolio is the most important part. Our analysis is clearly based in this qualitative analysis and in particular the understanding of the investment manager of its segment of his investment process and the coherence about what he has told to us his personality, his experience of the market and the transparency of his management. If for example he does not want to tell the current bets he has been doing in his portfolio it is a bad sign. What he can explain to us is critical. For example it happened to me for an Asia short duration fund which had similar performances to some high yield funds. We could not understand the sources of this outperformance. There was a problem of coherence with its own asset class. He could not justify his performance. He did not want to say which traded was generating the performance. So the aspect of explaining the source of the performance is a big deal before investing. And also the understanding of the performance and the selection process of the investment manager is also important as well. The speech of the investment manager must but clear regarding his management objectives. So, we agree that this phase comes after, I suppose, a kind of screening of the Long Only universe fund database? Q.D.: Yes, the first step is a large screening that we do every 6 months with the Morning Star tools. We look for the difference performances and volatility of the funds. We check their ranking among their peers and regarding their quartile. A ranking is made by Morning Star which regroups similar funds together to have some clear pools of funds (same
  • 30. 27 strategies/AUM etc...). We especially look up for the funds that really outperform their peers for more than 3 years. Also the salesmen of the investment firms come to meet us up to show their different funds. It is another source of funds in which we are likely to invest without making the screening process. Sometimes the investment firms organize some meetings talking about macroeconomics, markets and often a fund is backed and they present the funds after. What comes after is the pure quantitative analysis. You can check an example. Firstly we check the entire common ratio linked to performance and volatility (Sharpe etc…). We calculate also the Information Ratio, Max Draw Down, and a lot of different criteria to get the big pictures of the funds in a quantitative way. By the end we have to come up with the conclusion either or not the fund is coherent with what it is written in the PPM and prospectus and also if the fund is not beavering too different from its benchmark. Then we proceed to at least one conference call and we try to meet the responsible of the portfolio. Another important point is that we do also financial and operational due diligence with the different investment firms. If for example it is a new small investment firm that we do not know well we will produce a financial and operational due diligence before investing. We will investigate into the structure of the firms; get to know more about the portfolio managers, their experience and track records and also the different analysts. We will toward to check: the turnover ratio of the staff, how much money the execs have in the firms, ownership and the AUM composition (to know if it is concentrated or not). It is as much important as to find a fund with a good track. We also look up at how they proceed to value their asset and calculate the NAV. The following part is about analyzing the portfolio of the fund. We ask to the PM the composition of its portfolio and we look at if it is coherent with what he had said. The risk structure is also very important. We check if he does not take too much risk on few lines. For example with a bond portfolio we look to the duration structure, by yield to know if the global duration of the portfolio does not come from one or two lines and what lines bear the more risk. It is speaking from a bond portfolio point of view but it is strictly the same regarding an equity funds. They look at the cVAR95 by line, how the risk is diversified, into many lines or not how the risk is diversified. At the end the idea is to really understand how the PM build his portfolio and the selection process and how he explains the performance. In a « value creation » point of view, it is essentially present in the qualitative analysis?
  • 31. 28 Q.D.: Well yes, the quantitative analysis anyone can do that or get one from an analyst. The value creation is poor in an quantitative analysis. For us the quantitative analysis is almost a part of the screening. It is something that comes before, a prerequisite in some words. If a fund has got a poor performance we will not look at it anyway. We will be keen to look a fund with a good Information Ratio, which means that he has been well doing and we will want to know how he has managed to get this outperformance. Has he been taking much more risk than its benchmark or index or not? He can have an outperformance but if he has a tracking error ratio above 15 it is a lot and it means that he has been taking risk outside the index and they are very strong. You have to understand how the outperformance is done where it comes from. If the tracking error is very close it means that he has selected all the items that have outperformed the index. Then you have to analyze how it is diversified and so on… How do you manage the persistence or the returns over-time? Q.D.: We try to meet on a regular basis the investment managers or the investment relationship and our investment are in long terms, about 3 to 5 years. An important point to notice is how the fund does in a certain market condition and especially stressed ones, for example during the short fall in September 2008 or more recently in August 2011. This is very important and can be very relevant on how the PM handles bearish or volatile markets and helps a lot to understand how the performance is created. We try to understand how the fund behaves during a turmoil market. For example if the fund style is defensive and that the funds is dropping more that some dynamic called fund there is obviously a problem and we need to have some explanations from the PM. That is what we do, as soon as we have something we do not understand regarding the performance of the fund we call them. If over a week time a fund is flat and the market is 6% up we ask to the PM what happened and it is not necessarily bad all that matter is his answer if it is coherent or not. We look up if he is still inside his strategy and if he is transparent or not. If he says “we were on that particular stock and the quarterly results were not what we expected” but still follow a precise strategy it is still OK. For example one time we were invested in a fund that held some Facebook stock through Morgan Stanly during the IPO. The PM of the fund did not want to tell us that they were effectively holding all lot of them and they faced a huge drop in their NAV that only this could explain during the IPO‘s week. The fund did not want to share with us the information. So we sold all our positions. Can it be a factor to sell your entire position?
  • 32. 29 Q.D.: Yes exactly. Trust is very important in this business. It is all a matter of trust. The senior managers Mr. Hacques and Mr. Gérald did not trust them anymore. Even if some of their other funds were performing well in the same investment firm and although that we held some of them we liquidate all our positions, even if the others funds had not direct relationship with the Facebook deal. When the trust is gone, we short. This criterion is very, very important, can you trust the PM or not. How do you manage the investment committees? Q.D.: The way to proceed changes a lot from a firm, team to another. Every fund of fund team can proceed from another way. For example insurance fund of funds they have to respect a strict allocation and they cannot bet on such and such macro event. We are free to take some tactical bets regarding the market environment and we can use derivatives or ETF. We play a lot with the tactical allocation of our different asset classes inside each fund. You can either be a fund of fund which its only alpha source comes from the fund selection (bottom up approach) or you can mix it with a dynamic allocation approach with technical bets. It is rather our investment style with Mr. Jacques (the Head of the desk). It is really driven by an allocation process. It is a way to generate some alpha. During the investment committees we talk a lot about markets, economical factors and regarding that we build up an asset allocation scheme. Comment We can regroup the ideas of this interview in categories: i. the quantitative & screening process; ii. the qualitative aspects; But to sum up we can say that the understanding of the portfolio manager investment style is the most important. About the Quantitative Aspects, what is interesting is that they consider that the quantitative analysis is poor in terms of added value. It is just a pre-requisite in order to go further in the investment process. Almost everybody can run up a quantitative analysis and pick up funds with the best ratios; but building a portfolio is not that simple by the simple fact that returns are not persistent over time. Besides they outsource their databases to Morning Star. They do not only focus on a particular ratio in an absolute way. They compare the fund with their peers and firstly pick up the top quartile funds of them (mainly according to the returns/volatility couple).
  • 33. 30 Screenshot of the Sample Quant analysis.pdf given by Edmond de Rothschild. In the Sample Quant analysis.pdf they gave us, we can see that they also use a lot of rolling ratio in order to know how these ratios react over time and especially during certain market conditions. We can also notice that the half of it is about the excess return vs. the benchmark, meaning that the benchmark is very important in the analysis of the fund. A wrong benchmark can lead to misleading conclusions. In this kind of document it is easy to see how the fund reacts in a particular market condition (in September 2008 or in August 2011). Is it sticking to its benchmark or generating abnormal returns? Regarding Qualitative Aspects: once they get all these information and think that it is worth to search deeper about the fund they contact the investor relationship of the asset management fund and try to set a meeting with the PM, or an analyst of the fund. The object of the meeting is to know if the PM, or the analyst, is coherent and give some trade examples or trade ideas. So not only the performance in itself is a good indicator to understand a fund before investing. The main question that has to be answered is “Are the returns of the funds coherent with the strategy and/or with related asset class?” The PM of the interview made a clear example with the short duration fund. The qualitative aspect is as much important as a good Sharpe Ratio or a theoretical calculated alpha. Knowing the composition of the portfolio is also an important part. With that you can know if the PM is coherent with his strategy, and to know the liquidity of the underlying.
  • 34. 31 That is why they also proceed to the due diligence of funds. It fully belongs to the investment process. The first thing to do is to check if the fund really exists, who are the PMs, their backgrounds, their track records, the middle office and risk management structure, the ownership structure, the liabilities structure of the fund (is it concentrated or not: meaning that if it is very concentrated a withdrawing of a single big investor may have some incidences toward the overall portfolio and therefore is a source of risk – especially if it is not a very liquid asset class, such as small or mid-cap). All these aspects help to understand if the fees are worth regarding the service provided. 2. Quantitative Analysis of 3 Funds To complete this appendix focused on analysis of funds’ performance, we decided to go more into practice. So we built up an Excel VBA tool in order to make an example of a quantitative analysis of several funds having the same benchmark as if we were analysts for a fund of funds. The data are from Bloomberg and weekly. Here is brief review of the main characteristics of the quantitative analysis.
  • 35. 32 Brief description of the funds The three funds that we have chosen to run our quantitative analysis are invested in DAX stocks and have for objective to outperform the benchmark. UIB5 GR EQUITY FRNKSPR GR EQUITY ADIGDEU GR EQUITY UBS D Aktienfonds - Special I Frankfurter-Sparinvest Deka Pioneer Investments Aktien Deu Bench A = DAX We can see that the three funds underperform the benchmark and the performances seem really correlated. We can definitely see that they are different cluster in the volatility structure and the three funds behave almost in the same way at the same time. 70 90 110 130 150 170 190 Frankfurter-Sparinvest Deka ADIGDEU GR EQUITY Bench A UBS D Aktienfonds - Special I 0,00% 20,00% 40,00% 60,00% 14/01/200428/05/200510/10/200622/02/200806/07/200918/11/201001/04/201214/08/2013 Rolling 6 months Volatility Pioneer Investments Aktien Deu UIB5 GR EQUITY FRNKSPR GR EQUITY
  • 36. 33 In the above chart, what we can see when we analyze the tracking error we can see a high pick in September 2008. It goes up to 35% with the UBS funds. This means that at that time this fund may have taken bet outside the benchmark and the PM must be interviewed about this. In a normal period this funds has the lowest tracking error (between 10% and 5%) which makes the situation even stranger. Generally the three fund do not generate a lot of alpha (between minus 20bps and +20bps). We can see a huge destruction of alpha during the bankruptcy of Lehman Brothers. The only fund which is sticking to an relative flat rolling alpha is the Pioneer. In the Lehman crisis it did not destroy as much alpha as the other funds. 0,00% 5,00% 10,00% 15,00% 20,00% 25,00% 30,00% 35,00% janv.-04 mai-05 oct.-06 févr.-08 juil.-09 nov.-10 avr.-12 août-13 Rolling 6 months Tracking Error Pioneer Investments Aktien Deu FRNKSPR GR EQUITY UIB5 GR EQUITY -1,00% -0,80% -0,60% -0,40% -0,20% 0,00% 0,20% 0,40% janv.-04 mai-05 oct.-06 févr.-08 juil.-09 nov.-10 avr.-12 août-13 Rolling 6 months Alpha Pioneer Investments Aktien Deu FRNKSPR GR EQUITY UIB5 GR EQUITY
  • 37. 34 The distribution of the three funds is closely the same. We can see that funds have negative skew by the shape of the bell. The tails of the index are fatter especially the -8%. 0 20 40 60 80 100 120 -0,1 -0,08 -0,06 -0,04 -0,02 0 0,02 0,04 0,06 0,08 0,1 Weekly Return Distribution Pioneer Investments Aktien Deu Index UIB5 GR EQUITY FRNKSPR GR EQUITY
  • 38. 35 When we analyze the different ratio below added to the previous comment it comes clearly that the Pionneer fund is the best of the three: - Higher Sharpe Ratio; - Lower MDD; - Lower Skew.