![[object Object],44](data:image/gif;base64,R0lGODlhAQABAIAAAAAAAP///yH5BAEAAAAALAAAAAABAAEAAAIBRAA7)
Recomendados
Mais conteúdo relacionado
Mais procurados
Mais procurados (16)
Destaque
Destaque (8)
Semelhante a Measurement Graphing
Semelhante a Measurement Graphing (20)
Mais de Highline Academy
Último
Último (20)
Measurement Graphing
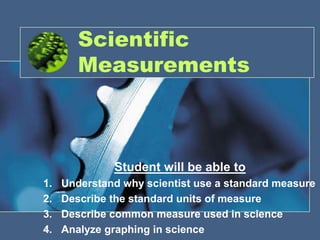
- 1. Scientific Measurements Student will be able to Understand why scientist use a standard measure Describe the standard units of measure Describe common measure used in science Analyze graphing in science
- 8. Liter (l)+ Milliliter (ml) 50
- 14. Median = Middle
- 15. Mode = Most often66
- 16. • Graphs
- 17. - Graphs vs. Text At age 1, Sarah was 75 cm tall. By the time she turned 2, Sarah had grown 10 cm. By age 3, she had grown another 10 cm. At age 4, Sarah was 100 cm tall. + Which is better? 68
- 18. - Line Graphs + Example Experiment – Boiling Water 70
- 19. - Line Graph + Draw Axis √ X “What you changed” √ Y “What was measured” + Create Scale + Plot Data + Draw best fit line 71
- 20. - Best Fit Line + Follow general trend + Include as many points as possible + Have same # of points above and below 72
- 21. - Identify Trends 74
- 22. Worksheet