

Recomendados
Recomendados
Mais conteúdo relacionado
Mais procurados
Mais procurados (16)
Destaque
Destaque (15)
Semelhante a Emmar properties equity report
Semelhante a Emmar properties equity report (20)
Último
Último (20)
Emmar properties equity report
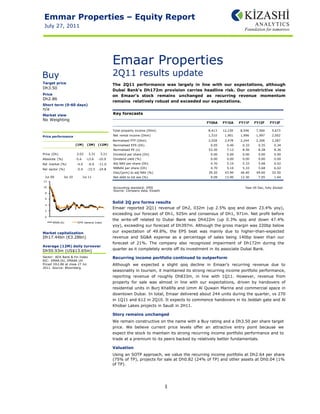
- 1. Emma Prop ar perties – Equit Report ty July 27, 2011 Em maar Prop pertie es Buy 2Q11 resu ults up pdate Target price Q11 perform The 2Q mance was largely in line with our ex xpectations, a although Dh3.50 Dubai Bank's Dh1772m provision carries hea adline risk. Our constricti O ive view Price on Em maar's stock remains un nchanged as recurring revenue mo s omentum Dh2.86 remain relatively robust and exceeded our expectations ns e s. Short term (0- -60 days) n/a Market view Key fo orecasts No Weighting FY Y09A FY10A FY11F FY12F FY13F Total property income (Dhm m) 8, ,413 12,150 8,546 7,560 5,673 ce Price performanc Net renta income (Dhm) al 1, ,510 1,901 1,996 1,997 2,002 Normalise PTP (Dhm) ed 2, ,028 2,478 2,244 2,306 2,287 (1M) (3M) (12M) Normalis sed EPS (Dh) 0.05 0.40 0.33 0.35 0.34 Normalis sed PE (x) 53.30 7.12 8.56 8.28 8.36 Price (Dh) 3.03 3.31 3.21 Dividend per share (Dh) 0.00 0.00 0.00 0.00 0.00 Absolute (%) -5.6 -13.6 -10.9 Dividend yield (%) 0.00 0.00 0.00 0.00 0.00 Rel market (%) -4.0 -6.6 -11.0 Adj NAV per share (Dh) 4.70 5.10 5.33 5.68 6.02 Rel sector (%) -5.4 -15.5 -24.8 NNNAV per share (Dh) p 4.70 5.10 5.33 5.68 6.02 Disc/(prm to adj NAV (%) m) 39.20 43.90 46.40 49.60 52.50 Jul 09 Jul 1 10 Jul 11 Net debt to tot ass (%) 9.09 13.90 12.30 7.05 1.64 12 10 Accountin standard: IFRS ng Year till Dec, fu ully diluted Source: Company data, Kiza C ashi 8 6 Solid 2 pro forma results 2Q 4 Emaar reported 2Q11 revenue of Dh2, 032m (u 2.5% qoq a up and down 23.4 4% yoy), 2 exceeding our forecast of Dh1, 925 and consen 5m nsus of Dh1, 9 971m. Net prof before fit 0 the write-off related to Dubai Ban was Dh422 nk 2m (up 0.3% qoq and down 47.4% n EMAR.DU DFM General Ind dex yoy), e exceeding our f 397m. Although the gross ma forecast of Dh3 argin was 220b below bp Market capital lization our expectation of 4 49.8%, the EP beat was m PS mainly due to higher-than-e expected Dh17.44bn (€ €3.28bn) revenue and SG&A e expense as a percentage of sales being 140bp lower t f than our forecas of 21%. The company also recognized impairment o Dh172m du st of uring the Average (12M) daily turnove er Dh50.93m (US$13.65m) quarter as it complete wrote off it investment in its associate Dubai Bank. r ely ts e Sector: ADX Bank & Fin Index Recurr ring income p portfolio cont tinued to outp perform RIC: EMAR.DU, EM MAAR UH Priced Dh2.86 at close 27 Jul c Althoug we expected a slight q gh qoq decline in Emaar’s recu urring revenue due to e 2011. Source: Bloo omberg seasonality in tourism it maintained its strong recurring income portfolio perf m, e formance, reportin revenue of roughly Dh8 ng f 833m, in line with 1Q11. However, reven H nue from propert for sale wa almost in line with our e ty as expectations, d driven by hand dovers of ntial units in Burj Khallifa and Umm Al Quw residen wain Marina an commercial space in nd l downtoown Dubai. In t total, Emaar delivered about 244 units dur t ring the quarte vs 270 er, in 1Q11 and 612 in 2Q10. It expect to commenc handovers in its Jeddah ga and Al 1 ts ce n ate Khobar Lakes project in Saudi in 2H11. r ts Story r remains unch hanged We remmain constructi ive on the nam with a Buy r me rating and a Dh3.50 per shar target re price. We believe cuurrent price leevels offer an attractive enntry point beca ause we expect the stock to m maintain its str rong recurring income portfolio performanc and to ce trade a a premium to its peers bac at o cked by relative better fund ely damentals. Valuat tion Using a SOTP appro an oach, we value the recurring income portfolio at Dh2.64 p share per (75% o TP), projects for sale at Dh of s h0.82 (24% of TP) and other assets at Dh0 f r 0.04 (1% of TP). 1
- 2. Emmar Properties – Equity Report July 27, 2011 Income statement Particulars (Dhm) FY09A FY10A FY11F FY12F FY13F Net rental income 1510 1901 1996 1997 2002 Prop development income 6236 9270 5327 4352 2453 Other revenue 667.2 979.6 1222 1211 1218 Total property income 8413 12150 8546 7560 5673 Other costs -5358 -8715 -5429 -4735 -3255 EBITDA 3056 3436 3117 2825 2418 DDA & Impairment (ex gw) -635.7 -804.6 -724.6 -700.3 -671.4 EBITA 2420 2631 2392 2125 1747 Goodwill (amort/impaired) 0.00 0.00 0.00 0.00 0.00 EBIT 2420 2631 2392 2125 1747 Associates (pre-tax) -534.5 -430.5 -367.4 -250.0 -90.0 Net interest 139.0 -90.0 -50.1 86.3 260.6 Other pre-tax items 3.35 367.8 268.9 344.7 369.3 Reported PTP 2028 2478 2244 2306 2287 Taxation 23.5 -1.44 -6.74 0.00 0.00 Minority interests 37.9 -28.8 -200.5 -200.5 -200.5 Other post-tax items -1762 0.00 0.00 0.00 0.00 Reported net profit 327.3 2448 2037 2106 2086 Dividends declared 0.00 0.00 0.00 0.00 0.00 Tot normalised items 0.00 0.00 0.00 0.00 0.00 Normalised EBITDA 3056 3436 3117 2825 2418 Normalised PTP 2028 2478 2244 2306 2287 Normalised net profit 327.3 2448 2037 2106 2086 Source: Company data, Kizashi forecasts Year till Dec Balance sheet Particulars (Dhm) FY09A FY10A FY11F FY12F FY13F Cash & market secs (1) 2797 2468 2299 2655 4630 Props under dev 31076 26492 25171 23820 23130 Other current assets 1388 4170 5061 4981 4901 Investment prop 8546 8110 7905 7594 7294 Other non-current assets 20338 21264 20452 19713 19051 Total assets 64145 62504 60888 58763 59006 Short term debt (2) 4500 4455 5003 2503 1903 Long term debt (3) 4125 6714 4796 4296 3696 Other liabilities 26641 21794 19915 18484 17641 Total liabilities 35266 31204 27953 23522 2147 Total equity (incl min) 28879 31300 32935 35241 37528 Total liab & sh equity 64145 62504 60888 58763 59006 Net debt 5828 8701 7500 4144 969.1 Source: Company data, Kizashi forecasts Year ended Dec Cash flow statement Particulars (Dhm) FY09A FY10A FY11F FY12F FY13F EBITDA 3056 3436 3117 2825 2418 Change in working capital -5012 -3320 -954.2 199.5 127.1 Net interest (pd) / rec 0.00 90.0 50.1 -86.3 -260.6 Taxes paid -3.00 3.13 0.64 0.00 0.00 Other oper cash items 327.4 255.7 219.9 431.0 629.9 Cash flow from ops (1) -1632 464.3 2433 3370 2915 Capex (2) -1866 -778.8 -172.2 -100.0 0.00 Disposals/(acquisitions) 6.42 606.5 21.3 0.00 0.00 Other investing cash flow -930.7 -2626 -578.5 371.4 417.6 Cash flow from invest (3) -2790 -2798 -729.4 271.4 417.6 Incr / (decr) in equity 0.00 0.00 0.00 0.00 0.00 Incr / (decr) in debt 1196 816.5 -3194 -3000 -1200 Ordinary dividend paid -3.57 -1.21 -0.08 0.00 0.00 Preferred dividends (4) 0.00 0.00 0.00 0.00 0.00 Other financing cash flow 17.2 1444 1376 -285.1 -157.0 Cash flow from fin (5) 1210 2259 -1817 -3285 -1357 Forex & disc ops (6) -102.2 -11.9 -9.30 0.00 0.00 Inc/(decr) cash (1+3+5+6) -3315 -86.7 -122.8 355.9 1975 Equity FCF (1+2+4) -3498 -314.5 2261 3270 2915 Source: Company data, Kizashi forecasts Year till Dec 2
- 3. Emmar Properties – Equity Report July 27, 2011 Recommendation structure Absolute performance, long term (fundamental) recommendation: The recommendation is based on implied upside/downside for the stock from the target price and only reflects capital appreciation. A Buy/Sell implies upside/downside of 10% or more and a Hold less than 10%. Performance parameters and horizon: Given the volatility of share prices and our pre-disposition not to change recommendations frequently, these performance parameters should be interpreted flexibly. Performance in this context only reflects capital appreciation and the horizon is 12 months. Market or sector view: This view is the responsibility of the strategy team and a relative call on the performance of the market/sector relative to the region. Overweight/Underweight implies upside/downside of 10% or more and Neutral implies less than 10% upside/downside. Target price: The target price is the level the stock should currently trade at if the market were to accept the analyst's view of the stock and if the necessary catalysts were in place to effect this change in perception within the performance horizon. In this way, therefore, the target price abstracts from the need to take a view on the market or sector. If it is felt that the catalysts are not fully in place to effect a re-rating of the stock to its warranted value, the target price will differ from 'fair' value. Valuation and risks to target price Emaar Properties (RIC: EMAR.DU, Rec: Buy, CP: Dh2.86, TP: Dh3.50): We value Emaar Properties using a sum- of-the-parts methodology, from which we derive our target price. Key risks to our target price include potential delays in raising domestic and international capital as core market stresses still prevail and we expect a continued decline in house prices. 3
- 4. Emmar Properties – Equity Report July 27, 2011 Contact Us India Office 23#24 Sunpoint Complex Ground Floor, Near Gurukul Temple, Gurukul Road. Ahmedabad - 380052. Gujarat. Inquire at info@kizashianalytics.com Visit us at www.kizashianalytics.com Disclaimer The report is prepared on behalf of Kizashi Analytics. This report is not, or should not be, relied upon in any way as a promise or representation as to future results, earnings or events. Kizashi reserves the right to modify data without providing any reason for such modifications. Any information delivered by Kizashi in this report is not intended to provide the basis of any evaluation of the market trend and share prices and should not be considered as a recommendation that any prospective or actual investor should underwrite to shares on basis of the prices listed herein in the report. In making any investment decisions, prospective investors should not rely on this report or on any other information. Kizashi shall not accept any responsibility for updating this information. No agency, authority or exchange has passed upon the accuracy or adequacy of this report, or the merits of an investment in any product herein. 4