Marginal costing
•Transferir como PPTX, PDF•
16 gostaram•12,942 visualizações

This document provides an overview of marginal costing and cost-volume-profit (CVP) analysis. It defines key terms like marginal cost, contribution, fixed and variable costs. It explains the differences between marginal and absorption costing approaches. The objectives and concepts of CVP analysis are outlined, including break-even point, margin of safety, contribution ratio and angle of incidence. Formulas for calculating items like break-even sales, break-even point and composite break-even point are presented. Advantages and limitations of marginal costing are listed.

Recomendados
Mais conteúdo relacionado
Mais procurados
Mais procurados (20)
Destaque
Destaque (20)
Semelhante a Marginal costing
Semelhante a Marginal costing (20)
Mais de sai precious
Mais de sai precious (20)
Marginal costing
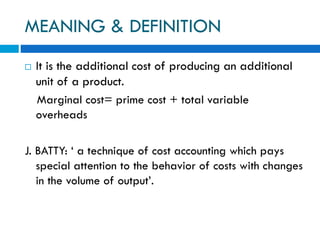
- 1. MEANING & DEFINITION It is the additional cost of producing an additional unit of a product. Marginal cost= prime cost + total variable overheads J. BATTY: ‘ a technique of cost accounting which pays special attention to the behavior of costs with changes in the volume of output’.
- 2. MARGINAL COSTING ADVANCED COST AND MANAGEMENT
- 3. FEATURES OF MARGINAL COSTING 1) Control or decision making 2) Classification 3) Fixed cost 4) Variable cost 5) Contribution 6) Profitability 7) Ascertain profit 8) Cost-volume-profit relationship
- 4. ADVANTAGES 1. Simplicity 2. Stock valuation 3. Meaningful reporting 4. Effect of fixed costs 5. Profit planning 6. Cost control and cost reduction 7. Pricing Policy 8. Helpful to Management
- 5. LIMITATIONS 1. Classificationofcost 2. Notsuitableforexternalreporting 3. LackofLong-termperspective 4. Undervaluationofstock 5. Automation 6. Productionaspectisignored 7. Notapplicableinalltypesofbusiness 8. Misleadingpicture 9. LessscopeforLong-termpolicydecision
- 6. DIFFERENCE BETWEEN MARGINAL AND ABSORPTION COSTING CHARGING OF COST Fixed cost form part of total cost of production and distribution. VALUATION OF STOCK Stock and work-in-progress are valued ay both fixed and variable costs i.e, total cost. Variable cost alone forms part of total cost of production and sales whereas fixed costs are charged against contribution for determination of profit. Stocks are valued at variable cost only. ABSORPTION COSTING MARGINAL COSTING
- 7. VARIATION IN PROFITS When there is no sales the entire stock is carried forward and there is no trading profit or loss. PURPOSE It is more suitable for long term decision making and for pricing policy over long term. EMPHASIS It lays emphasis on production. If there is no sales the fixed overhead will be treated as loss in the absence of contribution. It is not carried forward as a part of stock value. It is more useful for short term managerial desion making. It lays emphasis on selling and pricing aspects. ABSORPTION COSTING MARGINAL COSTING
- 8. COST-VOLUME-PROFIT ANALYSIS Cost-Volume-Profit analysis is the analysis of three variables, i.e. cost, volume and profit. Cost-Volume-Profit analysis helps the management in profit planning. Profit of a concern can be increased by increasing the output and sales or reducing cost. “The most significant single factor in planning of the average business is the relationship between the volume of business, its costs and profit.” -HEISER
- 9. OBJECTIVES Cost-Volume-Profit analysis is made with the objective of ascertaining the following: The cost for various levels of production The desirable volume of production The profit at various levels of production The difference between sales revenue and variable cost.
- 10. CONCEPTS AND TERMS 1. FIXED COST 2. VARIABLE COST 3. CONTRIBUTION 4. CONTRIBUTION TO SALES/ PRROFIT VOLUME RATIO 5. BREAK EVEN ANALYSIS 6. MARGIN OF SAFETY 7. ANGLE OF INCIDENCE 8. BREAK EVEN CHARTS
- 11. FIXED COST Total of cost like “period cost” or “time costs” Does not depend on volume of production and sales Fixed costs remain constant Fixed cost are fixed in total but variable in unit. Eg: salary rent, manager’s salary etc known as fixed overheads
- 12. VARIABLE COST Increase or decrease in proportion to sales and output. Called as ‘product costs’ or ‘marginal costs’ Vary in direct proportion to output. Variable costs vary in total but they remain constant per unit. Eg: direct material, direct wages etc
- 13. CONTRIBUTION It’s the difference between sales and marginal costs Used to find profitability of products, processes, departments and divisions. contribution = selling price-marginal cost Contribution= fixed expenses + profit Contribution – fixed assets = profit
- 14. CONTRIBUTION TO SALES / PROFIT VOLUME RATIO Relationship between sales and contribution High P/V ratio indicate high profitability Low P/V ratio indicate low profitability Expressed in percentage P/V ratio= contribution sales- variable fixed costs + profit ----------------- (or) ------------------- (or) ------------------------ sales sales sales When two periods, profit and sales given then, P/V ratio = change in profits ----------------------- change in sales
- 15. BREAK EVEN ANAYSIS AND BREAK EVEN POINT Relationship between revenue and costs in relation to sales volume Determination of volume of sales at which total costs are equal o revenue. MATZ CURRY & FRANK : “ a break even analysis determines at what level cost and revenue are in equilibrium”
- 16. FORMULA BREAK EVEN POINT: B.E.P = fixed expenses fixed cost break even sales value --------------------------------------------------------- (or) --------------------------- (or) -------------------------------- selling price per unit- marginal cost per unit contribution per unit selling price per unit BREAK EVEN POINT OR BREAK EVEN SALES VALUE B.E.S.V= break even point in units * salling price per unit (or) = fixed cost ---------------- P / V ratio Break even ratio = break even sales ---------------------- * 100 actual sales COMPOSITE BREAK EVEN POINT Composite break even point in value = total fixed cost ---------------------------------------------------------------------------------------------------- Composite p/v ratio (= individual PV ratio * % of each product to total sales) Break even capacity or break even point: capacity B.E.P = B.E.P in units break even point in rupees -------------------------------- * 100 (or) ------------------------------------ *100 total capacity in rupees total capacity in rupees
- 17. MARGIN OF SAFETY Difference between actual sales and break even sales. Indicate value/volume of sales which directly contribute to profit Expressed in rupees, units or even in percentage margin of safety= actual sales- break even sales (or) = profit --------- P V ratio Margin of safety ratio: expressed in ratio Margin of safety ratio= margin of safety/ actual sales* 100
- 18. ANGLE OF INCIDENCE Graphic presentation of marginal cost data The angle at which the sales line crosses the total cost line is called the ‘angle of incidence’ Bigger angle gives more contribution and profit with additional sale High P/V ratio and comparatively less variable cost= high angle of incidence Eg: break-even chart
- 19. BREAK EVEN CHARTS Graphical representation of marginal costing Show inter-relation between cost, volume & profit
- 20. Thank u……..