

Recomendados
Recomendados
Mais conteúdo relacionado
Mais procurados
Mais procurados (20)
Destaque
Destaque (20)
Semelhante a Coal india ipo_analysis
Semelhante a Coal india ipo_analysis (20)
Mais de Kinshook Chaturvedi
Mais de Kinshook Chaturvedi (20)
Coal india ipo_analysis
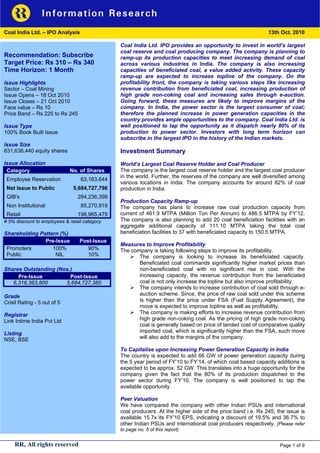
- 1. Coal India Ltd. – IPO Analysis 13th Oct. 2010 Coal India Ltd. IPO provides an opportunity to invest in world’s largest coal reserve and coal producing company. The company is planning to Recommendation: Subscribe ramp-up its production capacities to meet increasing demand of coal Target Price: Rs 310 – Rs 340 across various industries in India. The company is also increasing Time Horizon: 1 Month capacities of beneficiated coal, a value added activity. These capacity ramp-up are expected to increase topline of the company. On the Issue Highlights profitability front, the company is taking various steps like increasing Sector – Coal Mining revenue contribution from beneficiated coal, increasing production of Issue Opens – 18 Oct 2010 high grade non-coking coal and increasing sales through e-auction. Issue Closes – 21 Oct 2010 Going forward, these measures are likely to improve margins of the Face value – Rs 10 company. In India, the power sector is the largest consumer of coal; Price Band – Rs 225 to Rs 245 therefore the planned increase in power generation capacities in the country provides ample opportunities to the company. Coal India Ltd. is Issue Type well positioned to tap the opportunity as it dispatch nearly 80% of its 100% Book Built Issue production to power sector. Investors with long term horizon can subscribe in the largest IPO in the history of the Indian markets. Issue Size 631,636,440 equity shares Investment Summary Issue Allocation World’s Largest Coal Reserve Holder and Coal Producer Category No. of Shares The company is the largest coal reserve holder and the largest coal producer in the world. Further, the reserves of the company are well diversified among Employee Reservation 63,163,644 various locations in India. The company accounts for around 82% of coal Net Issue to Public 5,684,727,796 production in India. QIB's 284,236,398 Production Capacity Ramp-up Non Institutional 85,270,919 The company has plans to increase raw coal production capacity from Retail 198,965,479 current of 461.9 MTPA (Million Ton Per Annum) to 486.5 MTPA by FY’12. # 5% discount to employees & retail category The company is also planning to add 20 coal beneficiation facilities with an aggregate additional capacity of 111.10 MTPA taking the total coal Shareholding Pattern (%) beneficiation facilities to 37 with beneficiated capacity to 150.5 MTPA. Pre-Issue Post-Issue Measures to Improve Profitability Promoters 100% 90% The company is taking following steps to improve its profitability. Public NIL 10% The company is looking to increase its beneficiated capacity. Beneficiated coal commands significantly higher market prices than Shares Outstanding (Nos.) non-beneficiated coal with no significant rise in cost. With the Pre-Issue Post-Issue increasing capacity, the revenue contribution from the beneficiated 6,316,363,800 5,684,727,360 coal is not only increase the topline but also improve profitability. The company intends to increase contribution of coal sold through e- Grade auction scheme. Since, the price of raw coal sold under this scheme Crisil Rating - 5 out of 5 is higher than the price under FSA (Fuel Supply Agreement), the move is expected to improve topline as well as profitability. Registrar The company is making efforts to increase revenue contribution from Link Intime India Pvt Ltd high grade non-coking coal. As the pricing of high grade non-coking coal is generally based on price of landed cost of comparative quality Listing imported coal, which is significantly higher than the FSA, such move NSE, BSE will also add to the margins of the company. To Capitalise upon Increasing Power Generation Capacity in India The country is expected to add 66 GW of power generation capacity during the 5 year period of FY’10 to FY’14, of which coal based capacity additions is expected to be approx. 52 GW. This translates into a huge opportunity for the company given the fact that the 80% of its production dispatched to the power sector during FY’10. The company is well positioned to tap the available opportunity. Peer Valuation We have compared the company with other Indian PSUs and international coal producers. At the higher side of the price band i.e. Rs 245; the issue is available 15.7x its FY’10 EPS, indicating a discount of 19.5% and 36.7% to other Indian PSUs and international coal producers respectively. (Please refer to page no. 5 of this report). RR, All rights reserved Page 1 of 9
- 2. Coal India Ltd. – IPO Analysis Coal Reserves MT Investment Rationale Proved Reserves 52,546 Indicated Reserves 10,298 World’s Largest Coal Reserve Holder and Coal Producer Inferred Reserves 1,942 The company is the largest coal reserve holder in the world with its Total 64,786 extractable reserve base of 21,754 MT. The company is the largest coal producing company in the world with raw coal production of 431.26 MT Extractable Reserves 21,754 during the FY’10. The reserves of the company are well diversified among various locations with the largest mine accounting for 8% of the production Coal Production in India during FY’10. 1.1% 6.4% 1.5% The current extractable reserve is the 50x the raw coal production during the 9.0% CIL FY’10 translating into a 50 years mine life ratio. SCCL TISCO India is the world's third largest producer and consumer of coal. The 82.0% MEGH company accounts for around 82% of coal production in India. Others Production Capacity Ramp-up The company has plans to increase raw coal production capacity from current of 461.9 MTPA to 486.5 million tons by FY’12 through a mix of expanding existing mine capacities and the development of new mines. At Production Capacity (MTPA) present, the company has received relevant investment approval for 45 490 486.5 expansion and new projects, which are in various stages of mine planning 480 and development. 470 461.86 Apart from this, the company has plans to add 20 coal beneficiation facilities 460 with an aggregate additional capacity of 111.10 MTPA taking the total coal 450 beneficiation facilities to 37 with beneficiated capacity to 150.5 MTPA. 440 Measures to Improve Profitability Current Proposed Increasing beneficiated capacities: Given that the cost of production of beneficiated coal is not significantly higher than the cost of production of non- Beneficiated Capacity (MTPA) beneficiated coal. Further, beneficiated coal commands significantly higher 200.0 market prices than non-beneficiated coal. The company intends to increase 150.5 beneficiated coal capacity, when become operational will add to margins. 150.0 100.0 Increasing coal sale through e-auction: During the FY’10, the company sold 89% of its total dispatch under the Fuel Supply Agreement (FSA) and 50.0 39.4 balance under e-auction scheme. The company intends to increase contribution of coal sold through e-auction scheme. Since, the price of raw 0.0 coal sold under the e-auction scheme is significantly higher than the price Current Proposed under FSA (Fuel Supply Agreement), the move is expected to improve topline as well as profitability. E-auction of Coal Production Increasing sales of high grade non-coking coal: The company intends to 14.0% 12.9% 11.6% increase the sale of higher quality non-coking coal (Grade A, B and C), which 12.0% 10.0% is generally priced at a discount to the prevailing landed cost of comparative 8.1% quality imported coal, and is significantly higher than the price of non-coking 8.0% 6.0% coal of the same grades sold under FSAs. With the increased revenue 4.0% contribution from high grade non-coking coal, profitability is likely to improve. 2.0% 0.0% To Capitalise upon Increasing Power Generation Capacity in India FY'08 FY'09 FY'10 At present, the total installed power generation capacity in India is 162 GW out of which the total installed thermal power generation capacity is 104 GW. Further, coal based power plants accounts for 82.4% (86 GW) of the total Coal Based Power Generation thermal power generation capacity. 150 Capacity (GW) 128 The country is expected to add 66 GW of power generation capacity during the 5 year period of FY’10 – FY’14, of which coal based capacity additions is 100 86 expected to be approximately 52 GW. This will to take the total installed capacity of coal based power plants to approximately 128 GW. 50 This translates into a huge opportunity for the company given the fact that the 0 80% of its production dispatched to the power sector during FY’10. Current Proposed RR, All rights reserved Page 2 of 9
- 3. Coal India Ltd. – IPO Analysis Financial Analysis Net revenue (Rs Cr) 50,000 47,351.4 40,944.4 Net Revenues 40,000 34,852.5 The company Net revenues increased by CAGR of 10.8% from Rs. 34,852.5 30,000 Cr in FY’08 to Rs 47,351.4 Cr in FY’10 mainly on account of increase in sales volume of raw coal as well as increased average realizations of raw coal. The 20,000 coal realizations have been steadily increased as shown in the below chart. 10,000 0 2500 Raw E-auction Benficiated FY'08 FY'09 FY'10 2000 2267.5 2134.2 Raw Coal Production (MT) 1890.3 440 1500 1582.8 431.3 1480.8 420 1346.7 1000 400.75 925.7 1045.3 400 841.1 500 380 374.57 FY '08 FY '09 FY '10 360 340 FY'08 FY'09 FY'10 EBITDA EBITDA of the company increased by CAGR of 19.5% from Rs. 5,995.0 Cr in FY’08 to Rs 10,288.0 Cr in FY’10. The increase in EBITDA is mainly EBITDA (Rs Cr) attributable to decline in employee cost and higher sales realizations. 12,000 10,228.0 10,000 Employees cost forms the significant portion of the total cost of the company. 8,000 The company has been able to significantly reduce the manpower. 5,995.0 6,000 4,000 2,410.7 25% 21.6% 2,000 20% 0 17.2% 20.3% FY'08 FY'09 FY'10 15% 15.0% 10% 5.9% PAT Margins No. of Employees 5% EBITDA Margins 430000 426,007 5.1% 420000 0% 412,350 410000 FY '08 FY '09 FY '10 400000 397,138 390000 However, employee cost was abnormally high during the FY’09 resulting into the low EBITDA and EBITDA margins. 380000 FY'08 FY'09 FY'10 PAT PAT of the company increased by CAGR of 22.4% from Rs. 5,243.7 Cr in FY’08 to Rs 9,622.4 Cr in FY’10. PAT was significantly down during the PAT (Rs Cr) 12,000 FY’09 on the back lower profitability at EBITDA level. 10,000 9,622.43 Unleveraged Balance Sheet 8,000 As of March 31, 2010, the company has cash balances of Rs.39,077.8 Cr, 6,000 5,243.70 while total debt stood at Rs.2,086.9 Cr. 4,000 2,078.64 2,000 0 FY'08 FY'09 FY'10 RR, All rights reserved Page 3 of 9
- 4. Coal India Ltd. – IPO Analysis Business Analysis Subsidiaries Status The company was established in 1973 and is wholly owned by the GoI. Bharat Coking Coal Ltd - The coal production operations of the company are primarily carried out Central Coalfields Ltd Miniratna through seven wholly-owned Subsidiaries in India. In addition, another wholly Eastern Coalfields Ltd - owned subsidiary, CMPDIL, carries out exploration activities for all the Mahanadi Coalfields Ltd Miniratna subsidiaries and provides technical and consultancy services for company’s operations as well as to third-party clients for coal exploration, mining, Northern Coalfields Ltd Miniratna processing and related activities. The company also has a wholly-owned South Eastern Coalfields subsidiary in Mozambique, Coal India Africana Limitada ("CIAL"), to pursue Miniratna Ltd coal mining opportunities in Mozambique and have acquired prospecting Central Mine Planning and licenses for two coal blocks in Mozambique. Miniratna Development Institute Ltd Western Coalfields Ltd Miniratna The company has been conferred the Navratna status by the GoI, providing certain operational and financial autonomy. In addition, six of the wholly owned Subsidiaries of the company, including CMPDIL, have also been Type Mines accorded the Mini Ratna status by the GoI. Open Cast 163 Underground 273 The company is the largest coal producing company in the world based on Mixed 35 raw coal production of 431.26 MT during FY’10. The company is also the largest coal reserve holder in the world. Total 471 The company has 471 mines in 21 major coalfields across 8 states in India, Raw Coal Production (MT) FY'10 including 163 open cast mines, 273 underground mines and 35 mixed mines (which include both open cast and underground mines). Coking Coal 8.4% Non Coking Coal 91.6% The company produces non-coking coal and coking coal of various grades for diverse applications. Non-coking coal represents a substantial majority of the raw coal production. The majority of the coal production is come from Mine-wise Production (MT) FY'10 open cast mines. Open Cast 90.0% Underground 10.0% Some of the raw coal produced by the company is used for the production of beneficiated coal. At present, the company has 17 coal beneficiation facilities with an aggregate capacity of 39.40 MTPA. Sector-wise Production 2.1% Dispatch The company sells substantially all of the raw coal production in the Indian 1.6% 11.2% market to a diversified set of customers including large thermal power 5.2% Power generation companies, steel producers, cement producers and other Steel industrial companies in the public and private sector. Majority of the coal Cement production is used in the thermal power sector in India. NTPC, a public sector Others power generation company and utility, is the top customer of the company. 79.9% SMEs Employees Base Executives 15,092 Supervisors 38,475 Workmen 343,571 Total 397,138 RR, All rights reserved Page 4 of 9
- 5. Coal India Ltd. – IPO Analysis Peer Analysis We have compared the company with following two different types of peer group: International Coal Producers Top 5 Indian PSUs International Peers Top 5 Indian PSUs Peers Coal India Rio Tinto Vale Shenhua ONGC BHEL NTPC SAIL GAIL Sale (Rs Cr) 44,615.3 188,212.5 107,725.5 81,339.7 101,760.0 33,173.0 48,256.0 40,600.0 27,035.0 EBITDA (Rs Cr) 14,741.5 33,777.0 41,242.5 31,585.9 44,439.0 5,588.0 13,075.0 9,234.0 5,453.0 EBITDA Margins (%) 33% 18% 38% 39% 44% 17% 27% 23% 20% PAT (Rs Cr) 9,622.5 24,007.5 24,070.5 24,262.7 19,403.0 4,326.0 8,837.0 6,790.0 3,327.0 PAT Margins (%) 22% 13% 22% 30% 19% 13% 18% 17% 12% CMP (Rs) 245.0 2692.4 1386.0 280.5 1394.0 2619.0 218.0 225.0 489.0 Equity Cap (Rs Cr) 6,316.3 23,265.0 109,125.0 13,336.2 2,139.0 489.5 8,245.0 4,130.0 1,268.0 Networth (Rs Cr) 25,843.7 361,854.0 268,947.0 272,735.3 101,407.0 15,896.0 62,628.0 33,739.0 17,810.0 Face Value (Rs) 10.0 112.5 225.0 6.7 10.0 10.0 10.0 10.0 10.0 Shares outstand (Cr) 631.6 209.4 485.0 1,989.0 213.9 49.0 824.5 413.0 126.8 EPS (Rs) 15.6 114.6 49.6 12.2 90.7 88.4 10.7 16.4 26.2 PE (x) 15.7 23.5 27.9 23.0 15.4 29.6 20.3 13.7 18.6 Note: Financial numbers of international player are converted into Indian rupee assuming USD rate of 45. CMP of Coal India is taken at higher side of the price band. International coal producers are trading at an average PE of 24.8x of annual earnings; Indian PSUs are trading at an average PE of 19.5x of annual earnings. Though, the price band for the IPO is not yet finalized, we believe that the company should trade near to its peers valuations. At the higher side of the price band i.e. Rs 245; the issue is available 15.7x its FY’10 EPS, indicating a discount of 19.5% and 36.7% to other Indian PSUs and international coal producers respectively. Risk & Concerns Operations of the company are subject to various risks inherent to mining activities and the company does not maintain insurance coverage in accordance with applicable industry standards. These risks and hazards could result in personal injury, grievous hurt or even death of personnel. The company requires various approvals, licenses and permits and must comply with various statutory and regulatory requirements in connection with its business and operations, and any failure to comply with such requirements in a timely manner may adversely affect its operations. Coal mining operations are subject to various operating risks, which could materially increased operating expenses and decreased production levels and could materially and adversely affect profitability. The company faces various risks related to its expansion programs; its capital investment projects may exceed original budgets, may not generate the expected benefits or may not be completed. The recent proposal of the Govt. of India to demarcate certain coal-bearing forest areas in India into various categories, which is proposed to include a category in which mining activities are prohibited, may adversely affect company’s business prospects, results of operations and financial condition. RR, All rights reserved Page 5 of 9
- 6. Coal India Ltd. – IPO Analysis Income Statement Income Statement (Rs Cr) FY '08 FY '09 FY '10 Fiscal Year Ending 31-Mar-08 31-Mar-09 31-Mar-10 Net Revenue 34852.5 40944.4 47351.4 Net Revenue Growth NA 17.5% 15.6% Raw Material 7,923.1 8,448.5 8,638.6 As a % age of Net Revenue 22.7% 20.6% 18.2% Manufacturing Expenses 20,934.4 30,085.2 28,484.8 As a % age of Net Revenue 60.1% 73.5% 60.2% EBITDA 5,995.0 2,410.7 10,228.0 EBITDA Margins 17.2% 5.9% 21.6% Depreciation & Amortization 1,529.9 1,662.9 1,313.8 Total operating Exp. 30,387.5 40,196.6 38,437.3 EBIT 4,465.0 747.8 8,914.2 EBIT Margins 12.8% 1.8% 18.8% Other Income 3,764.1 5,119.6 5,240.8 As a % age of Net Revenue 10.8% 12.5% 11.1% Interest 149.9 156.5 136.5 EBT 8,079.20 5,710.94 14,018.53 EBT Margins 23.2% 13.9% 29.6% Income Tax provision 2,835.5 3,632.3 4,396.1 PAT 5,243.70 2,078.64 9,622.43 PAT Growth NA -60.4% 362.9% PAT Margins 15.0% 5.1% 20.3% No. of shares outstanding (Cr) 631.6 631.6 631.6 EPS (Rs) 8.30 3.29 15.56 RR, All rights reserved Page 6 of 9
- 7. Coal India Ltd. – IPO Analysis Balance Sheet Balance Sheet (Rs Cr) FY’08 FY '09 FY '10 As on 31-Mar-08 31-Mar-09 31-Mar-10 Sundry Debtors 1,657.2 1,847.5 2,168.6 Cash & Bank Balance 20,961.5 29,695.0 39,077.8 Loans and Advances & Other Current Assets 10,266.3 11,727.0 8,676.2 Inventories 3,407.4 3,666.9 4,401.8 Total current assets 36,292.3 46,936.3 54,324.4 Current Liabilities & Provisions 30,594.5 39,942.3 41,382.5 Deferred Tax Liability 180.1 - - Total Current Liabilities 30,774.5 39,942.3 41,382.5 Net Current Assets 5,517.8 6,994.0 12,941.90 Miscellaneous Expenditure - 0.0 1.5 Gross Block 31,859.2 33,260.0 34,945.3 Less: Depreciation 21,009.5 21,802.8 22,491.1 Provision for Impairment 410.6 443.0 422.8 Net Block 10,439.1 11,014.2 12,029.8 Capital Work in Progress 1,539.2 1,822.3 2,090.9 Investments 1,717.9 1,505.2 1,282.1 Surveyed Off Assets 29.1 97.2 119.8 Total Fixed assets 13,725.4 14,438.8 15,522.6 Total Assets 19,243.1 21,432.9 28,466.0 Secured Loans 242.4 454.9 977.2 Unsecured Loans 1,619.9 1,968.0 1,619.9 Total Debt 1,862.34 2,422.90 2,597.14 Minority Interest - 1.9 23.6 Equity Share Capital 6,316.4 6,316.4 6,316.4 Reserve & Surplus 10,884.3 12,691.8 19,528.9 Deferred Tax Liability 180.1 - - Total Shareholder funds 17,380.77 19,008.16 25,845.27 Total Liabilities and Shareholder funds 19,243.1 21,433.0 28,466.0 RR, All rights reserved Page 7 of 9
- 8. Coal India Ltd. – IPO Analysis For Further Details/Clarifications please contact RR Information & Investment Research Pvt. Ltd. 47, MM Road Jhandewalan New Delhi-110055 (INDIA) Tel: 011-23636362/63 research@rrfcl.com www.rrfinance.com www.rrfcl.com RR Research Products and Services Online Equity Calls during Market Hours (9:00 AM to 3:30 PM) Online Commodity Calls during Market Hours (10:00 AM to 11:30 PM) Daily Morning Pack Equity Fundamental - Daily Equity Technical Analysis - Daily Derivative – Daily Debt - Daily Commodity - Daily Currency – Daily Daily Market Review Weekly Pack Equity Fundamental - Weekly Equity Technical Analysis - Weekly Derivative – Weekly Debt - Weekly Commodity - Weekly Currency – Weekly Mutual Fund Watch Fundamental Research Economic Analysis Industry Analysis Company Research & Valuations Result Updates News Updates IPO Analysis Mutual Fund Analysis Fixed Deposit Analysis Money Market Instruments Analysis Investment Monitor – The complete monthly magazine design for Indian investors Share Views with Zee Business. And many more… RR Research can also be viewed and downloaded from following websites: www.moneycontrol.com www.valuenotes.com www.reportjunction.com www.capitalmarket.com www.myiris.com RR, All rights reserved Page 8 of 9
- 9. Coal India Ltd. – IPO Analysis Disclaimer Kindly read the Risk Disclosure Documents carefully before investing in Equity Shares, Derivatives or other instruments traded on the Stock Exchanges. RR would include RR Financial Consultants Ltd. and its subsidiaries, group companies, employees including makers of this report and affiliates. The information contained herein is strictly confidential and meant solely for the selected recipient and may not be altered in any way, transmitted to, copied or distributed, in part or in whole, to any other person or to the media or reproduced in any form, without prior written consent of RR. The information contained herein is obtained from public sources and sources believed to be reliable, but independent verification has not been made nor is its accuracy or completeness guaranteed. RR or their employees including makers of this report may have or may not have an outstanding buy or sell position or holding or interest in the products mentioned herein. The contents and the information herein is solely for informational purpose and may not be used or considered as an offer document or solicitation of offer to buy or sell or subscribe for securities or other financial and insurance products and instruments. Nothing in this report constitutes investment, legal, accounting and/or tax advice or a representation that any investment or strategy is suitable or appropriate to recipients specific circumstances. The securities and products discussed and opinions expressed in this report may not be suitable for all investors, who must make their own investment decisions, based on their own investment objectives, financial positions and needs. Please note that fixed deposits, bonds, debentures are loans/lending instruments and the investor must satisfy himself/herself on the financial health of the company/bank/institution before making any investment. RR and/or its affiliates take no guarantee of soundness of any company or scheme. RR has/will make available all required information to the prospective investor if asked for in respect of any scheme/fixed deposit/bond/loan/debenture. RR is only acting as a broker/distributor and is not representing any company in any manner except to distribute its schemes. Mutual Fund Investments are subject to market risks, read the offer document carefully before investing. Any recipient herein may not take the content in substitution for the exercise of independent judgment. The recipient should independently evaluate the investment risks of any scheme of a mutual fund. RR, employees including makers of this report and its affiliates accept no liability for any loss or damage of any kind arising out of the use of any information contained herein. Past performance is not necessarily a guide to future performance. Actual results may differ materially from those set forth in projections. RR may have issued other reports that are inconsistent with and reach different conclusion from the information presented in this report. The information herein is not directed or intended for distribution to, or use by, any person or entity who is a citizen or resident of or located in any locality, state, country or other jurisdiction, where such distribution, publication, availability or use would be contrary to law, regulation or which would subject RR and its affiliates to any registration or licensing requirement within such jurisdiction. The securities and products described herein may or may not be eligible for sale in all jurisdictions or to certain category of investors. Persons in whose possession this document may come are required to inform them of and to observe such restriction(s). The display, description or references to any products, services, publications or links herein shall not constitute an endorsement by RR. Insurance is a subject matter of solicitation. Kindly also note all the risk disclosure documents carefully before investing in Equity Shares, IPO’s, Mutual Fund Schemes, Insurance Schemes, Fixed Deposit schemes, Debt offers, Hybrid Instruments, or other instruments traded on Stock Exchanges or otherwise. Prospective investors can get all details and information from the sites of SEBI, IRDA, AMFI or respective Mutual Fund Companies, Insurance Companies, Rating Agencies, Stock Exchanges and individual corporate websites. Prospective investors are advised to fully satisfy themselves before making any investment decision. NSE - INB 231219636, INF 231219636 BSE - INB 011219632 Red Herring prospectus can be downloaded from the following link: www.sebi.gov.in/dp/coaldrhp.pdf RR, All rights reserved Page 9 of 9