SlideShare uma empresa Scribd logo
1 de 4
Sawan Masani 11Y

                                           Mapwork Revision Guide

Specification
Basic Skills
- Labelling and annotation of diagrams, maps, graphs, sketches etc.
- Drawing sketches from photographs and in the field.
- Literacy: most communication is through the written word raising the importance of good literacy skills.
- Photographs: candidates should be able to use and interpret aerial /oblique and satellite photographs of
rural and / or urban landscapes.

Cartographic Skills
- Atlas maps: recognising and describing distributions and patterns of both human and physical features.
- Sketch maps: draw, label, understand and interpret sketch maps.
- Construct line, bar, scattergraphs and pie diagrams.
- Complete a variety of graphs and maps including choropleth, isoline and proportional symbols.
- Interpret a variety of graphs including those located on maps and topological diagrams.

Ordnance survey maps
- 1:25 000 or 1:50 000 scale, recognise symbols, four and six figure grid references, straight line and winding
distances; direction, draw and annotate cross-sections, height and degree of slope, simple contour patterns,
patterns of vegetation and land use; patterns of communications; location, shape and pattern of settlement;
different land use zones of settlements; infer human activity from map evidence; using maps in association
with photographs.


Basic Skills in exam


- Use six-figure grid references where appropriate.
- Be familiar with place symbols on the Ordnance Survey map.
- Use settlement knowledge e.g. the urban models for cities in MEDCs to describe and explain why certain
features are in that area. For example, a railway was located in the CBD for the ease of transport of people,
and commercial goods.
- Use compass points to describe directions on the O.S. map, e.g. to the north of the map.
- Describe relief using the height and shape of the land in question. Use contour lines to identify physical
features e.g. a spur. When the contour lines are closer together, this means there is a steep gradient. For
example, the image on the left, number 4 matches up with C. This has a very big gradient at first, but then
gradually gets less steep with increased distance between each contour line.
- When describing a place, state the highest and lowest point, and then state the range.
- Use scale correctly, 1:25000 for higher detail maps, and 1:50000 for bigger scale maps. 1 cm on the map
represents 50,000 cm on the ground (= 500 metres or 0.5 kilometres).
- Bring necessary equipment, e.g. string for measuring non-linear distances.
- Read the command words e.g. when the question says "explain", use complex sentence structure e.g. "This
is... because..."

- Drainage of an area - describe the surface water e.g. a river and the direction the water is flowing. Trellis -
drainage at right angles. Radial - drainage in a circle.


An image to show the different types of drainage systems formed by streams, rivers, and lakes.


Mock Exam Questions


Describe the pattern of settlement shown on Figure 1, the Ordnance Survey Map (6 Marks).
The key words in the question are underlined and should be focussed on in your answer.
        -      Don’t explain why some features are located there; only describe what is there on the map.
        -      Use Grid References to state a place on the map.
        -      Describe where settlement isn’t and where it isn’t.
        -      Mention the largest settlement, in this case Ross on Wye to the south-east of the extract, then
        state the location of other smaller settlements.
        -      State if settlements are above the flood plain.
        -      See if there any limiting factors to why there is no settlement in a certain area.

Compare the land uses in grid squares 5624 and 6127. (4 Marks)

        -      Land uses could mean warehouses (industrial land use), residential land use, farming land use,
        forest land use for fuel.
        -      Make one comparison in 5624, and then make another comparison in 6127.

        Model answer – In grid square, there are some signs of industry as can be seen by the campsite,
        caravan site and public houses. There are very little signs of settlement because grid square 5624 is
        located on a spur so this makes construction of houses for settlement not viable. Whereas, in grid
        square 6127, there is a farm called ‘Park Farm’ (Grid Reference 618274). There is an area of
        vegetation like coniferous trees, non-coniferous trees and shrubs which may be cut down for fuel. The
        farm might keep farms for arable or pastoral farming to provide for their local area.


Add detailed labels in Figure 2 to explain the location of Ross-on-Wye. An example has been done for you. (4
marks)

        -      Make sure you draw a line exactly to where you want to explain.
        -      Explain why something is there, do not just describe e.g. there is a main road.
Model answer –
(Pointing to the shaded area of Ross-on Wye) - Above the flood plain for reduced risk of flooding
(Pointing to grid reference 6022 – Chase Woods) – To provide wood for fuel or building equipment so this
would have given ease to the first settlers of Ross of Wye.
(Pointing at the river) – A river provides an essential water supply for the settlers of Ross on Wye, drawing
potential early settlers in. This is known as a wet-point site – water supply in a dry area.
(Pointing to the main road) – Main roads provide greater accessibility to transport goods and food to settlers in
Ross on Wye.

Describe the relief (height and shape of the land) shown on the cross-section in Figure 3. (4 Marks)

        -      State the starting point grid reference which is located at the start of the x-axis of the cross
        section, and the ending point grid reference which is located at the end of the x-axis of the cross
        section.
        -      State the main features on the cross-section.

Model answer – Firstly from Dadnor Court (Grid Reference - 566262) there is a relatively long piece of
extremely gently inclining land (30 metres), this turn goes to a very sleep downward until River Wye is
reached. After, there is a period of gently inclining land until the footpath is reached, there is a continual
increase of height above sea level, until point H (76 metres). This is an escarpment where the triangulation
point is located, and then at grid reference 601624 – Brampton Abbots is reached at a height of 76 metres.


How to draw a sketch map
        -       Draw the main lines of communication e.g. bridges, main roads, railways, stations
        -       Draw the extent of the built up area
        -       Draw the north point
        -       Draw a scale
        -       Add in the grid reference at the bottom
        -       Add a key showing the main forms of communication
        -       Draw a box the same size as the map area you are using
        -       Label main features on the sketch map
        -
There is an example of a sketch map on page 125, Figure 6.
To the left is in image taken from Google Books.
Mapwork Revision Guide final

Mais conteúdo relacionado

Destaque

Unit 222 understanding the fundamentals of coaching sport
Unit 222 understanding the fundamentals of coaching sportUnit 222 understanding the fundamentals of coaching sport
Unit 222 understanding the fundamentals of coaching sportProdecEducation
 
Introduction Earthquakes And Volcanoes
Introduction Earthquakes And VolcanoesIntroduction Earthquakes And Volcanoes
Introduction Earthquakes And VolcanoesKeith Phipps
 
Earthquakes A2 Hazards
Earthquakes A2 HazardsEarthquakes A2 Hazards
Earthquakes A2 HazardsKeith Phipps
 
Mapwork Basic Skills.ppt
Mapwork Basic Skills.pptMapwork Basic Skills.ppt
Mapwork Basic Skills.pptmarcguybrown
 
RSA Style Animation
RSA Style AnimationRSA Style Animation
RSA Style AnimationDavid Rogers
 

Destaque (6)

Unit 222 understanding the fundamentals of coaching sport
Unit 222 understanding the fundamentals of coaching sportUnit 222 understanding the fundamentals of coaching sport
Unit 222 understanding the fundamentals of coaching sport
 
Introduction Earthquakes And Volcanoes
Introduction Earthquakes And VolcanoesIntroduction Earthquakes And Volcanoes
Introduction Earthquakes And Volcanoes
 
Earthquakes A2 Hazards
Earthquakes A2 HazardsEarthquakes A2 Hazards
Earthquakes A2 Hazards
 
Mapwork Basic Skills.ppt
Mapwork Basic Skills.pptMapwork Basic Skills.ppt
Mapwork Basic Skills.ppt
 
Rivers Revision
Rivers RevisionRivers Revision
Rivers Revision
 
RSA Style Animation
RSA Style AnimationRSA Style Animation
RSA Style Animation
 

Semelhante a Mapwork Revision Guide final

Year 11 Revision Of Skills
Year 11 Revision Of SkillsYear 11 Revision Of Skills
Year 11 Revision Of Skillsmsrichards
 
Mapskills Revision
Mapskills RevisionMapskills Revision
Mapskills RevisionEcumene
 
Mapskillsrevision 090409091745-phpapp01 2
Mapskillsrevision 090409091745-phpapp01 2Mapskillsrevision 090409091745-phpapp01 2
Mapskillsrevision 090409091745-phpapp01 2MOSIMANE MOTSAPI
 
Map Skills Revision
Map Skills RevisionMap Skills Revision
Map Skills Revisionwhiskeyhj
 
Urbantips
UrbantipsUrbantips
Urbantipslmc017
 
Ordnance Survey Maps
Ordnance Survey MapsOrdnance Survey Maps
Ordnance Survey MapsNoel Hogan
 
S4 Prelim Revision
S4 Prelim RevisionS4 Prelim Revision
S4 Prelim Revisionneilgood
 
map-reading (1).pdf
map-reading (1).pdfmap-reading (1).pdf
map-reading (1).pdfQanitaTariq
 
Continuing Our Look At Primary And Secondary Data
Continuing Our Look At Primary And Secondary DataContinuing Our Look At Primary And Secondary Data
Continuing Our Look At Primary And Secondary Dataguest9fa52
 
Surviving question 3 on paper 2
Surviving question 3 on paper 2Surviving question 3 on paper 2
Surviving question 3 on paper 2LindyM
 
GI - Map skills and hypothesis
GI - Map skills and hypothesisGI - Map skills and hypothesis
GI - Map skills and hypothesisMissST
 
FYP II- map n cross section.pptx
FYP II- map n cross section.pptxFYP II- map n cross section.pptx
FYP II- map n cross section.pptxgeocoach2020
 
Geographic Information System(GIS).pptx
Geographic  Information System(GIS).pptxGeographic  Information System(GIS).pptx
Geographic Information System(GIS).pptxEllenGracePorras
 

Semelhante a Mapwork Revision Guide final (20)

Year 11 Revision Of Skills
Year 11 Revision Of SkillsYear 11 Revision Of Skills
Year 11 Revision Of Skills
 
Mapskills Revision
Mapskills RevisionMapskills Revision
Mapskills Revision
 
Mapskillsrevision 090409091745-phpapp01 2
Mapskillsrevision 090409091745-phpapp01 2Mapskillsrevision 090409091745-phpapp01 2
Mapskillsrevision 090409091745-phpapp01 2
 
Map Skills Revision
Map Skills RevisionMap Skills Revision
Map Skills Revision
 
Skillz
SkillzSkillz
Skillz
 
Urbantips
UrbantipsUrbantips
Urbantips
 
Ordnance Survey Maps
Ordnance Survey MapsOrdnance Survey Maps
Ordnance Survey Maps
 
Os maps pack
Os maps packOs maps pack
Os maps pack
 
S4 Prelim Revision
S4 Prelim RevisionS4 Prelim Revision
S4 Prelim Revision
 
map-reading (1).pdf
map-reading (1).pdfmap-reading (1).pdf
map-reading (1).pdf
 
Map skills
Map skillsMap skills
Map skills
 
Map skills
Map skillsMap skills
Map skills
 
Mapwork
MapworkMapwork
Mapwork
 
5easytrackplans.pdf
5easytrackplans.pdf5easytrackplans.pdf
5easytrackplans.pdf
 
Continuing Our Look At Primary And Secondary Data
Continuing Our Look At Primary And Secondary DataContinuing Our Look At Primary And Secondary Data
Continuing Our Look At Primary And Secondary Data
 
Surviving question 3 on paper 2
Surviving question 3 on paper 2Surviving question 3 on paper 2
Surviving question 3 on paper 2
 
GI - Map skills and hypothesis
GI - Map skills and hypothesisGI - Map skills and hypothesis
GI - Map skills and hypothesis
 
FYP II- map n cross section.pptx
FYP II- map n cross section.pptxFYP II- map n cross section.pptx
FYP II- map n cross section.pptx
 
Geographic Information System(GIS).pptx
Geographic  Information System(GIS).pptxGeographic  Information System(GIS).pptx
Geographic Information System(GIS).pptx
 
Map Skills
Map SkillsMap Skills
Map Skills
 

Mais de Keith Phipps

Keeping children safe_in_education_part_1_only
Keeping children safe_in_education_part_1_onlyKeeping children safe_in_education_part_1_only
Keeping children safe_in_education_part_1_onlyKeith Phipps
 
Transition by Emma Lamb
Transition by Emma LambTransition by Emma Lamb
Transition by Emma LambKeith Phipps
 
Widening Access by Giles Hill
Widening Access by Giles HillWidening Access by Giles Hill
Widening Access by Giles HillKeith Phipps
 
Maths primary cpd andrew rogers
Maths primary cpd andrew rogersMaths primary cpd andrew rogers
Maths primary cpd andrew rogersKeith Phipps
 
Reading 4 – writing links and encouraging wider reading
Reading 4 – writing links and encouraging wider readingReading 4 – writing links and encouraging wider reading
Reading 4 – writing links and encouraging wider readingKeith Phipps
 
Reading 3 – writing links and encouraging wider reading
Reading 3 – writing links and encouraging wider readingReading 3 – writing links and encouraging wider reading
Reading 3 – writing links and encouraging wider readingKeith Phipps
 
Reading 2 – writing links and encouraging wider reading
Reading 2 – writing links and encouraging wider readingReading 2 – writing links and encouraging wider reading
Reading 2 – writing links and encouraging wider readingKeith Phipps
 
Reading 1 – writing links and encouraging wider reading
Reading 1 – writing links and encouraging wider readingReading 1 – writing links and encouraging wider reading
Reading 1 – writing links and encouraging wider readingKeith Phipps
 
Parent presentation
Parent presentationParent presentation
Parent presentationKeith Phipps
 
C:\Fakepath\Lower Sixth Information Evening 2010
C:\Fakepath\Lower Sixth Information Evening 2010C:\Fakepath\Lower Sixth Information Evening 2010
C:\Fakepath\Lower Sixth Information Evening 2010Keith Phipps
 
C:\Fakepath\Open Day 2010
C:\Fakepath\Open Day 2010C:\Fakepath\Open Day 2010
C:\Fakepath\Open Day 2010Keith Phipps
 

Mais de Keith Phipps (20)

Keeping children safe_in_education_part_1_only
Keeping children safe_in_education_part_1_onlyKeeping children safe_in_education_part_1_only
Keeping children safe_in_education_part_1_only
 
Transition by Emma Lamb
Transition by Emma LambTransition by Emma Lamb
Transition by Emma Lamb
 
Widening Access by Giles Hill
Widening Access by Giles HillWidening Access by Giles Hill
Widening Access by Giles Hill
 
Maths primary cpd andrew rogers
Maths primary cpd andrew rogersMaths primary cpd andrew rogers
Maths primary cpd andrew rogers
 
Reading 4 – writing links and encouraging wider reading
Reading 4 – writing links and encouraging wider readingReading 4 – writing links and encouraging wider reading
Reading 4 – writing links and encouraging wider reading
 
Reading 3 – writing links and encouraging wider reading
Reading 3 – writing links and encouraging wider readingReading 3 – writing links and encouraging wider reading
Reading 3 – writing links and encouraging wider reading
 
Reading 2 – writing links and encouraging wider reading
Reading 2 – writing links and encouraging wider readingReading 2 – writing links and encouraging wider reading
Reading 2 – writing links and encouraging wider reading
 
Reading 1 – writing links and encouraging wider reading
Reading 1 – writing links and encouraging wider readingReading 1 – writing links and encouraging wider reading
Reading 1 – writing links and encouraging wider reading
 
Parent presentation
Parent presentationParent presentation
Parent presentation
 
French cpd1
French cpd1French cpd1
French cpd1
 
Web 2.0
Web 2.0 Web 2.0
Web 2.0
 
The Ucas Process
The Ucas ProcessThe Ucas Process
The Ucas Process
 
C:\Fakepath\Lower Sixth Information Evening 2010
C:\Fakepath\Lower Sixth Information Evening 2010C:\Fakepath\Lower Sixth Information Evening 2010
C:\Fakepath\Lower Sixth Information Evening 2010
 
C:\Fakepath\Open Day 2010
C:\Fakepath\Open Day 2010C:\Fakepath\Open Day 2010
C:\Fakepath\Open Day 2010
 
Group Rivers
Group RiversGroup Rivers
Group Rivers
 
Industry
IndustryIndustry
Industry
 
Coasts
CoastsCoasts
Coasts
 
Development
DevelopmentDevelopment
Development
 
Glaciation
GlaciationGlaciation
Glaciation
 
Coasts
CoastsCoasts
Coasts
 

Mapwork Revision Guide final

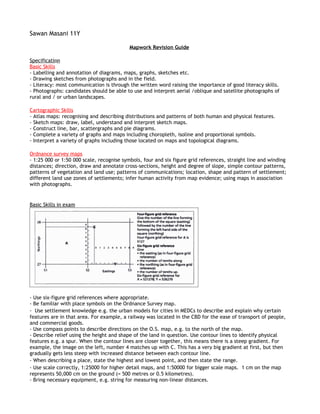
  • 1. Sawan Masani 11Y Mapwork Revision Guide Specification Basic Skills - Labelling and annotation of diagrams, maps, graphs, sketches etc. - Drawing sketches from photographs and in the field. - Literacy: most communication is through the written word raising the importance of good literacy skills. - Photographs: candidates should be able to use and interpret aerial /oblique and satellite photographs of rural and / or urban landscapes. Cartographic Skills - Atlas maps: recognising and describing distributions and patterns of both human and physical features. - Sketch maps: draw, label, understand and interpret sketch maps. - Construct line, bar, scattergraphs and pie diagrams. - Complete a variety of graphs and maps including choropleth, isoline and proportional symbols. - Interpret a variety of graphs including those located on maps and topological diagrams. Ordnance survey maps - 1:25 000 or 1:50 000 scale, recognise symbols, four and six figure grid references, straight line and winding distances; direction, draw and annotate cross-sections, height and degree of slope, simple contour patterns, patterns of vegetation and land use; patterns of communications; location, shape and pattern of settlement; different land use zones of settlements; infer human activity from map evidence; using maps in association with photographs. Basic Skills in exam - Use six-figure grid references where appropriate. - Be familiar with place symbols on the Ordnance Survey map. - Use settlement knowledge e.g. the urban models for cities in MEDCs to describe and explain why certain features are in that area. For example, a railway was located in the CBD for the ease of transport of people, and commercial goods. - Use compass points to describe directions on the O.S. map, e.g. to the north of the map. - Describe relief using the height and shape of the land in question. Use contour lines to identify physical features e.g. a spur. When the contour lines are closer together, this means there is a steep gradient. For example, the image on the left, number 4 matches up with C. This has a very big gradient at first, but then gradually gets less steep with increased distance between each contour line. - When describing a place, state the highest and lowest point, and then state the range. - Use scale correctly, 1:25000 for higher detail maps, and 1:50000 for bigger scale maps. 1 cm on the map represents 50,000 cm on the ground (= 500 metres or 0.5 kilometres). - Bring necessary equipment, e.g. string for measuring non-linear distances.
  • 2. - Read the command words e.g. when the question says "explain", use complex sentence structure e.g. "This is... because..." - Drainage of an area - describe the surface water e.g. a river and the direction the water is flowing. Trellis - drainage at right angles. Radial - drainage in a circle. An image to show the different types of drainage systems formed by streams, rivers, and lakes. Mock Exam Questions Describe the pattern of settlement shown on Figure 1, the Ordnance Survey Map (6 Marks). The key words in the question are underlined and should be focussed on in your answer. - Don’t explain why some features are located there; only describe what is there on the map. - Use Grid References to state a place on the map. - Describe where settlement isn’t and where it isn’t. - Mention the largest settlement, in this case Ross on Wye to the south-east of the extract, then state the location of other smaller settlements. - State if settlements are above the flood plain. - See if there any limiting factors to why there is no settlement in a certain area. Compare the land uses in grid squares 5624 and 6127. (4 Marks) - Land uses could mean warehouses (industrial land use), residential land use, farming land use, forest land use for fuel. - Make one comparison in 5624, and then make another comparison in 6127. Model answer – In grid square, there are some signs of industry as can be seen by the campsite, caravan site and public houses. There are very little signs of settlement because grid square 5624 is located on a spur so this makes construction of houses for settlement not viable. Whereas, in grid square 6127, there is a farm called ‘Park Farm’ (Grid Reference 618274). There is an area of vegetation like coniferous trees, non-coniferous trees and shrubs which may be cut down for fuel. The farm might keep farms for arable or pastoral farming to provide for their local area. Add detailed labels in Figure 2 to explain the location of Ross-on-Wye. An example has been done for you. (4 marks) - Make sure you draw a line exactly to where you want to explain. - Explain why something is there, do not just describe e.g. there is a main road.
  • 3. Model answer – (Pointing to the shaded area of Ross-on Wye) - Above the flood plain for reduced risk of flooding (Pointing to grid reference 6022 – Chase Woods) – To provide wood for fuel or building equipment so this would have given ease to the first settlers of Ross of Wye. (Pointing at the river) – A river provides an essential water supply for the settlers of Ross on Wye, drawing potential early settlers in. This is known as a wet-point site – water supply in a dry area. (Pointing to the main road) – Main roads provide greater accessibility to transport goods and food to settlers in Ross on Wye. Describe the relief (height and shape of the land) shown on the cross-section in Figure 3. (4 Marks) - State the starting point grid reference which is located at the start of the x-axis of the cross section, and the ending point grid reference which is located at the end of the x-axis of the cross section. - State the main features on the cross-section. Model answer – Firstly from Dadnor Court (Grid Reference - 566262) there is a relatively long piece of extremely gently inclining land (30 metres), this turn goes to a very sleep downward until River Wye is reached. After, there is a period of gently inclining land until the footpath is reached, there is a continual increase of height above sea level, until point H (76 metres). This is an escarpment where the triangulation point is located, and then at grid reference 601624 – Brampton Abbots is reached at a height of 76 metres. How to draw a sketch map - Draw the main lines of communication e.g. bridges, main roads, railways, stations - Draw the extent of the built up area - Draw the north point - Draw a scale - Add in the grid reference at the bottom - Add a key showing the main forms of communication - Draw a box the same size as the map area you are using - Label main features on the sketch map - There is an example of a sketch map on page 125, Figure 6. To the left is in image taken from Google Books.