California's high speed rail realities briefly assessing the project's construction cost, debt prospects, and funding
•Transferir como DOCX, PDF•
1 gostou•5,391 visualizações


Recomendados
Recomendados
Mais conteúdo relacionado
Mais procurados
Mais procurados (16)
Destaque
Destaque (18)
Semelhante a California's high speed rail realities briefly assessing the project's construction cost, debt prospects, and funding
Semelhante a California's high speed rail realities briefly assessing the project's construction cost, debt prospects, and funding (20)
Mais de KernTax
Mais de KernTax (20)
California's high speed rail realities briefly assessing the project's construction cost, debt prospects, and funding
- 1. California's High-Speed Rail Realities: Briefly Assessing the Project's Construction Cost, Debt Prospects, and Funding By Chris Knight on Jul 5, 2012 California Common Sense http://www.cacs.org/ca/article/38 Summary
- 2. In 2008, the citizens of California voted to authorize the state government to borrow $9.95 billion in order to build California‟s first high-speed rail system (CA HSR). In this article, we explain how the State – under the auspices of the California High Speed Rail Authority (CHSRA) employing project management firm Parsons Brinckerhoff – has strayed from this original plan, and the consequences this will have for the California state budget. We begin by estimating a revised construction cost figure for CA HSR, taking into account the cost inflation that typically occurs in large transportation infrastructure projects. We explain why the state‟s proposed funding sources to cover this inflated cost may be overoptimistic and propose two different – and more realistic – funding scenarios: one assuming 50% federal financing and one assuming no federal financing. Next, we explain why operating costs may be higher than the CHSRA projects, and we model how this will affect private sector investment. We conclude by using the revised construction cost and operating cost estimates to generate the total impact of CA HSR on California‟s finances. Construction Cost Realities From 2008 through its latest draft business plan released in April 2012, the CHSRA has substantially raised its cost estimate for building the HSR system, while scaling back its plans. In November 2008, California voters passed Proposition 1A, authorizing $9.95 billion in general obligation bonds to partially finance the construction of a dedicated HSR system extending from San Francisco to Anaheim. The other roughly three-quarters of the $42.6 billion construction cost was to be borne nearly entirely by the federal government and private firms.1 In Fall 2011, having overcome the political hurdle of Prop 1A and faced with rapidly inflating construction estimates, CHSRA revised its minimum estimated budget up to $98.1 billion.2 Still, the 2011 business plan maintained that no further state bonds would be issued to cover the increase. Three and a half years later, faced with minimal private sector interest and a tight federal budget for the foreseeable future, the CHSRA abandoned its plan for an HSR-only system. Released in Spring 2012, the rail agency‟s Revised 2012 Business Plan calls for a system that is “blended” with traditional rail lines, forsaking the original goal of a dedicated San Franciscoto Anaheim HSR line, and estimated to cost between $68 and $79 billion.3 The above pattern is nothing new: both the State of California and the CHSRA‟s project manager, Parsons Brinckerhoff, have histories of managing infrastructure projects that run dramatically over budget. For instance, Boston‟s “Big Dig” highway construction project that Parsons Brinckerhoff co-managed saw its budget increase from $2.5 billion in 1985 to $14.6 billion in 2002, a 240% cost overrun after inflation is taken into account.4 Similarly, the Golden State‟s 1996 effort to seismically retrofit major toll bridges in Northern and Southern California was significantly over budget. In 1996, Prop 192 authorized $650 million for the retrofits. By 2005, the projects‟ $8.7 billion total budget made for a 1000% cost overrun, with the State covering $2.8 billion of it.5 Among construction projects generally, these cases are undoubtedly outliers, but an academic study of over 200 transportation megaprojects found an average cost overrun of 45% for rail construction. Applying this 45% inflation factor to the CHSRA‟s April 2012 budget of $68 billion, we arrive at a realistic potential total cost of $99 billion for a truncated HSR project (referred to as „Blended‟), shown alongside the previous estimates in Figure 1 below (for simplicity, we will accept the “low cost” $68 billion figure from hereon).6 Financing Realities The most vexing question facing Californians is where this $99 billion will come from. In every budget it has released over the last four years, the CHSRA has reiterated its expectation that the vast majority will come from federal grants.7 In the past decades, federal funds have indeed been available, but in a much more limited way. From the 1960s through the 1980s, the federal government typically paid between 50% and 80% of construction costs for passenger rail projects. However, the budgets for these passenger rail projects ranged from hundreds of millions to a few billion dollars, not tens of billions like that of CA HSR.8 The federal government also paid about 60% of the Big Dig‟s over-budget construction costs using funds from its primary transportation infrastructure funding mechanism, the Highway Trust Fund (HTF).9 The CHSRA has cited a proposal to divert HTF funding into a Dedicated Passenger Rail Trust Fund to fund CA HSR.10 However, since 2009, the HTF has been unable to fully fund traditional projects, let alone new HSR routes.11
- 3. Future federal HSR funding will have to overcome the twin hurdles of depressed levels of discretionary spending overall, and a political environment that is increasingly hostile to rail projects in particular. The nonpartisan US Congressional Budget Office projects record low discretionary spending over the next decade, largely driven by over $1 trillion in cuts resulting from the 2011 Budget Control Act.12 And although in 2009 and 2010 California was lucky enough to take home $3.3 billion of the $8 billion in rail federal stimulus funding, a hostile Congress sharply reduced the federal HSR budget to $1 billion for the 2011-2012 Fiscal Year.13 As an indication of what is to come, the transportation bill approved by Congress last week zeroed out HSR funding for California for Fiscal Year 2013. Future federal HSR funding is politically uncertain, to say the least. The CHSRA has additional plans for two other sources of financing, but both of these have limitations. The more tentative plan is to use auction revenues from the State‟s AB 32 cap-and-trade mechanism as a “backstop” in case of insufficient federal funding. However, California‟s nonpartisan Legislative Analyst‟s Office has pointed out that these revenues are legally restricted to projects that reduce greenhouse gas emissions prior to 2020, which CA HSR does not. Lawmakers will also have to justify why CA HSR is a better use of auction revenues than other much more cost-effective ways to reduce greenhouse gas emissions.14 But if AB 32 revenues are made available for HSR and diverted from other
- 4. services, then the HSR project forces a tradeoff between it and those other services. The second, more feasible, plan is to rely on private sector investment. However, as we explain below, it appears that the CHSRA is substantially underestimating operating costs, and because of this, the discounted cash flows over the life of the HSR system will be much lower than the $13 billion CHSRA expects. This means that the private sector will be highly unlikely to invest even the already modest currently projected figures. Taking into account these federal budgetary pressures and uncertainties, as well as the fact that the CA HSR has a budget many times the size of traditional passenger rail projects, we estimate that at most, the federal government will cover 50% of the remaining project budget. This scenario – shown in Figure 1 as the “Realistic – 50% Federal Funding” bar – still requires $49 billion from an additional source to finance construction. As the investor of last resort, the State will ultimately have to take up the over-budget construction cost with additional bond issuance, just as it did with the $2.8 billion in extra costs for the seismic retrofit of its toll bridges.15 However, because the federal budget outlook is highly uncertain, it is also useful to model a more cautious financial scenario. The “Realistic – No Additional Federal Funding” bar at the far right in Figure 1 demonstrates the financial burden of construction for the state if no federal dollars can be used to fund CA HSR, a likely scenario if the current political opposition to HSR at the federal level continues. Applying a similar analysis to CA HSR results in $82 billion in additional State bonds issued to cover CA HSR‟s construction bill.16 Revenue and Ridership Realities CHSRA supports its projections of profitability used to attract private investment by examining successful high-speed rail systems in Japan, Germany, Taiwan, France, the United Kingdom, and Spain.17 For the most part, these countries have experienced fairly high levels of ridership, and despite requiring billions in subsidies at the system-wide level, some of the individual lines may be profitable.18 However, as we demonstrate below, the economics of California‟s HSR differ significantly from that of the other systems in these case studies. Figure 2 below shows the cheapest costs of HSR tickets along these international routes when they are bought a month in advance. Most importantly, Figure 2 shows that CHSRA‟s proposed cheapest ticket price for San Francisco to Los Angeles is less than half the average cheapest international ticket on a passenger-mile basis.19 In other words, the CHSRA expects that it will be able to transport someone from San Franciscoto Los Angeles at half the ticket price of someone traveling the equivalent distance in other countries.20
- 5. At $.35/passenger-mile, the average cheapest international rail ticket (shown by the dotted line) is 153% more expensive than the CHSRA‟s cheapest price of $.14/passenger-mile. The very cheapest international case study ticket price – Taiwan (Taipei to Tainan) at $.25/passenger-mile – is still 80% more expensive than the CHSRA‟s proposed price. It is true that given a very high ridership volume, a rail system can have lower ticket prices and still be profitable. But this is not the case with CA HSR. In fact, the CHSRA‟s ridership projections are significantly lower than those of the international case study systems. When the system is fully mature in 2040, the CHSRA estimates that CA HSR will have half of the market penetration levels of French HSR and 23% less market penetration than Spanish HSR. This raises the question of how the CHSRA can charge less than half as much as European HSR, have much less market penetration, and still be profitable.21 We can only conclude that somewhere in the process of its bottom-up modeling of costs, the rail agency has significantly underestimated the operating cost structure of a HSR system. There are even reasons to think that the CHSRA‟s ridership estimates are significantly overstated to begin with. Evidence from US and international rail systems suggests that actual ridership is almost always far below what agencies originally expect.22 In other
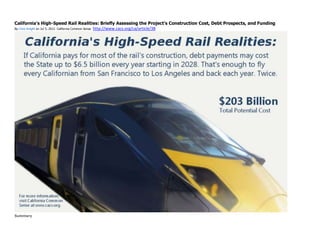
- 6. words, higher operating costs may be compounded by lower-than-expected ridership. Decreased profit margins will significantly reduce expected private investment in CA HSR. If operating costs are 50% higher than estimated,23 discounted cash flows over the life of the system will decrease from the $13 billion that the CHSRA projects to $5.6 billion.24 Because businesses value their investments according to discounted cash flows, CA HSR will be able to attract no more than $5.6 billion in private investment. Furthermore, this decrease in expected profitability raises the possibility that the system may actually need a continuous subsidy and would thus become illegal under Prop 1A. Unlike in other countries, the enabling legislation of California‟s HSR explicitly forbids operating subsidies.25 Financing Realities The state budget is ultimately where unforeseen construction and operating cost realities manifest themselves. With CA HSR‟s projected cost of $99 billion for the Blended Plan, in either of our scenarios, the private sector will finance $5.6 billion, already secured federal stimulus funding will cover $3.3 billion, and remaining Prop 1A bond funds will approximately cover another $8 billion. The real gamble occurs with the unsecured $82 billion. In Figure 3, we model the annual debt service that California citizens will have to pay in the Realistic – 50% Federal Funding (blue line) and Realistic – No Additional Federal Funding (red line) scenarios, contrasted with a dotted line showing CA‟s estimated 2011-2012 Fiscal Year total debt service of $5.3 billion. In the Realistic – 50% Federal Funding scenario, Californians will have to finance $49 billion, incurring a total debt burden of $111 billion. By 2028 the state will have to pay $3.5 billion in additional annual debt service. To put this in perspective, California‟s estimated 2011-2012 Fiscal Year budget for the University of California system and student aid for higher education combined was $3.4 billion.26
- 7. Of course, if the state has to finance the entire remaining $82 billion, these costs will be significantly higher. In the Realistic – No Additional Federal Funding scenario shown by the dark red line, by 2028, Californians will have to pay $6.5 billion in additional annual debt service, equal to the state‟s estimated budget for higher education (UC and CSU), and state sponsored childcare for the 2011-2012 Fiscal Year. The Realistic – No Additional Federal Funding scenario results in a total debt burden of $203 billion between 2013 and 2058. The Big Picture The CHSRA appears to be hoping for a new era in transportation, but it may just get a dose of recent history. Cost overruns are the norm for transportation megaprojects, and California has proven that it will step in and cover additional expenditures when they arise. Assuming a 45% construction cost overrun, which is the historical average rate, results in a $99 billion total cost of construction. Furthermore, faced with lower-than-expected operational profits as operating costs rise to match international levels, private sector investment in CA HSR will be much more limited. Given the already secured financing, we model two scenarios in which the $82 billion in unsecured funding is either 1) split evenly between California and the federal government, or 2) is covered by the state entirely. In either scenario, to fund the CA HSR project, California must sell additional bonds beyond those approved by Proposition 1A. This is contrary
- 8. to CHSRA‟s reiteration in every released budget that federal grants will cover the bulk of the construction cost and that no further state funding will be necessary. By 2028, the scenario predicts annual debt payments of up to $6.5 billion on top of existing debt payments, for a total financing cost of as much as $203 billion from 2013 to 2058. This is funding that could go to other local and regional transportation projects that address the same goals. Now it is up to the citizens of California to decide whether HSR is worth these sums, or if there are other – perhaps more cost-effective – ways the Golden State can achieve its environmental and transportation objectives. -------------------------- 1 The $42.6 billion construction cost estimate is drawn from the CHSRA‟s 2009 budget. For the source of cost estimates referenced throughout this brief, see the CHSRA‟s 2008 – 2012 Business Plans, all available at http://www.cahhspeedrail.ca.gov/Business_Plan_reports.aspx. 2 Dollar figures in this article are in Year of Expenditure (YOE) dollars, which are adjusted to account for inflation that occurs up to the year that construction actually takes place, unless otherwise noted. The $98.1 billion estimate was for the low cost option. The high cost was $117.8B. Page 8-2 of CHSRA‟s November 2011 Business Plan, available at http://cahighspeedrail.ca.gov/assets/0/152/302/c7912c84-0180-4ded-b27e-d8e6aab2a9a1.pdf. 3 The low and high cost options are described on page 3-11 of CHSRA‟s Revised 2012 Business Plan available at http://www.cahighspeedrail.ca.gov/assets/0/152/431/1a6251d7- 36ab-4fec-ba8c-00e266dadec7.pdf. 4 See Figure 2.2 “Cost History and Scope Evolution” on page 14 in “Completing the “Big Dig”. 2003. National Academies Press. Available at http://www.nap.edu/catalog.php?record_id=10629. 5 See Figure 7-1 on page 326 in Frick, Karen Trapenberg. 2005. Making and Un-Making of the San Francisco-Oakland Bay Bridge: A Case in Megaproject Planning and Decisionmaking. UC Berkeley DCRP PhD Dissertation.Available at http://www.uctc.net/research/diss130.pdf. 6 Flyvbjerg, Bent, Bruzelius, Nils and Rothengatter, Werner.2003. Megaprojects And Risk, An Anatomy of Ambition. Cambridge University Press. 7 As detailed in its Revised 2012 Business Plan, the CHSRA assumes that they will receive $39 billion in federal grants--beyond the $3.3 billion already secured--over the next 16 years. The CHSRA also predicts a very limited amount of funding from local sources. Since this is such a small part of the budget it is included with the federal portion in Figure 1. 8 On page xii, Pickrell‟s review of passenger rail funding finds that “federal assistance…ranged from 53% to 83% of capital outlay…” in Pickrell, Don H. 1990. Urban Rail Transit Projects: Forecast Versus Actual Ridership and Costs. Report prepared for US Department of Transportation. Available at http://www.debunkingportland.com/docs/Pickrell(no_text).pdf. 9 Financing Approved for Troubled „Big Dig‟. November 30, 2000. National News Brief in New York Times. Available at: http://www.nytimes.com/2000/11/30/us/national-news- briefs-financing-approved-for-troubled-big-dig.html. 10 Potential federal grants sources are detailed in California High-Speed Rail Authority. Chapter 7: Financial Analysis and Funding in Revised 2012 Business Plan. Available at http://www.cahighspeedrail.ca.gov/Business_Plan_reports.aspx. 11 Plungis, Jeff and Keane, Angela Greiling. Highway Deal Leaves U.S. Trust Fund in Bankrupting Cycle.June 29, 2012article in SF Gate. Available at: http://www.sfgate.com/business/bloomberg/article/Highway-Deal-Leaves-U-S-Trust-Fund-in-3673804.php 12 United States Congressional Budget Office. The Budget and Economic Outlook: Fiscal Years 2012 to 2022. January 31, 2012. Available at http://www.cbo.gov/publication/42905. 13 Cooper, Michael. Budget Deal Deeply Cuts High-Speed Rail Program.April 12, 2011 story in the New York Times. Available at http://www.nytimes.com/2011/04/13/us/politics/13rail.html. 14 In fact, it will increase total GHG emissions for many years, even after operation begins in 2023. See Taylor, Mac. The 2012-13 Budget: Funding Requests for High-Speed Rail. April 17, 2012. California Legislative Analyst‟s Office.Available at http://www.lao.ca.gov/analysis/2012/transportation/high-speed-rail-041712.pdf. Additionally, Budget Bill AB 1497 which was signed into law on June 27, 2012 may preclude cap and trade from being used for CA HSR for a period of at least 2 years. Chapter 29.Section 15.11 (e), available at http://leginfo.ca.gov/cgi-bin/postquery?bill_number=ab_1497&sess=CUR&house=B&author=committee_on_budget.
- 9. 15 See Frick cited in note 4. 16 As we detail in the financing section, these interest and principal costs assume that 30 year bonds paying 6% interest are sold in the year of construction. 17 California High-Speed Rail Authority. International Case Studies, April 2012. Available under “Revised Business Plan 2012 Source Documents” at http://www.cahighspeedrail.ca.gov/Business_Plan_reports.aspx. 18 Although some claims may be accurate, CHSRA calculations of profitability are based on limited research. Other studies have shown that nearly all rail systems in the globe benefit from subsidies, which will overstate profits. See Perkins, Steven. The Role of Government in European Railway Investment and Funding. Paper presented at the China Railways Investment & Financing Reform Forum in Beijing, Chinaon 20, September 2005. Available at http://internationaltransportforum.org/IntOrg/ecmt/railways/pdf/SPbeijing05.pdf.Also see: International High-Speed Rail Systems April 27, 2007 Hearing before the US House of Representatives Committee on Transportation and Infrastructure. Available at http://www.gpo.gov/fdsys/pkg/CHRG-110hhrg34799/pdf/CHRG-110hhrg34799.pdf. Prominent proponents of HSR have also claimed limited profitability. See Burnett, Victoria. “Spain‟s High-Speed Rail Offers Guideposts For U.S.” NY Times, May 29, 2009. Available at http://www.nytimes.com/2009/05/30/business/energy-environment/30trains.html. 19 We have chosen to compare the cheapest ticket prices for ease of analysis, the same trend is apparent among average ticket prices. 20 Unless the international HSRsystems are making extremely large profits, which does not appear to be the case. Testimony to the CHSRA by RENFE claims that profit margins are 19%. See RENFE Company Profile and Development of High Speed Rail Services, presented to the CHSRA Board June 2, 2011. Available at: http://www.cahighspeedrail.ca.gov/assets/0/152/232/f8663924-d330-4abf-ba2d-e295d2546db7.pdf. Also, international rail systems are frequently subsidized, see sources in note 10. 21 Compare projected 2040 CA HSRridership of 98% of corridor population to ridership on Paris-Marseilles (ridership is 200% of corridor population) and Madrid-Seville (ridership is 137% of corridor population) HSRroutes. See Exhibit 5-17 in CaliforniaHigh-Speed Rail Authority. Chapter 5: Ridership and Revenue in Revised 2012 Business Plan. Available at http://www.cahighspeedrail.ca.gov/Business_Plan_reports.aspx. 22 The following book found that international rail ridership estimates were overstated by an average of 65%: Flyvbjerg, Bent; Bruzelius, Nils and Rothengatter, Werner. 2003. Megaprojects And Risk, An Anatomy of Ambition. Cambridge University Press. For US examples, see Pickrell cited in note 8 above. 23 The 50% increase results from assuming the Taiwan HSRhas a 15% profit margin on a .25/passenger-mile cost. At least in the first several years of operation, Taiwan HSRhad a negative operating profit, so this seems to be a reasonable assumption. Budget statements available at: http://en.wikipedia.org/wiki/Taiwan_High_Speed_Rail#cite_note- FinRep2010-125. 24 The figures for annual revenues and annual operating costs come from Exhibit 7-7. Net Project Cash Flow through Phase 1 Blended on pages 7 through 11 in Chapter 7: Financial Analysis and Funding in Revised 2012 Business Plan. Available at http://www.cahighspeedrail.ca.gov/Business_Plan_reports.aspx. The revenue maximizing assumption is stated on page 11 of Chapter 5: Ridership and Revenue in the CHSRA‟s Revised 2012 Budget cited above. 25 Section 2704 08(J) in Assembly Bill 3034, which became Prop 1A. See California Legislative Information. AB 3024 page.Available at http://www.leginfo.ca.gov/pub/07- 08/bill/asm/ab_3001-3050/ab_3034_bill_20080826_chaptered.html. 26 See reference table: "Projected General Fund Spending for Major Programs" in Taylor, Mac. The 2012-13 Budget: California's Fiscal Outlook. California Legislative Analyst‟s Office. Available at: http://www.lao.ca.gov/reports/2011/bud/fiscal_outlook/fiscal_outlook_2011.pdf. HSRdebt service assumes annual bond issuance for yearly capital expenditures, 6% interest rate, 30-year payment.