Taking Your Chances: Shot Efficiency in Football
•
0 likes•400 views

The aim of this study was to examine shot efficiency in football. The objectives were determine the effect on shot outcome of: 1.The number of ball touches taken when in possession. 2.The field position from which a shot was taken. 3.The amount of defensive pressure on shooting player.
Recommended

Recommended
More Related Content
Similar to Taking Your Chances: Shot Efficiency in Football
Similar to Taking Your Chances: Shot Efficiency in Football (18)
More from Keane Wheeler
More from Keane Wheeler (10)
Recently uploaded
Recently uploaded (20)
Taking Your Chances: Shot Efficiency in Football
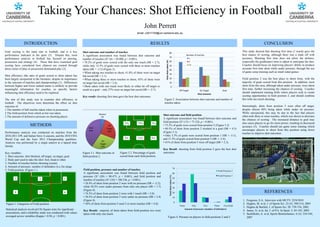
- 1. REFERENCES 1. Ferguson, S.A., Interview with MUTV. 22/8/2010 2. Hughes, M. et al, J. of Sports Sci. 23 (5): 509-514, 2005 3. Hughes & Bartlett, J. of Sports Sci. 20: 739-754, 2002 4. James, N. et al, Int. J. of P.A. In Sport. 2: 85-103, 2002 5. Sachlikidis, A. et al, Sports Biomechanics. 6 (3): 334-344, 2007 CONCLUSION This study showed that shooting first time (1 touch) gave the best chance of scoring, although there was a trade off with accuracy. Shooting first time does not allow the defence, (especially the goalkeeper) time to adjust or anticipate the shot. Coaches should focus on improving players’ ability to produce accurate first time shots while under pressure, through the use of game sense training such as small sided games. Field position 2 was the best place to shoot from, with the majority of goals scored from this position. In addition, most shots from this area, although taken under pressure, were taken first time, further increasing the chances of scoring. Coaches should implement training drills where players seek to create scoring opportunities in field position 2, and should combine this with one touch shooting. Interestingly, shots from position 5 were often off target, despite almost 40% being taken while under no pressure. While unexpected, this may be due to the fact that players often took three or more touches, which was shown to decrease the chances of scoring. The increased distance to goal may also cause players to go for more power, resulting in decreased accuracy (5). Coaches should use game sense training which encourages players to shoot from this position using fewer touches to improve shot outcomes. RESULTS INTRODUCTION Goal scoring is the main aim in football, and is a key performance indicator in the sport (3). Despite this, most performance analysis in football has focused on passing, possession and strategy (4). Those that have examined goal scoring have considered how chances are created through direct styles of play or possession dominated play (2). Shot efficiency (the ratio of goals scored to shots taken) has been largely unreported in the literature, despite its importance to the outcome of matches and championships (1). Differences between higher and lower ranked teams is unlikely to provide meaningful information for coaches, so specific factors influencing shot efficiency need to be explored. The aim of this study was to examine shot efficiency in football. The objectives were determine the effect on shot outcome of: 1.The number of ball touches taken when in possession. 2.The field position from which as hot was taken. 3.The amount of defensive pressure on shooting player . METHODS Performance analysis was conducted on matches from the 2010-2011 EPL and Italian Serie A seasons, and the 2010 FIFA World Cup and the Euro 2012 Championship qualifiers. Analysis was performed by a single analyst in a lapsed time format. Key variables : 1. Shot outcome: shot blocked, off target, on target, goal. 2. Body part used to take the shot: foot, head or other. 3. Number of touches before shooting (count). 4. Amount of pressure: number of defenders in a 2m range. 5. Field position: (Figure 1.) John Perrett Taking Your Chances: Shot Efficiency in Football Shot outcome and number of touches A significant association was found between shot outcome and number of touches (X2 (6) = 38.000, p < 0.001). • 70.2% of goals were scored with the only one touch (SR = 2.7), while only 12.3% of goals were scored with three or more touches taken (SR = -3.2) (Figure 2). • When taking two touches to shoot, 41.8% of shots were on target but saved (SR = 2.1). • When taking three or more touches to shoot, 43% of shots were on target but saved (SR = 2.4). • Shots taken with one touch were likely to either be off target or result in a goal – only 27% were on target but saved (SR = -2.7). Key result: shooting first time gave the best shot outcomes. Shot outcome and field position A significant association was found between shot outcome and field position (X2 (15) = 73.324, p < 0.001). • 73.2% of goals were scored from position 2 (Figure 3.2) • 40.5% of shots from position 2 resulted in a goal (SR = 4.5) (Figure 3.1). • Only 3.3% of goals were scored from position 1 (SR = -3.1), and 11.3% of goals scored from position 5 (SR = -3.4). • 41% of shots from position 5 were off target (SR = 2.3). Key Result: shooting from field position 2 gave the best shot outcomes. email: u3011104@uni.canberra.edu.au Field position, pressure and number of touches A significant association was found between field position and pressure (X2 (20) = 90.473, p < 0.001), and field position and number of touches (X2 (10) = 180.536, p < 0.001). • 24.4% of shots from position 2 were with no pressure (SR = -2.2), while 58.2% were under pressure from only one player (SR = 1.7) (Figure 4). • 74.5% of shots from position 2 were with 1 touch (SR = 5.0). • 38.5% of shots from position 5 were under no pressure (SR = 2.4) (Figure 4). • 36% of shots from position 5 used 3 or more touches (SR = 4.8). Key Result: majority of shots taken from field position two were taken with only one touch. 0 10 20 30 40 50 60 70 None One Two Three Free Kick Total shots taken (%) Amount of pressure (number of defenders) Field Position 2 Field Position 5 Figure 2. Association between shot outcome and number of touches taken. Figure 4. Pressure on players in field positions 2 and 5. Figure 1. Categories of Field position. Statistical analysis involved Chi Square tests for significant associations, and a reliability study was conducted with values averaged across variables (Kappa = 0.94, p < 0.001). Blocked 5% Off Target 26% On Target 29% Goal 40% Figure 3.1. Shot outcome in field position 2. Figure 3.2. Percentage of goals scored from each field position. 3% 73% 7% 3% 11% 3% 0 10 20 30 40 50 60 70 80 Off Target On Target Goal Total shots taken (%) Shot outcome 1 2 3+ Number of touches 1 2 3 4 5 6