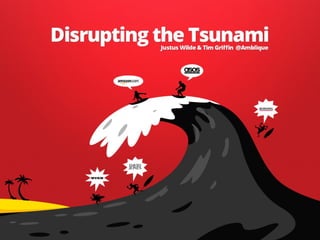
Disrupting The Tsunami - iMedia Presentation by Amblique
•
2 gostaram•494 visualizações

Presentation looks at online retail trends for apparel in Australia 2011/2012. Data is a mix of hitwise, google insights and Amblique aggregated client results.

Recomendados
Mais conteúdo relacionado
Mais procurados
Mais procurados (14)
Semelhante a Disrupting The Tsunami - iMedia Presentation by Amblique
Semelhante a Disrupting The Tsunami - iMedia Presentation by Amblique (20)
Mais de Justus Wilde
Mais de Justus Wilde (10)
Último
Último (20)
Disrupting The Tsunami - iMedia Presentation by Amblique
- 2. Introduction What does the tsunami look like? Source: Hitwise © Amblique 2012
- 3. Frequency - Return Visits Why are pure plays growing so fast? Return visits. Pure plays - avg. 81% Multi-channel - avg. 65% • Catch Of The Day • General Pants • Forever New • BrandsExclusive 93% • Sportsgirl 77% • Ozsale • City Beach • BuyInvite • Cotton On • ASOS • Supre • Amazon • Country Road • SurfStitch • Big W • EziBuy (AU) • Toys R Us • David Jones • Deals Direct 53% • StyleTread 61% • Officeworks • Myer • Kmart • Rebel Sport Visitors are 25% more likely to revisit a pure play* Returning visitors 67% more likely to convert** * Hitwise ** Google Analytics May 2011 – April 2012 © Amblique 2012
- 4. What’s Going To Save Established Retailers? Let’s explore disruptors detail 1. Pure plays 2. Internationals 3. Mobile 4. New digital channels 5. Social Media © Amblique 2012
- 5. Pure Plays – Brand Awareness in Apparel YoY the pie is 51% bigger Top Performers • New Pure plays (+167%) • ASOS (+163%) • Forever New (+57%) Pure plays in red went from 16% to 29% of the pie in 1 year Source: Google Insights Mar-12 vs. Mar-11 New pure plays inc. SurfStitch (SS), TheIconic (TI) & StyleTread (ST) © Amblique 2012
- 6. Pure Plays - ASOS • Traffic up 279% year on year for March • Social drives 19% of traffic • 36% of traffic from search Source: Hitwise Mar-12 vs. Mar-11 © Amblique 2012
- 7. Pure Plays - ASOS • Traffic up 279% year on year for March • Social drives 19% of traffic • 36% of traffic from search Source: Hitwise Mar-12 vs. Mar-11 © Amblique 2012
- 8. Pure Plays – Brand Awareness in Broader Retail YoY the pie is 19% bigger Top Performers • COTD (+37%) • Toys R Us (+36%) • Amazon (+29%) • Kmart (+29%) Amazon grew the most in absolute numbers Source: Google Insights Mar-12 vs. Mar-11 © Amblique 2012
- 9. Established Retailers – David Jones • Traffic up 21% year on year for March • Social drives 6% of traffic • Took 80% more traffic from Myer YoY • 53% of traffic from search Source: Hitwise Mar-12 vs. Mar-11 © Amblique 2012
- 10. Established Retailers – David Jones • Traffic up 21% year on year for March • Social drives 6% of traffic • Took 80% more traffic from Myer YoY • 53% of traffic from search Source: Hitwise Mar-12 vs. Mar-11 © Amblique 2012
- 11. International Retail Top 100 Apparel Sites April 2012 40% Multi- channel 38% 46% Category Growth Contribution © Amblique 2012
- 12. International Retailers Pushing Online © Amblique 2012
- 13. International Retailers Pushing Online © Amblique 2012
- 14. International Retailers Pushing Online Launching May 15th in Australia
- 15. Mobile & Tablets • Mobile & tablets account to up to 22% of traffic Source: Google Analytics for 9 fashion clients © Amblique 2012
- 16. Mobile & Tablets • Tablets up to 283% more $/visit Source: Google Analytics for 9 fashion clients © Amblique 2012
- 17. Mobile Traffic SMS 20% of all 98% open visits+ rate** Email Store 27% of email locators opened on 47% more mobile* from mobiles+ * Mobile Email Opens Report, Knotice April 2012 based on US data ** The Benefits of SMS Marketing, Power Retail April 2012 + Google Analytics for various clients, March 2012 © Amblique 2012
- 18. New Digital Channels Private Sales Clubs Aggregators 25% Top 100 Apparel ~20% shopping traffic Deals / Group Buying Comparison © Amblique 2012
- 19. Channels Are Shifting Top 100 apparel visit share is changing…. April 2011 April 2012 25% Pure Play 47% 32% 43% Multi-Channel Pure Play Multi-Channel 28% Private Sales 25% Private Sales © Amblique 2012
- 20. Transactional Aggregators – Reach/Value/Loyalty Transactional aggregator channel engagement increases customer value 2.1x 1.6x 2% Engage 1 2 3 of aggregator customers 35-45% were new to brand (online) 7% Value aggregator introduced customers 90% + spend direct at some stage (online) Source: Actual client sales data. Two apparel sits with multiple aggregators and significant volume. © Amblique 2012
- 21. Social 13% YOUR 10% WEBSITE 8% 7% Consumer Buying Journey 1. 2. 3. 4. 5. 6. Consider Evaluate Buy Experience Advocate Bond Retailer Engagement MONITOR RESPOND AMPLIFY LEAD © Amblique 2012
- 22. Social – Advocate Recommendations Are Key Shipping + Range 24 comments in a day © Amblique 2012
- 23. Social - Immediacy …42 minutes later… © Amblique 2012
- 24. Social – What Is It Worth? What value can be attributed to a Fan?? 1.8 visits (0.4 – 6) 1.7% transacted (0.4% - 6.7%) $1.52 ($0.22-$5.59) Value should = Purchase Value + Referral Value NPS is better system Note: Average across 10 apparel sites for 1 year (end April 2012). Only includes online spend. © Amblique 2012
- 25. Social – Interesting In-Store Integration © Amblique 2012
- 26. What Is Required To Compete? 1. Resource & structure appropriately 2. Be omnipresent 3. Leverage offline > online 4. BYO clearance channel © Amblique 2012
- 27. Offline to Online Australian GDP 96.6% Online 3.4%
- 28. What Is Required To Compete? 1. Resource & structure appropriately 2. Be omnipresent 3. Leverage offline > online 4. BYO clearance channel AND Amazon principles apply to all 1. The equation of the business 2. Customer centricity 3. Bridging the physical & the digital © Amblique 2012
- 29. Amazon Principles – The Equation of the Business Source: eCommera © Amblique 2012
- 30. What Is Required To Compete? 1. Resource & structure appropriately 2. Be omnipresent 3. Leverage offline > online 4. BYO clearance channel AND Amazon principles apply to all 1. The equation of the business 2. Customer centricity 3. Bridging the physical & the digital © Amblique 2012
- 31. Amblique Showreel www.youtube.com/watch?v=0DjvfkUZsXk © Amblique 2012
- 32. Blogs & Resources • http://blog.kissmetrics.com • http://www.marketingexperiments.com/blog • http://www.mequoda.com • http://blog.comscore.com • http://blog.demandware.com • http://socialcommercetoday.com • http://www.theverge.com Thank you! Justus Wilde Tim Griffin Online Strategy Director Search Marketing Director jw@amblique.com tg@amblique.com © Amblique 2012