SlideShare uma empresa Scribd logo
1 de 5
Creating a simple stacked column chart – Flex
A post from my blog: http://jbkflex.wordpress.com/2012/01/31/creating-a-simple-stacked-column-chart-
flex/

When I was working with Flex and Action Script 3.0 I used to do a lot of Dashboard and data visualization
applications. One thing that I used to do often was a stacked column chart displaying multi dimensional data. So I
thought of posting an example of creating a stacked chart out of the files deep within my Flex project folders. Let’s
see the demo first and then move on to the explanation.
Demo: http://jbk404.site50.net/flex/playvideo/stackedchart.html


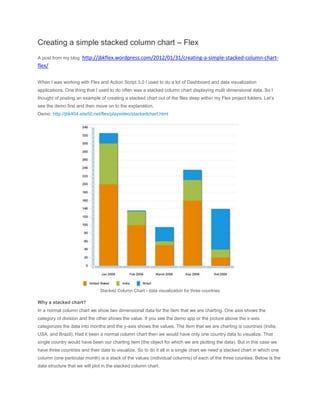
                               Stacked Column Chart - data visualization for three countries

Why a stacked chart?
In a normal column chart we show two dimensional data for the item that we are charting. One axis shows the
category of division and the other shows the value. If you see the demo app or the picture above the x-axis
categorizes the data into months and the y-axis shows the values. The item that we are charting is countries (India,
USA, and Brazil). Had it been a normal column chart then we would have only one country data to visualize. That
single country would have been our charting item (the object for which we are plotting the data). But in this case we
have three countries and their data to visualize. So to do it all in a single chart we need a stacked chart in which one
column (one particular month) is a stack of the values (individual columns) of each of the three counties. Below is the
data structure that we will plot in the stacked column chart,
private var stackedData:ArrayCollection = new ArrayCollection([

{month:"Jan 2009",unitedstates: 200, india:101, brazil: 25},

{month:"Feb 2009",unitedstates: 100, india:34, brazil: 2},

{month:"March 2009",unitedstates: 50, india:10, brazil: 35},

{month:"Sep 2009",unitedstates: 160, india:51, brazil: 25},

{month:"Oct 2009",unitedstates: 20, india:20, brazil: 100},

]);


I will not go into the explanation of each of the classes (such as ArrayCollection) that I am using here, as this example
is meant for someone who is familiar with Flex and ActionScript.
Had we been plotting a normal column chart the data structure would have been something like it is below,

private var data_normal_column_chart:ArrayCollection = new ArrayCollection([

{month:"Jan 2009",india:101},

{month:"Feb 2009",india:34},

{month:"March 2009,india:10},

{month:"Sep 2009",india:51},

{month:"Oct 2009",india:20},

]);


Writing the MXML code – creating the chart component

<mx:VBox width="100%" height="100%">

  <mx:ColumnChart id="chart" width="500" height="500" dataProvider="{stackedData}"
showDataTips="true">

      <mx:horizontalAxis>

        <mx:CategoryAxis categoryField="month"/>

      </mx:horizontalAxis>

      <mx:series>
<mx:ColumnSet type="stacked">

           <mx:ColumnSeries yField="unitedstates" displayName="United States"/>

           <mx:ColumnSeries yField="india" displayName="India"/>

           <mx:ColumnSeries yField="brazil" displayName="Brazil"/>

          </mx:ColumnSet>

     </mx:series>

  </mx:ColumnChart>

  <mx:Legend dataProvider="{chart}" direction="horizontal"/>

</mx:VBox>


To create a stacked chart we have to use the ColumnChart component. You can use the ColumnChart to represent
a variety of different charts including simple columns, clustered columns, stacked, 100% stacked, and high/low. To
visualize the data in our data structure (stackedData) it is data binded to the chart using the dataProvider property.
And then we have set the showDataTips property to true so that a tooltip displays the necessary information for each
column when user moves his mouse over it. The horizontal or the x-axis is a category axis which categorizes the data
by months and I have specified the categoryField to month which is defined in the data. You use
the ColumnSeries chart series with the ColumnChart control to define the data for the chart. A ColumnChart control
expects its series property to contain an array of ColumnSeries objects. Now, to stack the columns use
theColumnSet grouping and set the type property to stacked. There are other options available for type property to
define the grouping behavior of the chart series – clustered, 100%, overlaid. You can check them out in the
ColumnSet link that I have given. You can see in the code that for each ColumnSeries I have specified the data for
the country that it will display in the yField property. The displayName displays the value in the tooltip and the legend.
This is all to create a simple stacked column chart. And finally we have the legend component that shows the chart
legend.
Below is the full source code. You can copy the code and paste it in an .mxml file inside any of your project.

<?xml version="1.0" encoding="utf-8"?>

<s:Application xmlns:fx="http://ns.adobe.com/mxml/2009"

xmlns:s="library://ns.adobe.com/flex/spark"

xmlns:mx="library://ns.adobe.com/flex/mx"

width="100%" height="100%"

pageTitle="Stacked Column Chart">
<fx:Script>

<![CDATA[

import mx.collections.ArrayCollection;


[Bindable]

private var stackedData:ArrayCollection = new ArrayCollection([

{month:"Jan 2009",unitedstates: 200, india:101, brazil: 25},

{month:"Feb 2009",unitedstates: 100, india:34, brazil: 2},

{month:"March 2009",unitedstates: 50, india:10, brazil: 35},

{month:"Sep 2009",unitedstates: 160, india:51, brazil: 25},

{month:"Oct 2009",unitedstates: 20, india:20, brazil: 100},

]);


]]>

</fx:Script>


<mx:VBox width="100%" height="100%">

  <mx:ColumnChart id="chart" width="500" height="500" dataProvider="{stackedData}"
showDataTips="true">

  <mx:horizontalAxis>

      <mx:CategoryAxis categoryField="month"/>

  </mx:horizontalAxis>

  <mx:series>

      <mx:ColumnSet type="stacked">
<mx:ColumnSeries yField="unitedstates" displayName="United States"/>

        <mx:ColumnSeries yField="india" displayName="India"/>

        <mx:ColumnSeries yField="brazil" displayName="Brazil"/>

     </mx:ColumnSet>

  </mx:series>

  </mx:ColumnChart>

  <mx:Legend dataProvider="{chart}" direction="horizontal"/>

</mx:VBox>

</s:Application>


Here is the link to the demo once again: http://jbk404.site50.net/flex/playvideo/stackedchart.html
You can find a detailed tutorial on creating stacked chart- by Adobe in this
link:http://help.adobe.com/en_US/flex/using/WS2db454920e96a9e51e63e3d11c0bf69084-7c6b.html

Mais conteúdo relacionado

Último

[2024]Digital Global Overview Report 2024 Meltwater.pdf
[2024]Digital Global Overview Report 2024 Meltwater.pdf[2024]Digital Global Overview Report 2024 Meltwater.pdf
[2024]Digital Global Overview Report 2024 Meltwater.pdfhans926745
 
Boost PC performance: How more available memory can improve productivity
Boost PC performance: How more available memory can improve productivityBoost PC performance: How more available memory can improve productivity
Boost PC performance: How more available memory can improve productivityPrincipled Technologies
 
The Role of Taxonomy and Ontology in Semantic Layers - Heather Hedden.pdf
The Role of Taxonomy and Ontology in Semantic Layers - Heather Hedden.pdfThe Role of Taxonomy and Ontology in Semantic Layers - Heather Hedden.pdf
The Role of Taxonomy and Ontology in Semantic Layers - Heather Hedden.pdfEnterprise Knowledge
 
Exploring the Future Potential of AI-Enabled Smartphone Processors
Exploring the Future Potential of AI-Enabled Smartphone ProcessorsExploring the Future Potential of AI-Enabled Smartphone Processors
Exploring the Future Potential of AI-Enabled Smartphone Processorsdebabhi2
 
The 7 Things I Know About Cyber Security After 25 Years | April 2024
The 7 Things I Know About Cyber Security After 25 Years | April 2024The 7 Things I Know About Cyber Security After 25 Years | April 2024
The 7 Things I Know About Cyber Security After 25 Years | April 2024Rafal Los
 
How to convert PDF to text with Nanonets
How to convert PDF to text with NanonetsHow to convert PDF to text with Nanonets
How to convert PDF to text with Nanonetsnaman860154
 
Factors to Consider When Choosing Accounts Payable Services Providers.pptx
Factors to Consider When Choosing Accounts Payable Services Providers.pptxFactors to Consider When Choosing Accounts Payable Services Providers.pptx
Factors to Consider When Choosing Accounts Payable Services Providers.pptxKatpro Technologies
 
A Year of the Servo Reboot: Where Are We Now?
A Year of the Servo Reboot: Where Are We Now?A Year of the Servo Reboot: Where Are We Now?
A Year of the Servo Reboot: Where Are We Now?Igalia
 
From Event to Action: Accelerate Your Decision Making with Real-Time Automation
From Event to Action: Accelerate Your Decision Making with Real-Time AutomationFrom Event to Action: Accelerate Your Decision Making with Real-Time Automation
From Event to Action: Accelerate Your Decision Making with Real-Time AutomationSafe Software
 
Automating Google Workspace (GWS) & more with Apps Script
Automating Google Workspace (GWS) & more with Apps ScriptAutomating Google Workspace (GWS) & more with Apps Script
Automating Google Workspace (GWS) & more with Apps Scriptwesley chun
 
The Codex of Business Writing Software for Real-World Solutions 2.pptx
The Codex of Business Writing Software for Real-World Solutions 2.pptxThe Codex of Business Writing Software for Real-World Solutions 2.pptx
The Codex of Business Writing Software for Real-World Solutions 2.pptxMalak Abu Hammad
 
Raspberry Pi 5: Challenges and Solutions in Bringing up an OpenGL/Vulkan Driv...
Raspberry Pi 5: Challenges and Solutions in Bringing up an OpenGL/Vulkan Driv...Raspberry Pi 5: Challenges and Solutions in Bringing up an OpenGL/Vulkan Driv...
Raspberry Pi 5: Challenges and Solutions in Bringing up an OpenGL/Vulkan Driv...Igalia
 
GenCyber Cyber Security Day Presentation
GenCyber Cyber Security Day PresentationGenCyber Cyber Security Day Presentation
GenCyber Cyber Security Day PresentationMichael W. Hawkins
 
Finology Group – Insurtech Innovation Award 2024
Finology Group – Insurtech Innovation Award 2024Finology Group – Insurtech Innovation Award 2024
Finology Group – Insurtech Innovation Award 2024The Digital Insurer
 
EIS-Webinar-Prompt-Knowledge-Eng-2024-04-08.pptx
EIS-Webinar-Prompt-Knowledge-Eng-2024-04-08.pptxEIS-Webinar-Prompt-Knowledge-Eng-2024-04-08.pptx
EIS-Webinar-Prompt-Knowledge-Eng-2024-04-08.pptxEarley Information Science
 
Histor y of HAM Radio presentation slide
Histor y of HAM Radio presentation slideHistor y of HAM Radio presentation slide
Histor y of HAM Radio presentation slidevu2urc
 
A Domino Admins Adventures (Engage 2024)
A Domino Admins Adventures (Engage 2024)A Domino Admins Adventures (Engage 2024)
A Domino Admins Adventures (Engage 2024)Gabriella Davis
 
Slack Application Development 101 Slides
Slack Application Development 101 SlidesSlack Application Development 101 Slides
Slack Application Development 101 Slidespraypatel2
 
Strategies for Unlocking Knowledge Management in Microsoft 365 in the Copilot...
Strategies for Unlocking Knowledge Management in Microsoft 365 in the Copilot...Strategies for Unlocking Knowledge Management in Microsoft 365 in the Copilot...
Strategies for Unlocking Knowledge Management in Microsoft 365 in the Copilot...Drew Madelung
 
How to Troubleshoot Apps for the Modern Connected Worker
How to Troubleshoot Apps for the Modern Connected WorkerHow to Troubleshoot Apps for the Modern Connected Worker
How to Troubleshoot Apps for the Modern Connected WorkerThousandEyes
 

Último (20)

[2024]Digital Global Overview Report 2024 Meltwater.pdf
[2024]Digital Global Overview Report 2024 Meltwater.pdf[2024]Digital Global Overview Report 2024 Meltwater.pdf
[2024]Digital Global Overview Report 2024 Meltwater.pdf
 
Boost PC performance: How more available memory can improve productivity
Boost PC performance: How more available memory can improve productivityBoost PC performance: How more available memory can improve productivity
Boost PC performance: How more available memory can improve productivity
 
The Role of Taxonomy and Ontology in Semantic Layers - Heather Hedden.pdf
The Role of Taxonomy and Ontology in Semantic Layers - Heather Hedden.pdfThe Role of Taxonomy and Ontology in Semantic Layers - Heather Hedden.pdf
The Role of Taxonomy and Ontology in Semantic Layers - Heather Hedden.pdf
 
Exploring the Future Potential of AI-Enabled Smartphone Processors
Exploring the Future Potential of AI-Enabled Smartphone ProcessorsExploring the Future Potential of AI-Enabled Smartphone Processors
Exploring the Future Potential of AI-Enabled Smartphone Processors
 
The 7 Things I Know About Cyber Security After 25 Years | April 2024
The 7 Things I Know About Cyber Security After 25 Years | April 2024The 7 Things I Know About Cyber Security After 25 Years | April 2024
The 7 Things I Know About Cyber Security After 25 Years | April 2024
 
How to convert PDF to text with Nanonets
How to convert PDF to text with NanonetsHow to convert PDF to text with Nanonets
How to convert PDF to text with Nanonets
 
Factors to Consider When Choosing Accounts Payable Services Providers.pptx
Factors to Consider When Choosing Accounts Payable Services Providers.pptxFactors to Consider When Choosing Accounts Payable Services Providers.pptx
Factors to Consider When Choosing Accounts Payable Services Providers.pptx
 
A Year of the Servo Reboot: Where Are We Now?
A Year of the Servo Reboot: Where Are We Now?A Year of the Servo Reboot: Where Are We Now?
A Year of the Servo Reboot: Where Are We Now?
 
From Event to Action: Accelerate Your Decision Making with Real-Time Automation
From Event to Action: Accelerate Your Decision Making with Real-Time AutomationFrom Event to Action: Accelerate Your Decision Making with Real-Time Automation
From Event to Action: Accelerate Your Decision Making with Real-Time Automation
 
Automating Google Workspace (GWS) & more with Apps Script
Automating Google Workspace (GWS) & more with Apps ScriptAutomating Google Workspace (GWS) & more with Apps Script
Automating Google Workspace (GWS) & more with Apps Script
 
The Codex of Business Writing Software for Real-World Solutions 2.pptx
The Codex of Business Writing Software for Real-World Solutions 2.pptxThe Codex of Business Writing Software for Real-World Solutions 2.pptx
The Codex of Business Writing Software for Real-World Solutions 2.pptx
 
Raspberry Pi 5: Challenges and Solutions in Bringing up an OpenGL/Vulkan Driv...
Raspberry Pi 5: Challenges and Solutions in Bringing up an OpenGL/Vulkan Driv...Raspberry Pi 5: Challenges and Solutions in Bringing up an OpenGL/Vulkan Driv...
Raspberry Pi 5: Challenges and Solutions in Bringing up an OpenGL/Vulkan Driv...
 
GenCyber Cyber Security Day Presentation
GenCyber Cyber Security Day PresentationGenCyber Cyber Security Day Presentation
GenCyber Cyber Security Day Presentation
 
Finology Group – Insurtech Innovation Award 2024
Finology Group – Insurtech Innovation Award 2024Finology Group – Insurtech Innovation Award 2024
Finology Group – Insurtech Innovation Award 2024
 
EIS-Webinar-Prompt-Knowledge-Eng-2024-04-08.pptx
EIS-Webinar-Prompt-Knowledge-Eng-2024-04-08.pptxEIS-Webinar-Prompt-Knowledge-Eng-2024-04-08.pptx
EIS-Webinar-Prompt-Knowledge-Eng-2024-04-08.pptx
 
Histor y of HAM Radio presentation slide
Histor y of HAM Radio presentation slideHistor y of HAM Radio presentation slide
Histor y of HAM Radio presentation slide
 
A Domino Admins Adventures (Engage 2024)
A Domino Admins Adventures (Engage 2024)A Domino Admins Adventures (Engage 2024)
A Domino Admins Adventures (Engage 2024)
 
Slack Application Development 101 Slides
Slack Application Development 101 SlidesSlack Application Development 101 Slides
Slack Application Development 101 Slides
 
Strategies for Unlocking Knowledge Management in Microsoft 365 in the Copilot...
Strategies for Unlocking Knowledge Management in Microsoft 365 in the Copilot...Strategies for Unlocking Knowledge Management in Microsoft 365 in the Copilot...
Strategies for Unlocking Knowledge Management in Microsoft 365 in the Copilot...
 
How to Troubleshoot Apps for the Modern Connected Worker
How to Troubleshoot Apps for the Modern Connected WorkerHow to Troubleshoot Apps for the Modern Connected Worker
How to Troubleshoot Apps for the Modern Connected Worker
 

Destaque

2024 State of Marketing Report – by Hubspot
2024 State of Marketing Report – by Hubspot2024 State of Marketing Report – by Hubspot
2024 State of Marketing Report – by HubspotMarius Sescu
 
Everything You Need To Know About ChatGPT
Everything You Need To Know About ChatGPTEverything You Need To Know About ChatGPT
Everything You Need To Know About ChatGPTExpeed Software
 
Product Design Trends in 2024 | Teenage Engineerings
Product Design Trends in 2024 | Teenage EngineeringsProduct Design Trends in 2024 | Teenage Engineerings
Product Design Trends in 2024 | Teenage EngineeringsPixeldarts
 
How Race, Age and Gender Shape Attitudes Towards Mental Health
How Race, Age and Gender Shape Attitudes Towards Mental HealthHow Race, Age and Gender Shape Attitudes Towards Mental Health
How Race, Age and Gender Shape Attitudes Towards Mental HealthThinkNow
 
AI Trends in Creative Operations 2024 by Artwork Flow.pdf
AI Trends in Creative Operations 2024 by Artwork Flow.pdfAI Trends in Creative Operations 2024 by Artwork Flow.pdf
AI Trends in Creative Operations 2024 by Artwork Flow.pdfmarketingartwork
 
PEPSICO Presentation to CAGNY Conference Feb 2024
PEPSICO Presentation to CAGNY Conference Feb 2024PEPSICO Presentation to CAGNY Conference Feb 2024
PEPSICO Presentation to CAGNY Conference Feb 2024Neil Kimberley
 
Content Methodology: A Best Practices Report (Webinar)
Content Methodology: A Best Practices Report (Webinar)Content Methodology: A Best Practices Report (Webinar)
Content Methodology: A Best Practices Report (Webinar)contently
 
How to Prepare For a Successful Job Search for 2024
How to Prepare For a Successful Job Search for 2024How to Prepare For a Successful Job Search for 2024
How to Prepare For a Successful Job Search for 2024Albert Qian
 
Social Media Marketing Trends 2024 // The Global Indie Insights
Social Media Marketing Trends 2024 // The Global Indie InsightsSocial Media Marketing Trends 2024 // The Global Indie Insights
Social Media Marketing Trends 2024 // The Global Indie InsightsKurio // The Social Media Age(ncy)
 
Trends In Paid Search: Navigating The Digital Landscape In 2024
Trends In Paid Search: Navigating The Digital Landscape In 2024Trends In Paid Search: Navigating The Digital Landscape In 2024
Trends In Paid Search: Navigating The Digital Landscape In 2024Search Engine Journal
 
5 Public speaking tips from TED - Visualized summary
5 Public speaking tips from TED - Visualized summary5 Public speaking tips from TED - Visualized summary
5 Public speaking tips from TED - Visualized summarySpeakerHub
 
ChatGPT and the Future of Work - Clark Boyd
ChatGPT and the Future of Work - Clark Boyd ChatGPT and the Future of Work - Clark Boyd
ChatGPT and the Future of Work - Clark Boyd Clark Boyd
 
Getting into the tech field. what next
Getting into the tech field. what next Getting into the tech field. what next
Getting into the tech field. what next Tessa Mero
 
Google's Just Not That Into You: Understanding Core Updates & Search Intent
Google's Just Not That Into You: Understanding Core Updates & Search IntentGoogle's Just Not That Into You: Understanding Core Updates & Search Intent
Google's Just Not That Into You: Understanding Core Updates & Search IntentLily Ray
 
Time Management & Productivity - Best Practices
Time Management & Productivity -  Best PracticesTime Management & Productivity -  Best Practices
Time Management & Productivity - Best PracticesVit Horky
 
The six step guide to practical project management
The six step guide to practical project managementThe six step guide to practical project management
The six step guide to practical project managementMindGenius
 
Beginners Guide to TikTok for Search - Rachel Pearson - We are Tilt __ Bright...
Beginners Guide to TikTok for Search - Rachel Pearson - We are Tilt __ Bright...Beginners Guide to TikTok for Search - Rachel Pearson - We are Tilt __ Bright...
Beginners Guide to TikTok for Search - Rachel Pearson - We are Tilt __ Bright...RachelPearson36
 

Destaque (20)

2024 State of Marketing Report – by Hubspot
2024 State of Marketing Report – by Hubspot2024 State of Marketing Report – by Hubspot
2024 State of Marketing Report – by Hubspot
 
Everything You Need To Know About ChatGPT
Everything You Need To Know About ChatGPTEverything You Need To Know About ChatGPT
Everything You Need To Know About ChatGPT
 
Product Design Trends in 2024 | Teenage Engineerings
Product Design Trends in 2024 | Teenage EngineeringsProduct Design Trends in 2024 | Teenage Engineerings
Product Design Trends in 2024 | Teenage Engineerings
 
How Race, Age and Gender Shape Attitudes Towards Mental Health
How Race, Age and Gender Shape Attitudes Towards Mental HealthHow Race, Age and Gender Shape Attitudes Towards Mental Health
How Race, Age and Gender Shape Attitudes Towards Mental Health
 
AI Trends in Creative Operations 2024 by Artwork Flow.pdf
AI Trends in Creative Operations 2024 by Artwork Flow.pdfAI Trends in Creative Operations 2024 by Artwork Flow.pdf
AI Trends in Creative Operations 2024 by Artwork Flow.pdf
 
Skeleton Culture Code
Skeleton Culture CodeSkeleton Culture Code
Skeleton Culture Code
 
PEPSICO Presentation to CAGNY Conference Feb 2024
PEPSICO Presentation to CAGNY Conference Feb 2024PEPSICO Presentation to CAGNY Conference Feb 2024
PEPSICO Presentation to CAGNY Conference Feb 2024
 
Content Methodology: A Best Practices Report (Webinar)
Content Methodology: A Best Practices Report (Webinar)Content Methodology: A Best Practices Report (Webinar)
Content Methodology: A Best Practices Report (Webinar)
 
How to Prepare For a Successful Job Search for 2024
How to Prepare For a Successful Job Search for 2024How to Prepare For a Successful Job Search for 2024
How to Prepare For a Successful Job Search for 2024
 
Social Media Marketing Trends 2024 // The Global Indie Insights
Social Media Marketing Trends 2024 // The Global Indie InsightsSocial Media Marketing Trends 2024 // The Global Indie Insights
Social Media Marketing Trends 2024 // The Global Indie Insights
 
Trends In Paid Search: Navigating The Digital Landscape In 2024
Trends In Paid Search: Navigating The Digital Landscape In 2024Trends In Paid Search: Navigating The Digital Landscape In 2024
Trends In Paid Search: Navigating The Digital Landscape In 2024
 
5 Public speaking tips from TED - Visualized summary
5 Public speaking tips from TED - Visualized summary5 Public speaking tips from TED - Visualized summary
5 Public speaking tips from TED - Visualized summary
 
ChatGPT and the Future of Work - Clark Boyd
ChatGPT and the Future of Work - Clark Boyd ChatGPT and the Future of Work - Clark Boyd
ChatGPT and the Future of Work - Clark Boyd
 
Getting into the tech field. what next
Getting into the tech field. what next Getting into the tech field. what next
Getting into the tech field. what next
 
Google's Just Not That Into You: Understanding Core Updates & Search Intent
Google's Just Not That Into You: Understanding Core Updates & Search IntentGoogle's Just Not That Into You: Understanding Core Updates & Search Intent
Google's Just Not That Into You: Understanding Core Updates & Search Intent
 
How to have difficult conversations
How to have difficult conversations How to have difficult conversations
How to have difficult conversations
 
Introduction to Data Science
Introduction to Data ScienceIntroduction to Data Science
Introduction to Data Science
 
Time Management & Productivity - Best Practices
Time Management & Productivity -  Best PracticesTime Management & Productivity -  Best Practices
Time Management & Productivity - Best Practices
 
The six step guide to practical project management
The six step guide to practical project managementThe six step guide to practical project management
The six step guide to practical project management
 
Beginners Guide to TikTok for Search - Rachel Pearson - We are Tilt __ Bright...
Beginners Guide to TikTok for Search - Rachel Pearson - We are Tilt __ Bright...Beginners Guide to TikTok for Search - Rachel Pearson - We are Tilt __ Bright...
Beginners Guide to TikTok for Search - Rachel Pearson - We are Tilt __ Bright...
 

Creating a simple stacked column chart – Flex

  • 1. Creating a simple stacked column chart – Flex A post from my blog: http://jbkflex.wordpress.com/2012/01/31/creating-a-simple-stacked-column-chart- flex/ When I was working with Flex and Action Script 3.0 I used to do a lot of Dashboard and data visualization applications. One thing that I used to do often was a stacked column chart displaying multi dimensional data. So I thought of posting an example of creating a stacked chart out of the files deep within my Flex project folders. Let’s see the demo first and then move on to the explanation. Demo: http://jbk404.site50.net/flex/playvideo/stackedchart.html Stacked Column Chart - data visualization for three countries Why a stacked chart? In a normal column chart we show two dimensional data for the item that we are charting. One axis shows the category of division and the other shows the value. If you see the demo app or the picture above the x-axis categorizes the data into months and the y-axis shows the values. The item that we are charting is countries (India, USA, and Brazil). Had it been a normal column chart then we would have only one country data to visualize. That single country would have been our charting item (the object for which we are plotting the data). But in this case we have three countries and their data to visualize. So to do it all in a single chart we need a stacked chart in which one column (one particular month) is a stack of the values (individual columns) of each of the three counties. Below is the data structure that we will plot in the stacked column chart,
  • 2. private var stackedData:ArrayCollection = new ArrayCollection([ {month:"Jan 2009",unitedstates: 200, india:101, brazil: 25}, {month:"Feb 2009",unitedstates: 100, india:34, brazil: 2}, {month:"March 2009",unitedstates: 50, india:10, brazil: 35}, {month:"Sep 2009",unitedstates: 160, india:51, brazil: 25}, {month:"Oct 2009",unitedstates: 20, india:20, brazil: 100}, ]); I will not go into the explanation of each of the classes (such as ArrayCollection) that I am using here, as this example is meant for someone who is familiar with Flex and ActionScript. Had we been plotting a normal column chart the data structure would have been something like it is below, private var data_normal_column_chart:ArrayCollection = new ArrayCollection([ {month:"Jan 2009",india:101}, {month:"Feb 2009",india:34}, {month:"March 2009,india:10}, {month:"Sep 2009",india:51}, {month:"Oct 2009",india:20}, ]); Writing the MXML code – creating the chart component <mx:VBox width="100%" height="100%"> <mx:ColumnChart id="chart" width="500" height="500" dataProvider="{stackedData}" showDataTips="true"> <mx:horizontalAxis> <mx:CategoryAxis categoryField="month"/> </mx:horizontalAxis> <mx:series>
  • 3. <mx:ColumnSet type="stacked"> <mx:ColumnSeries yField="unitedstates" displayName="United States"/> <mx:ColumnSeries yField="india" displayName="India"/> <mx:ColumnSeries yField="brazil" displayName="Brazil"/> </mx:ColumnSet> </mx:series> </mx:ColumnChart> <mx:Legend dataProvider="{chart}" direction="horizontal"/> </mx:VBox> To create a stacked chart we have to use the ColumnChart component. You can use the ColumnChart to represent a variety of different charts including simple columns, clustered columns, stacked, 100% stacked, and high/low. To visualize the data in our data structure (stackedData) it is data binded to the chart using the dataProvider property. And then we have set the showDataTips property to true so that a tooltip displays the necessary information for each column when user moves his mouse over it. The horizontal or the x-axis is a category axis which categorizes the data by months and I have specified the categoryField to month which is defined in the data. You use the ColumnSeries chart series with the ColumnChart control to define the data for the chart. A ColumnChart control expects its series property to contain an array of ColumnSeries objects. Now, to stack the columns use theColumnSet grouping and set the type property to stacked. There are other options available for type property to define the grouping behavior of the chart series – clustered, 100%, overlaid. You can check them out in the ColumnSet link that I have given. You can see in the code that for each ColumnSeries I have specified the data for the country that it will display in the yField property. The displayName displays the value in the tooltip and the legend. This is all to create a simple stacked column chart. And finally we have the legend component that shows the chart legend. Below is the full source code. You can copy the code and paste it in an .mxml file inside any of your project. <?xml version="1.0" encoding="utf-8"?> <s:Application xmlns:fx="http://ns.adobe.com/mxml/2009" xmlns:s="library://ns.adobe.com/flex/spark" xmlns:mx="library://ns.adobe.com/flex/mx" width="100%" height="100%" pageTitle="Stacked Column Chart">
  • 4. <fx:Script> <![CDATA[ import mx.collections.ArrayCollection; [Bindable] private var stackedData:ArrayCollection = new ArrayCollection([ {month:"Jan 2009",unitedstates: 200, india:101, brazil: 25}, {month:"Feb 2009",unitedstates: 100, india:34, brazil: 2}, {month:"March 2009",unitedstates: 50, india:10, brazil: 35}, {month:"Sep 2009",unitedstates: 160, india:51, brazil: 25}, {month:"Oct 2009",unitedstates: 20, india:20, brazil: 100}, ]); ]]> </fx:Script> <mx:VBox width="100%" height="100%"> <mx:ColumnChart id="chart" width="500" height="500" dataProvider="{stackedData}" showDataTips="true"> <mx:horizontalAxis> <mx:CategoryAxis categoryField="month"/> </mx:horizontalAxis> <mx:series> <mx:ColumnSet type="stacked">
  • 5. <mx:ColumnSeries yField="unitedstates" displayName="United States"/> <mx:ColumnSeries yField="india" displayName="India"/> <mx:ColumnSeries yField="brazil" displayName="Brazil"/> </mx:ColumnSet> </mx:series> </mx:ColumnChart> <mx:Legend dataProvider="{chart}" direction="horizontal"/> </mx:VBox> </s:Application> Here is the link to the demo once again: http://jbk404.site50.net/flex/playvideo/stackedchart.html You can find a detailed tutorial on creating stacked chart- by Adobe in this link:http://help.adobe.com/en_US/flex/using/WS2db454920e96a9e51e63e3d11c0bf69084-7c6b.html