Gattuso et al 2015 science acidification

Key messages Maintaining ocean ecosystems and services depends in large part on the negotiation process toward a global climate agreement under the UNFCCC. In this regard, four key messages emerge from our analysis. First, the ocean strongly influences the climate system and provides important services to humans. Second, impacts on key marine and coastal organisms, ecosystems, and services from anthropogenic CO2 emissions are already detectable, and several will face high risk of impacts well before 2100, even with the stringent CO2 emissions scenario (RCP2.6). These impacts are occurring across all latitudes and have become a global concern that spans the traditional north/south divide. Third, the analysis shows that immediate and substantial reduction of CO2 emissions is required in order to prevent the massive and effectively irreversible impacts on ocean ecosystems and their services that are projected with emissions scenarios more severe than RCP2.6. Limiting emissions to below this level is necessary to meet UNFCCC's stated objectives. Management options that overlook CO2, such as solar radiation management and control of methane emission, will only minimize impacts of ocean warming and not those of ocean acidification. Fourth, as CO2 increases, the protection, adaptation, and repair options for the ocean become fewer and less effective. Given the contrasting futures we have outlined here, the ocean provides further compelling arguments for rapid and rigorous CO2 emission reduction and eventual reduction of atmospheric CO2 content. As a result, any new global climate agreement that does not minimize the impacts on the ocean will be incomplete and inadequate.

Recomendados
Mais conteúdo relacionado
Mais procurados
Mais procurados (20)
Semelhante a Gattuso et al 2015 science acidification
Semelhante a Gattuso et al 2015 science acidification (20)
Mais de www.thiiink.com
Mais de www.thiiink.com (20)
Último
Último (20)
Gattuso et al 2015 science acidification
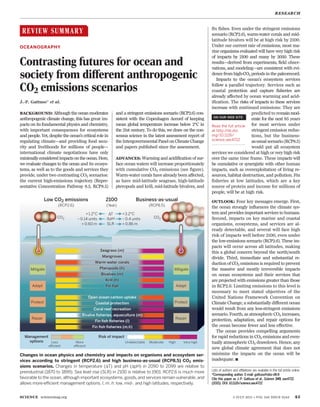
- 1. REVIEW SUMMARY ◥ OCEANOGRAPHY Contrasting futures for ocean and society from different anthropogenic CO2 emissions scenarios J.-P. Gattuso* et al. BACKGROUND: Althoughtheoceanmoderates anthropogenic climate change, this has great im- pacts on its fundamental physics and chemistry, with important consequences for ecosystems and people. Yet, despite the ocean’s critical role in regulating climate—and providing food secu- rity and livelihoods for millions of people— international climate negotiations have only minimallyconsideredimpactsontheocean.Here, we evaluate changes to the ocean and its ecosys- tems, as well as to the goods and services they provide, under two contrasting CO2 scenarios: the current high-emissions trajectory (Repre- sentative Concentration Pathway 8.5, RCP8.5) and a stringent emissions scenario (RCP2.6) con- sistent with the Copenhagen Accord of keeping mean global temperature increase below 2°C in the 21st century. To do this, we draw on the con- sensus science in the latest assessment report of the Intergovernmental Panel onClimateChange and papers published since the assessment. ADVANCES: Warming and acidification of sur- face ocean waters will increase proportionately with cumulative CO2 emissions (see figure). Warm-water corals have already been affected, as have mid-latitude seagrass, high-latitude pteropods and krill, mid-latitude bivalves, and fin fishes. Even under the stringent emissions scenario (RCP2.6), warm-water corals and mid- latitude bivalves will be at high risk by 2100. Under our current rate of emissions, most ma- rine organisms evaluated will have very high risk of impacts by 2100 and many by 2050. These results—derived from experiments, field obser- vations, and modeling—are consistent with evi- dence from high-CO2 periods in the paleorecord. Impacts to the ocean’s ecosystem services follow a parallel trajectory. Services such as coastal protection and capture fisheries are already affected by ocean warming and acid- ification. The risks of impacts to these services increase with continued emissions: They are predicted to remainmod- erate for the next 85 years for most services under stringent emission reduc- tions, but the business- as-usual scenario (RCP8.5) would put all ecosystem services we considered at high or very high risk over the same time frame. These impacts will be cumulative or synergistic with other human impacts, such as overexploitation of living re- sources, habitat destruction, and pollution. Fin fisheries at low latitudes, which are a key source of protein and income for millions of people, will be at high risk. OUTLOOK: Four key messages emerge. First, the ocean strongly influences the climate sys- tem and provides important services to humans. Second, impacts on key marine and coastal organisms, ecosystems, and services are al- ready detectable, and several will face high risk of impacts well before 2100, even under the low-emissions scenario (RCP2.6). These im- pacts will occur across all latitudes, making this a global concern beyond the north/south divide. Third, immediate and substantial re- duction of CO2 emissions is required to prevent the massive and mostly irreversible impacts on ocean ecosystems and their services that are projected with emissions greater than those in RCP2.6. Limiting emissions to this level is necessary to meet stated objectives of the United Nations Framework Convention on Climate Change; a substantially different ocean would result from any less-stringent emissions scenario. Fourth, as atmospheric CO2 increases, protection, adaptation, and repair options for the ocean become fewer and less effective. The ocean provides compelling arguments for rapid reductions in CO2 emissions and even- tually atmospheric CO2 drawdown. Hence, any new global climate agreement that does not minimize the impacts on the ocean will be inadequate. ▪ RESEARCH SCIENCE sciencemag.org 3 JULY 2015 • VOL 349 ISSUE 6243 45 Lists of authors and affiliations are available in the full article online. *Corresponding author. E-mail: gattuso@obs-vlfr.fr Cite this paper as J.-P. Gattuso et al., Science 349, aac4722 (2015). DOI: 10.1126/science.aac4722 Seagrass (m) Mangroves Warm-water corals Pteropods (h) Bivalves (m) Krill (h) Fin fish Open ocean carbon uptake Coastal protection Coral reef recreation Bivalve fisheries, aquaculture (m) Fin fish fisheries (l) Fin fish fisheries (m,h) pH SLR + 0.86 m T +3.2°C –0.4 units + 0.60 m –0.14 units +1.2°C Mitigate Adapt Protect Repair Mitigate Adapt Protect Repair Undetectable Moderate High Very highLess efficient More efficient Risk of impactManagement options Business-as-usual (RCP8.5) 2100 (Year) Low CO2 emissions (RCP2.6) CO2CO2 Changes in ocean physics and chemistry and impacts on organisms and ecosystem ser- vices according to stringent (RCP2.6) and high business-as-usual (RCP8.5) CO2 emis- sions scenarios. Changes in temperature (DT) and pH (DpH) in 2090 to 2099 are relative to preindustrial (1870 to 1899). Sea level rise (SLR) in 2100 is relative to 1901. RCP2.6 is much more favorable to the ocean, although important ecosystems, goods, and services remain vulnerable, and allows more-efficient management options. l, m, h: low, mid-, and high latitudes, respectively. ON OUR WEB SITE ◥ Read the full article at http://dx.doi. org/10.1126/ science.aac4722 ..................................................
- 2. REVIEW ◥ OCEANOGRAPHY Contrasting futures for ocean and society from different anthropogenic CO2 emissions scenarios J.-P. Gattuso,1,2,3 * A. Magnan,3 R. Billé,4 W. W. L. Cheung,5 E. L. Howes,6 F. Joos,7 D. Allemand,8,9 L. Bopp,10 S. R. Cooley,11 C. M. Eakin,12 O. Hoegh-Guldberg,13 R. P. Kelly,14 H.-O. Pörtner,6 A. D. Rogers,15 J. M. Baxter,16 D. Laffoley,17 D. Osborn,18 A. Rankovic,3,19 J. Rochette,3 U. R. Sumaila,20 S. Treyer,3 C. Turley21 The ocean moderates anthropogenic climate change at the cost of profound alterations of its physics, chemistry, ecology, and services. Here, we evaluate and compare the risks of impacts on marine and coastal ecosystems—and the goods and services they provide—for growing cumulative carbon emissions under two contrasting emissions scenarios. The current emissions trajectory would rapidly and significantly alter many ecosystems and the associated services on which humans heavily depend. A reduced emissions scenario— consistent with the Copenhagen Accord’s goal of a global temperature increase of less than 2°C—is much more favorable to the ocean but still substantially alters important marine ecosystems and associated goods and services. The management options to address ocean impacts narrow as the ocean warms and acidifies. Consequently, any new climate regime that fails to minimize ocean impacts would be incomplete and inadequate. A tmospheric carbon dioxide (CO2) has in- creased from 278 to 400 parts per million (ppm) over the industrial period and, to- gether with the increase of other green- house gases, has driven a series of major environmental changes. The global ocean (includ- ing enclosed seas) acts as a climate integrator that (i) absorbed 93% of Earth’s additional heat since the 1970s, offsetting much atmospheric warming but increasing ocean temperature and sea level; (ii) captured 28% of anthropogenic CO2 emissions since 1750, leading to ocean acidifica- tion; and (iii) accumulated nearly all water result- ing from melting glaciers and ice sheets, hence furthering the rise in sea level. Thus, the ocean moderates anthropogenic climate change at the cost of major changes in its fundamental chem- istry and physics. These changes in ocean prop- erties profoundly affect species’ biogeography and phenology, as well as ecosystem dynamics and biogeochemical cycling (1–3). Such changes inevitably affect the ecosystem services on which humans depend. The ocean represents more than 90% of Earth’s habitable space, hosts 25% of eukaryotic species (4), provides 11% of global animal protein consumed by humans (5), pro- tects coastlines, and more. Simply put, the ocean plays a particularly important role in the live- lihood and food security of hundreds of millions of people. The United Nations Framework Convention on Climate Change (UNFCCC) aims to stabilize atmospheric greenhouse gas concentrations “at a level that would prevent dangerous anthropogenic interference with the climate system ... within a time-frame sufficient to allow ecosystems to adapt naturally to climate change, to ensure that food production is not threatened, and to enable eco- nomic development to proceed in a sustainable manner” (6). According to the Copenhagen Ac- cord (7), meeting these goals requires that the increase in average global surface temperature be less than 2°C over the preindustrial average. However, despite the ocean’s critical role in global ecosystem goods and services, international cli- mate negotiations have only minimally considered ocean impacts, especially those related to ocean acidification (8). Accordingly, highlighting ocean- related issues is now crucial, given that even achieving the +2°C target (set on global tem- perature) would not prevent many climate-related impacts upon the ocean (9). This paper first summarizes the key findings of the Fifth Assessment Report (AR5) of the In- tergovernmental Panel on Climate Change (IPCC) and, given the ongoing acceleration of climate change research, adds newer literature to assess the impacts of global change—including ocean warming, acidification, deoxygenation, and sea level rise—linking ocean physics and chemistry to biological processes, ecosystem functions, and human activities. Second, it builds on scenarios based on the range of cumulative fossil carbon emissions and the IPCC Representative Concen- tration Pathways (RCP) RCP2.6 and RCP8.5, con- trasting two potential futures. RCP2.6 reflects the UNFCCC target of global temperature staying below +2°C, whereas RCP8.5 reflects the current trajectory of business-as-usual CO2 emissions. Third, this paper provides a broad discussion of the options society has for addressing ocean im- pacts and ends with key messages that provide further compelling arguments for ambitious CO2 emissions reduction pathways. Changes in ocean physics and chemistry Ocean changes resulting from anthropogenic emissions include long-term increase in temper- ature down to at least 700 m, increased sea level, and a decrease in Arctic summer sea ice (Fig. 1 and Table 1) (10). Other radiatively active agents—such as ozone, methane, nitrous oxide, and aerosols— do not affect the ocean as much as CO2. Setting it apart, CO2 accounts for two or more times the warming attributed to the non-CO2 greenhouse gases by 2100 (11) and causes ocean acidification. The uptake of excess anthropogenic CO2 by the ocean increases the partial pressure of carbon dioxide (PCO2) and dissolved inorganic carbon while decreasing pH and the saturation state of seawater with respect to the calcium carbonate minerals aragonite and calcite, both being crit- ical drivers of solubility of shells and skeletons (12). Rising global CO2 also further exacerbates the nearshore biogeochemical changes associated with land use change, nutrient inputs, aquaculture, and fishing (13). Both the magnitude and rate of the anthropo- genic carbon perturbation exceed the extent of natural variation over the last millennium and RESEARCH SCIENCE sciencemag.org 3 JULY 2015 • VOL 349 ISSUE 6243 aac4722-1 1 Laboratoire d'Océanographie de Villefranche, CNRS–Institut National des Sciences de l’Univers, F-06230 Villefranche- sur-mer, France. 2 Sorbonne Universités, Université Pierre et Marie Curie, Univ Paris 06, Observatoire Océanologique, F-06230 Villefranche-sur-mer, France. 3 Institute for Sustainable Development and International Relations, Sciences Po, 27 rue Saint Guillaume, F-75007 Paris, France. 4 Secretariat of the Pacific Community, B.P. D5, 98848 Noumea Cedex, New Caledonia. 5 Nippon Foundation-UBC Nereus Program, University of British Columbia (UBC), Vancouver, BC V6T 1Z4, Canada. 6 Alfred Wegener Institute, Helmholtz Centre for Polar and Marine Research, Am Handelshafen 12, D-27570, Bremenrhaven, Germany. 7 Climate and Environmental Physics, Physics Institute and Oeschger Centre for Climate Change Research, University of Bern, Sidlerstrasse 5, CH-3012 Bern, Switzerland. 8 Centre Scientifique de Monaco, 8 Quai Antoine Ier, MC-98000 Monaco, Principality of Monaco. 9 Scientific and Technical Committee, Prince Albert II of Monaco Foundation, 16 Boulevard de Suisse, MC-98000 Monaco, Principality of Monaco. 10 Institut Pierre Simon Laplace/Laboratoire des Science du Climat et de l’Environnement, UMR8212, CNRS–Commissariat à l'Énergie Atomique et aux Énergies Alternatives–Université de Versailles Saint-Quentin-en- Yvelines, Gif sur Yvette, France. 11 Ocean Conservancy, 1300 19th Street NW, 8th Floor, Washington, DC 20036, USA. 12 Coral Reef Watch, National Oceanic and Atmospheric Administration, College Park, MD 20740, USA. 13 Global Change Institute and Australian Research Council Centre for Excellence in Coral Reef Studies, University of Queensland, Building 20, St Lucia, 4072 Queensland, Australia. 14 School of Marine and Environmental Affairs, University of Washington, 3707 Brooklyn Avenue NE, Seattle, WA 98105, USA. 15 Department of Zoology, University of Oxford, South Parks Road, Oxford OX1 3PS, UK. 16 Scottish Natural Heritage, 231 Corstorphine Road, Edinburgh EH12 7AT, Scotland. 17 IUCN, Rue Mauverney 28, CH-1196 Gland, Switzerland. 18 Environment Laboratories, International Atomic Energy Agency, 4a Quai Antoine 1er, MC-98000 Monaco, Principality of Monaco. 19 Program on Science, Technology, and Society, John F. Kennedy School of Government, Harvard University, 79 John F. Kennedy Street, Cambridge, MA 02138, USA. 20 Fisheries Economics Research Unit, University of British Columbia, Vancouver, BC V6T 1Z4, Canada. 21 Plymouth Marine Laboratory, Prospect Place, The Hoe, Plymouth PL1 3DH, UK. *Corresponding author. E-mail: gattuso@obs-vlfr.fr
- 3. over glacial-interglacial time scales (14–16). Var- iability of pH in coastal waters is considerably larger than that in the open ocean, partly driven by upwelling (17), freshwater input (18), eutroph- ication (19) and biogeochemical processes (20). Anthropogenictrendsinbiogeochemicalvariables— notably in pH, PCO2, and the saturation of calcite and aragonite—emerge from the noise of natural variability much faster than sea surface temper- ature (SST) (21). The combined changes in these parameters will be distinguishable from natural fluctuations in 41% of the global ocean within a decade (22), and the change in aragonite satu- ration over the industrial period has been more than five times greater than natural variability over the past millennium in many regions (15). The condition of the future ocean depends on the amount of carbon emitted in the coming dec- ades (Figs. 1 and 2A). The current suite of earth system models illustrate the contrast between future oceans under the high-carbon-emission, business-as-usual RCP8.5 versus the stringent emission-mitigation RCP2.6 (23, 24). The more stringent scenario allows less than one-sixth of 21st century emissions expected under business- as-usual. Between 2012 and 2100, compatible aac4722-2 3 JULY 2015 • VOL 349 ISSUE 6243 sciencemag.org SCIENCE 20001960 RCP2.6 RCP8.5 2040 2080 20001960 2040 2080 0 0.4 0.6 0.8 0.2 1 10 20 (%) (m) 0 1 2 3 -1 4(°C) -0.3 -0.2 -0.1 0 0 -1 -2 -3 -4 -0.4 0.1 1 2 0 (%) (pH unit) (%) > a a A SST B Sea level C Surface pH E Oxygen content D Ocean volume with aragonite saturation >1 3 Change in pH (units)Change in SST (°C) -0.4-2-4 0 42 -0.5 -0.2 -0.1 0-0.3 F SST-RCP 8.5 H pH-RCP 8.5 G SST-RCP 2.6 I pH-RCP 2.6 Fig. 1. Environmental changes over the industrial period and the 21st century for a business-as-usual scenario and a stringent emissions scenario consistent with the UNFCCC target of increase in global surface temperature by 2°C. (A to E) Changes in globally averaged (A) SST, (B) sea level, (C) sea surface pH (total pH scale), (D) ocean volume (in % of total ocean volume) with saturation state of calcium carbonate in aragonitic form (Wa) above 1 and above 3, and (E) dissolved oxygen. RCP8.5, red lines; RCP2.6, blue lines. Maps show the 21st century changes in SST (F and G) and in sea surface pH (H and I) for RCP8.5 (top) and RCP2.6 (bottom), respectively. All projected values represent ensemble mean values from the Coupled Model Intercomparison Project 5 [CMIP5 (23)]. Table 1. Changes in SST, pH, oxygen content, sea level, and ocean volume with respect to ara- gonite for CMIP5 models and several RCP emissions scenarios. After Bopp et al. (23) except sea level rise (28). DSST (°C) DpH (units) DO2 content (%) Sea level (m) Vol. Wa >1 (%) Vol. Wa >3 (%) Changes relative to 1990–1999..................................................................................................................................................................................................................... 2090–2099 (RCP8.5) 2.73 –0.33 –3.48 0.67 9.4 0..................................................................................................................................................................................................................... 2090–2099 (RCP4.5) 1.28 –0.15 –2.37 0.49 15 0.57..................................................................................................................................................................................................................... 2090–2099 (RCP2.6) 0.71 –0.07 –1.81 0.41 17.3 1.22..................................................................................................................................................................................................................... 1990s (1990–1999) 0 0 0 0 24 1.82..................................................................................................................................................................................................................... Preindustrial (1870–1899) –0.44 0.07 – – 25.6 2.61..................................................................................................................................................................................................................... Preindustrial (1870–1879) –0.38 0.07 – – 25.6 2.67..................................................................................................................................................................................................................... Changes relative to 1870–1899 (except sea level, relative to 1901)..................................................................................................................................................................................................................... 2090–2099 (RCP8.5) 3.17 –0.40 – 0.86 – –..................................................................................................................................................................................................................... 2090–2099 (RCP4.5) 1.72 –0.22 – 0.68 – –..................................................................................................................................................................................................................... 2090–2099 (RCP2.6) 1.15 –0.14 – 0.60 – –..................................................................................................................................................................................................................... 2010s (2010–2019) 0.83 –0.11 – – – –..................................................................................................................................................................................................................... Past 10 years (2005–2014) 0.72 –0.10 – 0.19* – –..................................................................................................................................................................................................................... 1990s (1990–1999) 0.44 –0.07 – – – –..................................................................................................................................................................................................................... Preindustrial (1870–1899) 0 0 – 0 – –..................................................................................................................................................................................................................... *Value for 2010 obtained from instrumental records. RESEARCH | REVIEW
- 4. cumulative carbon emissions from fossil fuel use are 1685 gigatons of carbon (GtC) and 270 GtC for the two RCPs, respectively (10, 25). This is in addition to the 375 and 180 GtC already emitted by 2011 by fossil fuel and land use, respectively (25). Because carbon emissions were 10 GtC in 2013 (26), fast and massive emission reductions are required to keep global surface temperature below the 2°C target of the Copenhagen Accord. Carbon emissions would need to be even lower if the ocean absorbs less excess CO2 than is cur- rently predicted. Indeed, the ocean’s effective- ness in absorbing CO2 decreases with increasing emissions: the fraction of anthropogenic emis- sions absorbed by the ocean in the 21st century is projected to decline from 56% for RCP2.6 to 22% for RCP8.5 (27). Ocean physics and chemistry will be quite dif- ferent under these two emissions scenarios, al- though differences between the two trajectories will not be apparent until 2035. In 2100, the ocean will be much warmer and have a lower pH under RCP8.5 than under RCP2.6 (Fig. 1): The 21st century global mean change in SST differs by nearly a factor of 4 (mean ± 1 SD: 2.73 ± 0.72°C versus 0.71 ± 0.45°C), whereas global surface pH changes range from –0.33 ± 0.003 units to –0.07 ± 0.001 units). By 2100, the average global increase in mean sea level relative to preindust- rial is projected to be 0.86 m for RCP8.5 and0.60 m for RCP2.6 (28). By 2300, it will be less than 1 m for RCP2.6 and from 1 to over 3 m for RCP8.5 (10). Generally, an increase in stratification, linked to sea-surface warming and freshening, is pro- jected; this tends to slow ocean carbon uptake and nutrient supply to the surface (29). CO2 emissions also affect the deep ocean, al- though the responses are delayed by the surface- to-deep transport time and continue for centuries even after carbon emissions cease (30). The vol- ume of ocean water that is supersaturated by more than a factor of 3 with respect to aragonite (Wa > 3) is projected to completely vanish over the course of the century for RCP8.5 and to de- crease from 2% to 1.25% of the ocean volume for RCP2.6 (Fig. 1 and Table 1). Conversely, the vol- ume occupied by undersaturated water (Wa < 1) that is corrosive to unprotected calcium carbon- ate shells and skeletons expands from 76% of the whole ocean volume in the 1990s to 91% in 2100 with RCP8.5 and to only 83% with RCP2.6. The whole ocean oxygen inventory is consistently pro- jected to decrease (RCP8.5: –3.45 ± 0.44%; RCP2.6: –1.81 ± 0.31%) with largest changes in the subsurface mid-latitude regions. However, it remains unclear whether, and to what extent, low-oxygen regions will expand and whether the observed expansion of oxygen minimum zones over recent decades resulted from direct anthro- pogenic perturbation or was caused by natural variability (31, 32). Projections of ocean warming and acidifica- tion in coastal systems follow the general trends of global and regional IPCC models but have lower confidence values because of larger contributions of processes other than CO2 uptake (3). Projected regional changes vary, with the largest sea-surface warming in the North Pacific, the tropical East Pacific, and in parts of the Arctic and the largest surface pH decrease in the Arctic (Figs. 1 and 3). By 2100, 69% of the surface ocean will warm by more than 1.5°C and acidify by more than –0.2 pH units relative to preindustrial under RCP8.5 as opposed to less than 1% under RCP2.6 (Fig. 3). The largest absolute decrease in aragonite satu- ration is projected for the tropical ocean, partly modulated by variability within coral reef sites (33, 34). Seasonally undersaturated conditions are already present in the northeastern Pacific and the California upwelling system (17) and in the Arctic Ocean (35) and expected for the Southern Ocean (36). pH reductions at the sea floor below 500-m depth, which includes biodiversity hot spots such as deep-sea canyons and seamounts, are SCIENCE sciencemag.org 3 JULY 2015 • VOL 349 ISSUE 6243 aac4722-3 sea surface pH sea surface temperature 1 2 3 0 4 2015 2000 1985 1970 ChangeinseasurfacepH (unitsrelativeto1870-1879) RCP8.5 RCP4.5 RCP8.5 RCP4.5 RCP2.6 RCP8.5 RCP4.5 RCP2.6 RCP2.6 Present day (2005-2014) Undetectable Moderate High Very high Risk of impact Confidence levels for present-day and the 3 RCPs Ecosystem services Cumulative fossil fuel emissions since 1850 (GtC) Coastal and marine organisms very low 1* 2* 3* medium 4* 5* low high very high Fin fish Recreational services from coral reefs Bivalve fisheries & aquaculture (mid lat.) Coastal protec- tion Open ocean carbon uptake Fin fish fisheries (low lat.) Fin fish fisheries (mid & high lat.) Krill (high lat.) Pteropods (high lat.) Bivalves (mid lat.) Seagrass (mid lat.) Mangroves Warm- water corals Changes in the global average of Global average sea surface temperature and pH at present and in 2100 according to the 3 RCPs 0 1 2 3 4 500 1000 1500 25002000 68% confidence interval 378 420 538 936 AtmosphericCO2concentration(ppm) Present day RCP8.5 RCP4.5 RCP2.6 2* 2* 4* 4* 4* 4* 4* 5* 4* 5* 2* 3* 2* 2* 3* 3* 3* 3* 4* 3* 3* 3* 4* 4* 4* 4* 5* 4* 3* 3* 4* 3* 2* 2* 2* 3* 3* 2* 4* 4* 3* 2* 4* 4* 4* 4* 4* 4* 4* 4* 5* 5* RCP8.5 RCP4.5 RCP2.6 Present day A B C 0 -0.5 -0.4 -0.3 -0.2 -0.1 Changeinseasurfacetemperature (°Crelativeto1870-1879) Fig. 2. Observed impact and risk scenarios of ocean warming and acid- ification for important organisms and critical ecosystem services. “Present- day” (gray dotted line) corresponds to the period from 2005 to 2014. Impact levels are for the year 2100 under the different projections shown and do not consider genetic adaptation, acclimatization, or human risk reduction strategies (mitigation and societal adaptation). RCP4.5 is shown for illustrative pur- poses as an intermediate scenario between the business-as-usual high- emissions scenario (RCP8.5) and the stringent reduction scenario (RCP2.6). (A) Changes in global average SSTand pH versus cumulative fossil fuel emis- sions. Realized fossil emissions (26) are indicated for different years below the horizontal axis, whereas the lines are based on allowable emissions estimated from ensemble means of the CMIP5 simulations for the industrial period and the 21st century following RCP2.6, RCP4.5, and RCP8.5 (23). Cumulative emis- sion of 1000 GtC causes a global SSTchange of about 1.7°C and a surface pH change of about –0.22 units.The colored shadings indicate the 68% confidence interval for pH (gray) and SST (pink) from observation-constrained, proba- bilistic projections using 55 multi–gas emissions scenarios (24). (B) Risk of impacts resulting from elevated CO2 on key organisms that are well documented in the literature. (C) Risk of impacts resulting from elevated CO2 on critical ecosystem services. The levels of confidence in the risk levels synthesize the author team’s judgments (see materials and methods) about the validity of findings as determined through evaluation of evidence and agreement (157). RESEARCH | REVIEW
- 5. projected to exceed 0.2 units (the likely bound of natural variability over the past hundreds of thou- sands of years) by 2100 in close to 23% of North Atlantic deep-sea canyons and 8% of seamounts under RCP8.5—including sites proposed as ma- rine protected areas (37). In summary, the carbon that we emit today will change the earth system irreversibly for many generations to come (10). The ocean’s content of carbon, acidity, and heat as well as sea level will continue to increase long after atmospheric CO2 is stabilized. These irreversible changes increase with increasing emissions (Fig. 2), underscoring the urgency of near-term carbon emission reduction if ocean warming and acidification are to be kept at moderate levels. Effects on biological processes and ecosystems Organisms and ecosystemsarechanginginresponse to ocean warming, acidification, and deoxygena- tion. The inherent difficulty of distinguishing cli- mate signals from natural variability (38), and of accountingforgeneticadaptation(39),makesdocu- menting these shifts challenging, but nevertheless broad anthropogenic impacts are evident (Figs. 2B and 3). Warming Species’ range shifts, usually following a shift in isotherms or temperature extremes, are a key con- sequence of ocean warming (40). Recent studies strongly reiterate that many species—including various invertebrates, commercially important fish species, and marine mammals—are under- going phenological and geographical shifts as a result of warming (41, 42). Organisms move at different rates, up to 400 km per decade, as they track temperature changes and local climate veloc- ities according to their ecological niches (43, 44). These shifts will continue with projected ocean warming (42, 45), causing potentially permanent changes to ecosystems, including local extinc- tions (42), while simultaneously producing novel assemblages (46). Responses to changing temper- ature depend on species’ specific windows of thermal tolerance and are positively related to the degree of warming. Exceeding these limits can affect growth, body size, behavior, immune defense, feeding, and reproductive success (2), although species’ individual tolerances vary. Glob- ally, poleward range shifts of more than 800 spe- cies of exploited marine fish and invertebrates projected under RCP8.5 are 65% faster than those under RCP2.6 by mid–21st century relative to the years 2000s (42). There is medium confi- dence that animals adapted to a wide range of temperatures will cope better with future con- ditions, whereas tropical and polar specialists are at greatest risk (2). Changes are not syn- chronous across trophic levels; alterations in body sizes within food webs (47) and in food web composition (48) have been reported. Recent experimental studies suggest that some species may adapt to warming projected under RCP8.5 [e.g., (49, 50)], but biogeographical shifts re- strict adaptive potential and the small number aac4722-4 3 JULY 2015 • VOL 349 ISSUE 6243 sciencemag.org SCIENCE Saturation horizon shoals reducing biological calcification and altering plankton communities. (High) Mass coral bleaching and mortality, decline in growth rates of some corals leading to degradation of coral reefs and loss of associated biodiversity. (Very high) Spread of tropical species originating from Indian and Atlantic Oceans. Increased frequency of mass mortality events of benthic plants and animals. (High) Upwelling, hence productivity, changes. (Low) High latitudes experience early ocean acidification altering pelagic and benthic ecosystems. (High) Northward expansion of plankton, invertebrate and fish communities. Increase in fish biomass at high latitude fringes. (High) Expansion of low-productivity areas. (Low) Examples of risks of impacts in ocean regions 1 2 3 4 5 6 7 Warming leads to decline in primary production and fish catch. (Low) Examples of risks of impacts to fisheries Acidification of seasonally upwelling waters impacts shellfish aquaculture. (Medium) Increased fish catches at high latitude with economic disruptions and jurisdictional tensions as some fish stocks shift distributions. (Medium) Reduced dissolved oxygen with impacts on fish stocks. (Medium) Sea level rise modifies coast- lines and increases flooding, challenging aquaculture such as shrimp farms. (Medium) Shifts in stocks of large pelagic fish create winners and losers among country and island economies. (High) Degradation of coral reefs and associated fish stocks as the extent and intensity of mass coral bleaching and mortality increases, increasing risks to regional food security. (High) Increase in variability of upwelling in some EBUEs adds uncertainty to fisheries management. (Medium) Ocean regionsProjected changes in ocean temperature and pH (2090-2099 relative to 1890-1899) pH < -0.2 units SST > +1.5°C RCP2.6&8.5 RCP8.5 never RCP2.6 & 8.5 RCP8.5 never Coastal boundary systems Eastern boundary upwelling systems High-latitude spring bloom systems Semi-enclosed seas Equatorial upwelling systems Subtropical gyres Polar systems A B G C D F E H 2 G H H D F C C B B E A 3 3 4 5 6 6 7 1 6 6 Fig. 3. Regional changes in the physical system and associated risks for natural and human- managed systems. Projected changes in SST (DSST) and pH (DpH) in 2090–2099 relative to pre- industrial under the RCP2.6 and RCP8.5 scenarios are displayed in different colors on the map.The major ocean regions are indicated as well as examples of risks for natural systems and fisheries [modified from (1)].Text in parentheses specifies the level of confidence (157). RESEARCH | REVIEW
- 6. of species- and population-scale studies limit the ability to generalize the importance of genetic adaptation in moderating impacts. Reef-building corals are extremely vulnerable to warming (1, 2, 51). Warming causes mass mor- tality of warm-water corals through bleaching as well as through biotic diseases, resulting in declines in coral abundance and biodiversity. Coral reefs can recover from bleaching events when thermal stress is minimal and of short duration (52). However, ocean warming and acid- ification are expected to act synergistically to push corals and coral reefs into conditions that are unfavorable for coral reef ecosystems (53). There is limited agreement and low confidence on the potential for corals to adapt to rapid warming. Most coral species have clearly adapted to warm environments (54, 55) although the time scale of adaptation is likely to be long given the relatively lengthy generation times of corals [3 to 100 years (56)]. Recent studies have shown short-term ac- climation and adaptation in some fast-growing species (57) and suggested that some genetic mechanisms may allow faster rates of change (58). It is, however, doubtful that corals will be able to adapt quickly enough to maintain popu- lations under most emissions scenarios (56, 59, 60), especially where temperature keeps increasing over time (RCP4.5 and higher). Temperature is also an important determinant of deep-sea coral distribution, although less is known about how deep coral communities respond to thermal stress (61). The consensus is that adaptive responses of organisms will have little chance to keep current ecosystems unchanged if ocean temperature and chemistry are not stabilized, giving marine eco- systems the time needed to adapt to the new, stable environmental conditions. Ocean acidification Organisms producing calcium carbonate shells and skeletons experience the strongest negative impacts from ocean acidification (62). Responses to future levels of ocean acidification expected by 2100 under RCP8.5 include reduced calcification, reduced rates of repair, and weakened calcified structures, but responses are species-specific [e.g., (63)]. Reproductive success, early life-stage sur- vival, feeding rate, and stress-response mecha- nisms may also be affected (2). Most studies have investigated the effects of ocean acidification on isolated organisms; far less is known about the effects on communities and ecosystems. Few studies measure present-day acidification effects in natural settings. However, recent field observations show a decrease in coccolith thick- ness over the past 12 years in the Mediterranean (64) and dissolution of live pteropod shells in the California Current system and Southern Ocean, both areas that experience significant anthropo- genic acidification (65, 66). Recent investigations have also begun to report community-level re- sponses, for example, in phytoplanktonic (67, 68), bacterial (69), seagrass (70), and algal (71) com- munities. Decreases in net calcification, at least partly because of ocean acidification, have also been observed in a coral reef over 1975 to 2008 (72), and conditions are already shifting some coral reefs to net erosion (73). Most studies have investigated phenotypically plastic responses in relatively short-term, single- generation experiments and therefore did not consider the potential for transgenerational re- sponse and genetic adaptation (74). Studies published since the AR5 have expanded on the longer-term responses to ocean acidification and have found that transgenerational and evolution- ary responses can partly mitigate adverse effects, for example, in phytoplankton (75), planktonic crustaceans (76), sea urchins (77), and fish (78). Deoxygenation Expanding oxygen minimum zones benefits mi- crobes and life forms adapted to hypoxia while restricting the ranges of most other species (2), with eutrophication from coastal pollution exac- erbating the problem, resulting in organic matter increasing metabolic rates in deeper coastal areas (79). Moreover, higher temperatures increase spe- cies’ sensitivity to hypoxia (80), limiting the depth distribution of fish and invertebrates not adapted to hypoxic conditions (81) and leading to commu- nity-level shifts to smaller Eukarya, Bacteria, and Archaea under conditions of diminished O2 (82). Conversely, hypoxia-adapted species are likely to benefit, as illustrated by the range-expansionof a squid adapted to hypoxia (83). Multiple drivers Investigations of single drivers can produce mis- leading inferences about organismal responses in a multivariate natural environment because interactive (additive, synergistic, or antagonistic) effects often are not predictable from single- driver studies. This is a major source of uncer- tainty for projections (39), but several recent studies have better characterized interactions among some drivers. Changes in temperature and pH, such as those projected under RCP8.5 for the year 2100, can have synergistic negative effects on species growth, survival, fitness, calcifi- cation, and development (84–88). In some cases, hypoxic conditions can mediate negative effects of ocean acidification (89, 90); however, ocean acidification and hypoxia increase heat sensitiv- ity and vice versa (2), and oxygen loss combined with warming is projected to contract metabol- ically viable habitats of marine animals on a glob- al scale (91). Growing evidence also suggests that interactionswithotherenvironmentalfactors—such as irradiance, nutrient availability, geographic lo- cation, and species community composition—can strongly modulate the biological effects of warm- ing, ocean acidification, and hypoxia (68, 92–95). Few studies addressed the potential for genetic adaptation to multiple drivers, but the phyto- plankton Emiliania huxleyi can adapt to simul- taneous warming and acidification (49). Other direct human impacts (such as fishing) can re- duce the adaptive capacity of marine species and ecosystems to CO2-related impacts. For example, fishing reduces species diversity, simplifies the trophic food web, and increases ecosystem sensi- tivity to climate change (96). Because relatively little is known on the interacting effects of environ- mental factors and the complexity of the marine food web, it is premature to make ecosystem-wide projections. However, impacts on keystone spe- cies and ecosystem engineers of three-dimensional habitats are likely to shift whole communities (97). Present-day impact and future risks The observed impacts and future additional risks resulting from ocean warming and acidification vary by organism and ecosystem (Fig. 2B). Warm- water corals are already affected, as are mid- latitude seagrass, high-latitude pteropods and krill, mid-latitude bivalves, and finfish. If CO2 levels are kept to the RCP2.6 scenario, by 2100 the risk of impact increases to “high” for warm- water corals and mid-latitude bivalves. Projec- tions with RCP8.5 indicate very high risk of impact on most marine organisms considered, except mangrove. Avoiding very high levels of risk re- quires limiting the increase in global surface tem- perature between 1990 and 2100 to below 2°C and the increase in SST below ~1.2°C. These risks of impact, based on perturbation experiments, field observations, and modeling, are consistent with the paleorecord, which indicates mass ex- tinctions triggered by carbon perturbation events such as at the Permo-Triassic boundary [at a rate slower than the present one (98)] or severe losses of deep-sea fauna during the last glaciation, at- tributed to oxygen depletion (99). Evolution in response to environmental changes that occurred much slower than those projected in the coming decades did not, therefore, prevent major large- scale alterations of marine ecosystems. Levels of confidence are generally medium to very high for RCP2.6 but significantly lower for RCP8.5, except for seagrass, warm-water corals, and pteropods, for which they remain high or very high (see supplementary materials). Effects on ecosystem services and ocean-related human activities Ocean warming, acidification, and deoxygenation alter earth-system-regulating processes (e.g., cli- mate, heat distribution, weather, water flow, and waste treatment), habitat provision, and cultural services [e.g., recreation and leisure, inspiration, and cultural heritage (100)]. As a consequence, CO2-driven global change is expected to result in economic impacts for humans through the alter- ation of ocean-derived resources and increasing risks to public health, human development, well- being, and security (101). Ocean carbon uptake Ocean uptake of anthropogenic CO2 is a key ser- vice to society that moderates climate change, although it comes at the cost of ocean acidifica- tion. CO2 uptake depends on multiple processes, many of which are sensitive to climate change [see above (102)], and the open ocean is projected to absorb a decreasing fraction of anthropogenic CO2 emissions as those emissions increase. The fraction of 21st century emissions remaining in the atmosphere consequently increases from 30% for RCP2.6 to 69% for RCP8.5 (27). The SCIENCE sciencemag.org 3 JULY 2015 • VOL 349 ISSUE 6243 aac4722-5 RESEARCH | REVIEW
- 7. contribution of vegetated coastal ecosystems— including seagrasses, mangrove forests, and salt marshes—to contemporary carbon sequestration (103) is an order of magnitude less than that of the land biosphere and open ocean, and the coastal carbon sequestered is likely part of the natural carbon cycle rather than related to anthropogenic emissions. The projected loss of these habitats would not only reduce this rela- tively small uptake of CO2, but would also release carbon previously stored and thus exacerbate CO2-driven changes. Coastal protection Coastal habitats—including coral reefs, oyster beds, mangrove forests, salt marshes, kelp forests, and seagrass beds—protect human infrastructure, no- tably by reducing coastal wave energy, with addi- tional benefits, such as limitation of coastal erosion and marine inundation (104, 105). Nevertheless, the projected increases in coastal human settle- ments and sea level will combine to expose 0.2 to 4.6% of the global population to inundation annually at a cost to global gross domestic pro- duct of 0.3 to 9.3% (106). The value of coastal protection in terms of prevented damage can be very large. Coastal wetlands in the United States were estimated to provide U.S. $23.2 billion year−1 in storm protection services (107). In contrast to human infrastructure, natural habitats can grow to keep up with sea-level rise, depending on the rate and local conditions, while offering other eco- system services such as fish and timber (104, 108). These habitats are, however, themselves affected by ocean warming and acidification, in combi- nation with other human disturbances such as urbanization, deforestation, and dredging, making global projections difficult. Capture fisheries Ocean warming significantly affects provisioning services through its effects on marine capture fisheries (109). Warm-water species have increas- ingly dominated global fishery catches in recent decades, which can be attributed to a warming ocean (110–114). In addition, the maximum size of exploited fishes decreases with rising SST and decreasing oxygen level, ultimately reducing po- tential fish yield (115) in agreement with model predictions (111). Human communities, especially in developing nations, that depend heavily on coastal fisheries resources for food, economic security, and tradi- tional culture are at particular risk from shifts in ocean primary productivity and species ranges (116–120). For example, tropical fisheries yield is expected to decrease (42, 117, 121) in ways that vary among subregions and species (120). The loss of critical habitats, such as coral reefs and man- groves, will exacerbate the impacts on tropical fisheries and hence on vulnerable human com- munities. Substantial declines for tropical fish- eries are projected, with robust evidence and strong agreement, even under RCP2.6 by mid– 21st century. Arctic fisheries may benefit from increased pri- mary production, with projected revenue increas- ing by 14 to 59% by mid–21st century relative to the present day under a high-emissions scenario (118). Nevertheless, the Arctic faces increasing overall risk because it is a hot spot of ocean acidification and social vulnerability [includ- ing high economic and nutritional dependence on marine resources and limited employment and nutritional alternatives (118, 122)]. Risk of impact on mid-latitude fisheries is more varia- ble depending on the locations and exploited species, but it is expected to increase substan- tially under RCP8.5 because of the combination of ocean warming, acidification, and deoxyge- nation (2, 123, 124). Eventually, changes in the accessibility of marine resources will likely lead to increasing geopolitical and governance chal- lenges for managing trans-boundary stocks and mitigating overexploitation (125, 126), leading to additional economic and societal costs that will be felt unequally and will place heavier bur- dens on less-advantaged human communities. Aquaculture Climate and acidification-related impacts to aqua- culture are expected to be generally negative, with impacts varying by location, species, and aquacul- ture method. Farmed species at higher trophic levels are expected to exhibit higher mortality rates and lower productivity under warming, with open and semi-open aquaculture and those in the tropics particularly at risk (127, 128). A reduction of mussel production by 50 or 70% is projected in the United Kingdom under the RCP2.6 or RCP8.5 scenarios, respectively (127). Projected declines in oyster production resulting from warming are much lower, but ocean acidification increases the risk in upwelling areas, such as the Northeast Pacific (129). The global economic cost of losses in the capture and aquaculture of molluscs re- sulting from ocean acidification based on the high-emissions scenario RCP8.5 could be higher than U.S. $100 billion by the year 2100 (130). Sea level rise will bring saline water into deltas and estuaries, where aquaculture commonly occurs (131), driving aquaculture upstream and destroy- ing wetlands. Infectious diseases also pose a greater threat to aquaculture in a warmer ocean, with impacts observed, for example, in oysters and abalone aquaculture (132) and coastal fish farm- ing (133). Risks are also generated by the in- creased mobility of invasive species (46). Tourism Decreases in the quality and abundance of coral reef cover are expected to negatively affect tourism (1, 3). Loss of coral reefs to tourism under the RCP2.6 and RCP8.5 scenarios could cost between U.S. $1.9 billion and U.S. $12 billion per year, respectively (134). Coral reef losses due to ocean warming and acidification on the Great Barrier Reef place up to A$5.7 billion and 69,000 jobs in Australia at risk (135). In addition, ocean acidif- ication may cause an annual loss of reef ecosys- tem services that are valued up to U.S. $1 trillion by 2100 (136). For about a quarter of countries with reef-related tourism, mainly less-developed countries, this kind of tourism accounts for more than 15% of gross domestic product (137) and is more sustainable than extractive livelihoods. Human health Ocean warming and acidification affect public health and security, although the impact path- ways and associated costs are poorly understood. Hosts and parasites are likely to undergo pole- ward range shifts under climate change, and dis- ease outbreaks of cholera (138) and other Vibrio infections (139) have already been linked to warmer conditions. The increased risk of pathogens and parasites in marine species and increased oppor- tunities for pathogen transfer between hosts (140) can reduce food security (141). Increasing inten- sity and frequency of storm surges and sea-level rise may expand the geographical and seasonal ranges of bacteria, increasing human exposure to diseases (132). Inundation can also flood agricul- tural land in coastal regions, jeopardizing food security and harming human health (142). Present-day impact and future risks The impacts of ocean acidification and warming have already been detected in some key eco- system services, such as coastal protection and capture fisheries (Figs. 2C and 3). The risks of impacts increase as a function of increased tem- perature and decreased pH but are still moderate by 2100 for most services with the RCP2.6 sce- nario. However, under RCP8.5, we find that the risks of impact will become high or very high by 2100 for all seven ecosystem services considered. Fin fisheries at low latitude will be affected sooner than other services; they will face very high risk at a CO2 level corresponding to RCP2.6 in 2100. In addition, cumulative or synergistic impacts with other human-induced drivers, such as over- exploitation of living resources, habitat destruc- tion, and pollution, will likely exacerbate the risk of CO2-related impacts. Management options Limiting the effects of ocean warming and acid- ification is critical considering the widespread risks of impacts facing natural and human sys- tems, even under a stringent emissions scenario (RCP2.6; Fig. 2). A growing body of literature presents options for action in response to climate change and ocean acidification (143–145). Draw- ing on Billé et al. (146), these actions can be clus- tered in four groups (Fig. 4): reducing the drivers of climate change and ocean acidification (mit- igate), building or maintaining resilience in eco- systems (protect), adapting human societies (adapt), and repairing damage that has already occurred (repair). At present, only one of these (reducing CO2 emissions) addresses the fundamental prob- lem; the others merely delay or decrease impacts (e.g., protecting reefs from major disturbances such as coral mining). Some actions rely on readi- ly available technologies (e.g., sewage treatment plants to reduce exacerbating effects of coastal nutrient pollution) and socioeconomic mecha- nisms (e.g., coastal setback zones), whereas more engineering-intensive techniques are being devel- oped and will require testing (e.g., removal of aac4722-6 3 JULY 2015 • VOL 349 ISSUE 6243 sciencemag.org SCIENCE RESEARCH | REVIEW
- 8. CO2 from the atmosphere). These options inter- act. For example, reducing secondary environmen- tal stressors so as to retain ecosystem resilience works over some range of PCO2 values but is ul- timately relevant only if ocean warming and acidification are drastically limited. One cannot manage coral reef resilience, for example, if there are no healthy reefs remaining (46). Importantly, some policy options are antagonistic: For exam- ple, solar radiation management could limit the increase of surface temperature but would reduce the incentive to cut greenhouse gases emissions, including CO2, thereby providing no relief from ocean acidification (147). A positive development is that a widening range of stakeholders are testing new practices or reviving old ones, including CO2 extraction from seawater (148), assisted evolution of corals (149), coral farming (150), and customary local management (151). Such field tests provide use- able information and tools for decision-makers and climate negotiators as to the costs, benefits, and timing of management options. Aquaculture, for example, has shown some potential to reduce the risk of impacts from climate change and ocean acidification through societal adaptation, such as improved monitoring and changing cultured species or farm locations (127, 152). However, the cost of adaptation measures—such as real- time monitoring of water chemistry—can be prohibitive and not within the reach of most aquaculture operations, especially those in the developing world. Ecosystem-based adaptation— or using ecosystems to reduce the vulnerability of people—appears to offer cost-efficient solu- tions bringing multiple co-benefits, especially for developing countries and marginalized commu- nities (153). Stimulating ecosystem resilience by reducing the number and magnitude of local stressors and setting up marine protected areas (154) with strictly enforced no-take areas and limited pollutant inputs also stand out as tract- able priorities. Moreover, some regions and local areas that are relatively less exposed to warming, hypoxia, and acidification could be climate change refugia, where more favorable environmental con- ditions would enable survival under CO2-driven impacts (155). Thus, identifying these climate change refugia and conserving biodiversity there contribute to building resilience to climate change (156). Nevertheless, all of these options require ap- propriate policy frameworks and financial com- mitments to cover transaction and opportunity costs, surveillance, and enforcement and moni- toring and likely offer only limited protection in the face of persistent climate change and ocean acidification. As the ocean warms and acidifies, the range of protection, adaptation, and repair options—and our confidence in those options—dwindles, while the cost of remaining options skyrockets. Lower- emissions scenarios such as RCP2.6 leave society with a greater number of effective options for safeguarding marine ecosystems and the services they provide. Therefore, actions that do not re- duce carbon emissions are meaningful ocean management options only if the future climate regime entails ambitious national contributions toward the phaseout of global CO2 emissions as well as a strong funding mechanism and a rele- vant framework to support on-the-ground imple- mentation of these options. Key messages Maintaining ocean ecosystems and services de- pends in large part on the negotiation process toward a global climate agreement under the UNFCCC. In this regard, four key messages emerge from our analysis. First, the ocean strongly in- fluences the climate system and provides impor- tant services to humans. Second, impacts on key marine and coastal organisms, ecosystems, and services from anthropogenic CO2 emissions are already detectable, and several will face high risk of impacts well before 2100, even with the strin- gent CO2 emissions scenario (RCP2.6). These im- pacts are occurring across all latitudes and have become a global concern that spans the tradi- tional north/south divide. Third, the analysis shows that immediate and substantial reduction of CO2 emissions is required in order to prevent the mas- sive and effectively irreversible impacts on ocean ecosystems and their services that are projected with emissions scenarios more severe than RCP2.6. Limiting emissions to below this level is neces- sary to meet UNFCCC's stated objectives. Man- agement options that overlook CO2, such as solar radiation management and control of methane emission, will only minimize impacts of ocean warming and not those of ocean acidification. Fourth, as CO2 increases, the protection, adapta- tion, and repair options for the ocean become fewer and less effective. Given the contrasting futures we have outlined here, the ocean provides further compelling ar- guments for rapid and rigorous CO2 emission reduction and eventual reduction of atmospheric CO2 content. As a result, any new global climate agreement that does not minimize the impacts on the ocean will be incomplete and inadequate. REFERENCES AND NOTES 1. O. Hoegh-Guldberg et al., “The ocean,” in Climate Change 2014: Impacts, Adaptation, and Vulnerability. Part B: Regional Aspects. Contribution of Working Group II to the Fifth Assessment Report of the Intergovernmental Panel on Climate Change, C. B. Field et al., Eds. (Cambridge Univ. Press, Cambridge, 2014), pp. 1655–1731. 2. H.-O. Pörtner et al., “Ocean systems,” in Climate Change 2014: Impacts, Adaptation, and Vulnerability. Part A: Global and Sectoral Aspects. Contribution of Working Group II to the Fifth Assessment Report of the Intergovernmental Panel on Climate Change, C. B. Field et al., Eds. (Cambridge Univ. Press, Cambridge, 2014), pp. 411–484. 3. P. P. Wong et al., “Coastal systems and low-lying areas,” in Climate Change 2014: Impacts, Adaptation, and Vulnerability. Part A: Global and Sectoral Aspects. Contribution of Working Group II to the Fifth Assessment Report of the Intergovernmental Panel on Climate Change, C. B. Field et al., Eds. (Cambridge Univ. Press, Cambridge, 2014), pp. 361–409. 4. C. Mora, D. P. Tittensor, S. Adl, A. G. Simpson, B. Worm, How many species are there on Earth and in the ocean? PLOS Biol. 9, e1001127 (2011). doi: 10.1371/journal.pbio.1001127; pmid: 21886479 SCIENCE sciencemag.org 3 JULY 2015 • VOL 349 ISSUE 6243 aac4722-7 Reduce coastal pollutants Reduce other environmental stressors Protect ecological refugia Develop MPAs networks Change practices Relocate activities Relocate species Migrate Use ecosystems to protect assets Build infrastructures to protect assets Limit [CO2]atm Limit GH effect Reduce CO2 emissions Remove CO2 Reduce other GHG emissions Manage solar radiations Take action Add alkaline material Assist evolution Restore degraded ecosystems RepairProtect Adapt Mitigate Fig. 4. Four clusters of actions against climate change, including ocean acidification. For each cluster, a nonexhaustive list of actions is shown. [CO2]atm is concentration of atmospheric CO2; GH, greenhouse; GHG, greenhouse gases; MPAs, marine protected areas. The mitigation pathway leading to CO2 reductions is represented in bold, consistent with the consensus view that significant reductions in CO2 emissions is presently the only actual “solution” to the ocean impacts of climate change and ocean acidification (see main text). RESEARCH | REVIEW
- 9. 5. Food and Agricultural Organization (FAO), The State of World Fisheries and Aquaculture 2014 (FAO, Rome, 2014). 6. United Nations, United Nations Framework Convention on Climate Change (United Nations, New York, 1992). 7. Copenhagen Accord, Decision 2/CP.15: Copenhagen Accord (UNFCCC, Geneva, 2009). 8. E. R. Harrould-Kolieb, D. Herr, Ocean acidification and climate change: Synergies and challenges of addressing both under the UNFCCC. Clim. Policy 12, 378–389 (2012). doi: 10.1080/14693062.2012.620788 9. IPCC, “Summary for policymakers,” in Climate Change 2014: Impacts, Adaptation and Vulnerability. Contribution of Working Group II to the Fifth Assessment Report of the Intergovernmental Panel on Climate Change, C. B. Field et al., Eds. (Cambridge Univ. Press, Cambridge, 2014), pp. 1–32. 10. T. F. Stocker et al., “Technical summary,” in Climate Change 2013: The Physical Science Basis. Contribution of Working Group I to the Fifth Assessment Report of the Intergovernmental Panel on Climate Change, T. F. Stocker et al., Eds. (Cambridge Univ. Press, Cambridge, 2013), pp. 33–115. 11. K. M. Strassmann, G. K. Plattner, F. Joos, CO2 and non-CO2 radiative forcings in climate projections for twenty-first century mitigation scenarios. Clim. Dyn. 33, 737–749 (2009). doi: 10.1007/s00382-008-0505-4 12. J.-P. Gattuso, L. Hansson, “Ocean acidification: Background and history,” in Ocean Acidification, J.-P. Gattuso, L. Hansson, Eds. (Oxford Univ. Press, Oxford, 2011), pp. 1–20. 13. L. A. Levin et al., Comparative biogeochemistry-ecosystem- human interactions on dynamic continental margins. J. Mar. Syst. 141, 3–17 (2015). doi: 10.1016/j.jmarsys.2014.04.016 14. D. Lüthi et al., High-resolution carbon dioxide concentration record 650,000-800,000 years before present. Nature 453, 379–382 (2008). doi: 10.1038/nature06949; pmid: 18480821 15. T. Friedrich et al., Detecting regional anthropogenic trends in ocean acidification against natural variability. Nat. Clim. Change 2, 167–171 (2012). doi: 10.1038/nclimate1372 16. F. Joos, R. Spahni, Rates of change in natural and anthropogenic radiative forcing over the past 20,000 years. Proc. Natl. Acad. Sci. U.S.A. 105, 1425–1430 (2008). doi: 10.1073/pnas.0707386105; pmid: 18252830 17. R. A. Feely, C. L. Sabine, J. M. Hernandez-Ayon, D. Ianson, B. Hales, Evidence for upwelling of corrosive “acidified” water onto the continental shelf. Science 320, 1490–1492 (2008). doi: 10.1126/science.1155676; pmid: 18497259 18. J. Salisbury, M. Green, C. Hunt, J. Campbell, Coastal acidification by rivers: A new threat to shellfish? Eos 89, 513 (2008). doi: 10.1029/2008EO500001 19. W.-J. Cai et al., Acidification of subsurface coastal waters enhanced by eutrophication. Nat. Geosci. 4, 766–770 (2011). doi: 10.1038/ngeo1297 20. A. V. Borges, N. Gypens, Carbonate chemistry in the coastal zone responds more strongly to eutrophication than to ocean acidification. Limnol. Oceanogr. 55, 346–353 (2010). doi: 10.4319/lo.2010.55.1.0346 21. K. M. Keller, F. Joos, C. C. Raible, Time of emergence of trends in ocean biogeochemistry. Biogeosciences 11, 3647–3659 (2014). doi: 10.5194/bg-11-3647-2014 22. K. B. Rodgers, J. Lin, T. L. Frölicher, Emergence of multiple ocean ecosystem drivers in a large ensemble suite with an Earth system model. Biogeosciences. 12, 3301–3320 (2015). doi: 10.5194/bg-12-3301-2015 23. L. Bopp et al., Multiple stressors of ocean ecosystems in the 21st century: Projections with CMIP5 models. Biogeosciences 10, 6225–6245 (2013). doi: 10.5194/bg-10-6225-2013 24. M. Steinacher, F. Joos, T. F. Stocker, Allowable carbon emissions lowered by multiple climate targets. Nature 499, 197–201 (2013). doi: 10.1038/nature12269; pmid: 23823728 25. P. Ciais et al., “Carbon and other biogeochemical cycles,” in Climate Change 2013: The Physical Science Basis. Contribution of Working Group I to the Fifth Assessment Report of the Intergovernmental Panel on Climate Change, T. F. Stocker et al., Eds. (Cambridge Univ. Press, Cambridge, 2013), pp. 465–570. 26. T. A. Boden, G. Marland, R. J. Andres, Global, Regional, and National Fossil-Fuel CO2 Emissions (Carbon Dioxide Information Analysis Center, Oak Ridge, TN, 2013). 27. C. Jones et al., Twenty-first-century compatible CO2 emissions and airborne fraction simulated by CMIP5 earth system models under four representative concentration pathways. J. Clim. 26, 4398–4413 (2013). 28. J. A. Church et al., “Sea level change,” in Climate Change 2013: The Physical Science Basis. Contribution of Working Group I to the Fifth Assessment Report of the Intergovernmental Panel on Climate Change, T. F. Stocker et al., Eds. (Cambridge Univ. Press, Cambridge, 2013), pp. 1137–1216. 29. T. Roy et al., Regional impacts of climate change and atmospheric CO2 on future ocean carbon uptake: A multimodel linear feedback analysis. J. Clim. 24, 2300–2318 (2011). doi: 10.1175/2010JCLI3787.1 30. T. L. Frölicher, F. Joos, Reversible and irreversible impacts of greenhouse gas emissions in multi-century projections with the NCAR global coupled carbon cycle-climate model. Clim. Dyn. 35, 1439–1459 (2010). doi: 10.1007/ s00382-009-0727-0 31. S. Emerson, S. Bushinsky, Oxygen oxygen concentrations and biological fluxes in the open ocean. Oceanography 27, 168–171 (2014). doi: 10.5670/oceanog.2014.20 32. V. Cocco et al., Oxygen and indicators of stress for marine life in multi-model global warming projections. Biogeosciences 10, 1849–1868 (2013). doi: 10.5194/bg-10-1849-2013 33. E. C. Shaw, B. I. McNeil, B. Tilbrook, R. Matear, M. L. Bates, Anthropogenic changes to seawater buffer capacity combined with natural reef metabolism induce extreme future coral reef CO2 conditions. Glob. Change Biol. 19, 1632–1641 (2013). doi: 10.1111/gcb.12154; pmid: 23505026 34. T. Cyronak, I. R. Santos, D. V. Erler, D. T. Maher, B. D. Eyre, Drivers of pCO2 variability in two contrasting coral reef lagoons: The influence of submarine groundwater discharge. Global Biogeochem. Cycles 28, 398–414 (2014). doi: 10.1002/ 2013GB004598 35. L. L. Robbins et al., Baseline monitoring of the western Arctic Ocean estimates 20% of Canadian basin surface waters are undersaturated with respect to aragonite. PLOS ONE 8, e73796 (2013). doi: 10.1371/journal.pone.0073796; pmid: 24040074 36. M. Mattsdotter Björk, A. Fransson, A. Torstensson, M. Chierici, Ocean acidification state in western Antarctic surface waters: Controls and interannual variability. Biogeosciences 11, 57–73 (2014). doi: 10.5194/bg-11-57-2014 37. M. Gehlen et al., Projected pH reductions by 2100 might put deep North Atlantic biodiversity at risk. Biogeosciences 11, 6955–6967 (2014). doi: 10.5194/bg-11-6955-2014 38. P. W. Boyd, S. T. Lennartz, D. M. Glover, S. C. Doney, Biological ramifications of climate-change-mediated oceanic multi-stressors. Nat. Clim. Change 5, 71–79 (2015). doi: 10.1038/nclimate2441 39. U. Riebesell, J.-P. Gattuso, Lessons learned from ocean acidification research. Nat. Clim. Change 5, 12–14 (2015). doi: 10.1038/nclimate2456 40. E. Poloczanska, O. Hoegh-Guldberg, W. Cheung, H.-O. Pörtner, M. T. Burrows, “Observed global responses of marine biogeography, abundance, and phenology to climate change,” in Climate Change 2014: Impacts, Adaptation, and Vulnerability. Part A: Global and Sectoral Aspects. Contribution of Working Group II to the Fifth Assessment Report of the Intergovernmental Panel on Climate Change, C. B. Field et al., Eds. (Cambridge Univ. Press, Cambridge, 2014), pp. 123–127. 41. L. E. Chambers et al., Phenological changes in the southern hemisphere. PLOS ONE 8, e75514 (2013). doi: 10.1371/ journal.pone.0075514; pmid: 24098389 42. M. C. Jones, W. W. L. Cheung, Multi-model ensemble projections of climate change effects on global marine biodiversity. ICES J. Mar. Sci. 72, 741–752 (2015). doi: 10.1093/icesjms/fsu172 43. M. L. Pinsky, B. Worm, M. J. Fogarty, J. L. Sarmiento, S. A. Levin, Marine taxa track local climate velocities. Science 341, 1239–1242 (2013). doi: 10.1126/ science.1239352; pmid: 24031017 44. J. G. Hiddink, M. T. Burrows, J. García Molinos, Temperature tracking by North Sea benthic invertebrates in response to climate change. Glob. Change Biol. 21, 117–129 (2015). doi: 10.1111/gcb.12726; pmid: 25179407 45. M. S. Wisz et al., Arctic warming will promote Atlantic–Pacific fish interchange. Nat. Clim. Change 5, 261–265 (2015). doi: 10.1038/nclimate2500 46. O. Hoegh-Guldberg, J. F. Bruno, The impact of climate change on the world’s marine ecosystems. Science 328, 1523–1528 (2010). doi: 10.1126/science.1189930; pmid: 20558709 47. J. P. Gibert, J. P. DeLong, Temperature alters food web body- size structure. Biol. Lett. 10, 20140473 (2014). doi: 10.1098/ rsbl.2014.0473; pmid: 25165457 48. A. Vergés et al., The tropicalization of temperate marine ecosystems: Climate-mediated changes in herbivory and community phase shifts. Proc. Biol. Sci. 281, 20140846 (2014). doi: 10.1098/rspb.2014.0846; pmid: 25009065 49. L. Schlüter et al., Adaptation of a globally important coccolithophore to ocean warming and acidification. Nat. Clim. Change 4, 1024–1030 (2014). doi: 10.1038/ nclimate2379 50. N. J. Muñoz, A. P. Farrell, J. W. Heath, B. D. Neff, Adaptive potential of a Pacific salmon challenged by climate change. Nat. Clim. Change 5, 163–166 (2015). doi: 10.1038/ nclimate2473 51. J.-P. Gattuso, O. Hoegh-Guldberg, H.-O. Pörtner, “Coral reefs,” in Climate Change 2014: Impacts, Adaptation, and Vulnerability. Part A: Global and Sectoral Aspects. Contribution of Working Group II to the Fifth Assessment Report of the Intergovernmental Panel on Climate Change, C. B. Field et al., Eds. (Cambridge Univ. Press, Cambridge, 2014), pp. 97–100. 52. N. A. Graham, S. Jennings, M. A. MacNeil, D. Mouillot, S. K. Wilson, Predicting climate-driven regime shifts versus rebound potential in coral reefs. Nature 518, 94–97 (2015). doi: 10.1038/nature14140; pmid: 25607371 53. O. Hoegh-Guldberg et al., Coral reefs under rapid climate change and ocean acidification. Science 318, 1737–1742 (2007). doi: 10.1126/science.1152509; pmid: 18079392 54. B. C. C. Hume et al., Symbiodinium thermophilum sp. nov., a thermotolerant symbiotic alga prevalent in corals of the world’s hottest sea, the Persian/Arabian Gulf. Sci. Rep. 5, 8562 (2015). doi: 10.1038/srep08562; pmid: 25720577 55. R. N. Silverstein, R. Cunning, A. C. Baker, Change in algal symbiont communities after bleaching, not prior heat exposure, increases heat tolerance of reef corals. Glob. Change Biol. 21, 236–249 (2015). doi: 10.1111/ gcb.12706; pmid: 25099991 56. O. Hoegh-Guldberg, The adaptation of coral reefs to climate change: Is the Red Queen being outpaced? Sci. Mar. 76, 403–408 (2012). doi: 10.3989/scimar.03660.29A 57. S. R. Palumbi, D. J. Barshis, N. Traylor-Knowles, R. A. Bay, Mechanisms of reef coral resistance to future climate change. Science 344, 895–898 (2014). pmid: 24762535 58. M. Schweinsberg, L. C. Weiss, S. Striewski, R. Tollrian, K. P. Lampert, More than one genotype: How common is intracolonial genetic variability in scleractinian corals? Mol. Ecol. 24, 2673–2685 (2015). doi: 10.1111/mec.13200; pmid: 25872099 59. C. A. Logan, J. P. Dunne, C. M. Eakin, S. D. Donner, Incorporating adaptive responses into future projections of coral bleaching. Glob. Change Biol. 20, 125–139 (2014). doi: 10.1111/gcb.12390; pmid: 24038982 60. C. M. Eakin, Lamarck was partially right—and that is good for corals. Science 344, 798–799 (2014). doi: 10.1126/ science.1254136; pmid: 24855237 61. J. M. Roberts, A. J. Wheeler, A. Freiwald, Reefs of the deep: The biology and geology of cold-water coral ecosystems. Science 312, 543–547 (2006). doi: 10.1126/science.1119861; pmid: 16645087 62. J.-P. Gattuso et al., “Ocean acidification: Background and history,” in Ocean Acidification, C. B. Field et al., Eds. (Cambridge Univ. Press, Cambridge, 2014), pp. 129–131. 63. J. Meyer, U. Riebesell, Reviews and Syntheses: Responses of coccolithophores to ocean acidification: A meta-analysis. Biogeosciences 12, 1671–1682 (2015). doi: 10.5194/ bg-12-1671-2015 64. K. J. S. Meier, L. Beaufort, S. Heussner, P. Ziveri, The role of ocean acidification in Emiliania huxleyi coccolith thinning in the Mediterranean Sea. Biogeosciences 11, 2857–2869 (2014). doi: 10.5194/bg-11-2857-2014 65. N. Bednaršek, G. A. Tarling, D. C. E. Bakker, S. Fielding, R. A. Feely, Dissolution dominating calcification process in polar pteropods close to the point of aragonite undersaturation. PLOS ONE 9, e109183 (2014). doi: 10.1371/journal.pone.0109183; pmid: 25285916 66. N. Bednaršek et al., Extensive dissolution of live pteropods in the Southern Ocean. Nat. Geosci. 5, 881–885 (2012). doi: 10.1038/ngeo1635 67. U. Riebesell, J.-P. Gattuso, T. F. Thingstad, J. J. Middelburg, Arctic ocean acidification: Pelagic ecosystem and biogeochemical responses during a mesocosm study. Biogeosciences 10, 5619–5626 (2013). doi: 10.5194/ bg-10-5619-2013 68. S. Richier et al., Phytoplankton responses and associated carbon cycling during shipboard carbonate chemistry aac4722-8 3 JULY 2015 • VOL 349 ISSUE 6243 sciencemag.org SCIENCE RESEARCH | REVIEW
- 10. manipulation experiments conducted around Northwest European shelf seas. Biogeosciences 11, 4733–4752 (2014). doi: 10.5194/bg-11-4733-2014 69. S. Endres, L. Galgani, U. Riebesell, K. G. Schulz, A. Engel, Stimulated bacterial growth under elevated pCO₂: Results from an off-shore mesocosm study. PLOS ONE 9, e99228 (2014). doi: 10.1371/journal.pone.0099228; pmid: 24941307 70. S. L. Garrard et al., Indirect effects may buffer negative responses of seagrass invertebrate communities to ocean acidification. J. Exp. Mar. Biol. Ecol. 461, 31–38 (2014). doi: 10.1016/j.jembe.2014.07.011 71. A. Ordoñez, C. Doropoulos, G. Diaz-Pulido, Effects of ocean acidification on population dynamics and community structure of crustose coralline algae. Biol. Bull. 226, 255–268 (2014). pmid: 25070869 72. J. Silverman et al., Community calcification in Lizard Island, Great Barrier Reef: A 33 year perspective. Geochim. Cosmochim. Acta 144, 72–81 (2014). doi: 10.1016/ j.gca.2014.09.011 73. N. J. Silbiger, Ò. Guadayol, F. I. M. Thomas, M. J. Donahue, Reefs shift from net accretion to net erosion along a natural environmental gradient. Mar. Ecol. Prog. Ser. 515, 33–44 (2014). doi: 10.3354/meps10999 74. J. M. Sunday et al., Evolution in an acidifying ocean. Trends Ecol. Evol. 29, 117–125 (2014). doi: 10.1016/j. tree.2013.11.001; pmid: 24355315 75. K. T. Lohbeck, U. Riebesell, T. B. H. Reusch, Gene expression changes in the coccolithophore Emiliania huxleyi after 500 generations of selection to ocean acidification. Proc. R. Soc. London Ser. B 281, 20140003–20140003 (2014). doi: 10.1098/rspb.2014.0003; pmid: 24827439 76. P. Thor, S. Dupont, Transgenerational effects alleviate severe fecundity loss during ocean acidification in a ubiquitous planktonic copepod. Glob. Change Biol. 21, 2261–2271 (2015). doi: 10.1111/gcb.12815; pmid: 25430823 77. C. C. Suckling et al., Experimental influence of pH on the early life-stages of sea urchins II: Increasing parental exposure times gives rise to different responses. Invertebr. Reprod. Dev. 58, 161–175 (2014). doi: 10.1080/ 07924259.2013.875951 78. P. L. Munday, Transgenerational acclimation of fishes to climate change and ocean acidification. F1000Prime Rep. 6, 99 (2014). doi: 10.12703/P6-99; pmid: 25580253 79. R. J. Diaz, R. Rosenberg, Spreading dead zones and consequences for marine ecosystems. Science 321, 926–929 (2008). doi: 10.1126/science.1156401; pmid: 18703733 80. H.-O. Pörtner, Oxygen- and capacity-limitation of thermal tolerance: A matrix for integrating climate-related stressor effects in marine ecosystems. J. Exp. Biol. 213, 881–893 (2010). doi: 10.1242/jeb.037523; pmid: 20190113 81. A. Brown, S. Thatje, The effects of changing climate on faunal depth distributions determine winners and losers. Glob. Change Biol. 21, 173–180 (2015). doi: 10.1111/ gcb.12680; pmid: 25044552 82. D. Storch, L. Menzel, S. Frickenhaus, H.-O. Pörtner, Climate sensitivity across marine domains of life: Limits to evolutionary adaptation shape species interactions. Glob. Change Biol. 20, 3059–3067 (2014). doi: 10.1111/ gcb.12645; pmid: 24890266 83. J. S. Stewart et al., Combined climate- and prey-mediated range expansion of Humboldt squid (Dosidicus gigas), a large marine predator in the California Current System. Glob. Change Biol. 20, 1832–1843 (2014). doi: 10.1111/ gcb.12502; pmid: 24443361 84. J. D. Gaitán-Espitia et al., Interactive effects of elevated temperature and pCO2 on early-life-history stages of the giant kelp Macrocystis pyrifera. J. Exp. Mar. Biol. Ecol. 457, 51–58 (2014). doi: 10.1016/j.jembe.2014.03.018 85. C. J. Gobler, E. L. DePasquale, A. W. Griffith, H. Baumann, Hypoxia and acidification have additive and synergistic negative effects on the growth, survival, and metamorphosis of early life stage bivalves. PLOS ONE 9, e83648 (2014). doi: 10.1371/journal.pone.0083648; pmid: 24416169 86. C. L. Mackenzie et al., Ocean warming, more than acidification, reduces shell strength in a commercial shellfish species during food limitation. PLOS ONE 9, e86764 (2014). doi: 10.1371/journal.pone.0086764; pmid: 24489785 87. D. Madeira, L. Narciso, M. S. Diniz, C. Vinagre, Synergy of environmental variables alters the thermal window and heat shock response: An experimental test with the crab Pachygrapsus marmoratus. Mar. Environ. Res. 98, 21–28 (2014). doi: 10.1016/j.marenvres.2014.03.011; pmid: 24836643 88. R. Rosa et al., Differential impacts of ocean acidification and warming on winter and summer progeny of a coastal squid (Loligo vulgaris). J. Exp. Biol. 217, 518–525 (2014). doi: 10.1242/jeb.096081; pmid: 24523499 89. C. A. Frieder, J. P. Gonzalez, E. E. Bockmon, M. O. Navarro, L. A. Levin, Can variable pH and low oxygen moderate ocean acidification outcomes for mussel larvae? Glob. Change Biol. 20, 754–764 (2014). doi: 10.1111/gcb.12485; pmid: 24343909 90. J. Mukherjee et al., Proteomic response of marine invertebrate larvae to ocean acidification and hypoxia during metamorphosis and calcification. J. Exp. Biol. 216, 4580–4589 (2013). doi: 10.1242/jeb.094516; pmid: 24307710 91. C. Deutsch, A. Ferrel, B. Seibel, H.-O. Pörtner, R. B. Huey, Climate change tightens a metabolic constraint on marine habitats. Science 348, 1132–1135 (2015). doi: 10.1126/science.aaa1605 92. S. Comeau, R. C. Carpenter, P. J. Edmunds, Effects of irradiance on the response of the coral Acropora pulchra and the calcifying alga Hydrolithon reinboldii to temperature elevation and ocean acidification. J. Exp. Mar. Biol. Ecol. 453, 28–35 (2014). doi: 10.1016/j.jembe.2013.12.013 93. C. J. Hoppe et al., Iron limitation modulates ocean acidification effects on southern ocean phytoplankton communities. PLOS ONE 8, e79890 (2013). doi: 10.1371/ journal.pone.0079890; pmid: 24278207 94. G. W. K. Ko et al., Interactive effects of ocean acidification, elevated temperature, and reduced salinity on early-life stages of the pacific oyster. Environ. Sci. Technol. 48, 10079–10088 (2014). doi: 10.1021/es501611u; pmid: 25014366 95. A. J. Poulton et al., Coccolithophores on the north-west European shelf: Calcification rates and environmental controls. Biogeosciences 11, 3919–3940 (2014). doi: 10.5194/ bg-11-3919-2014 96. R. I. Perry, R. E. Ommer, M. Barange, F. Werner, The challenge of adapting marine social–ecological systems to the additional stress of climate change. Curr. Opin. Environ. Sustain. 2, 356–363 (2010). doi: 10.1016/j.cosust.2010.10.004 97. J. Brodie et al., The future of the northeast Atlantic benthic flora in a high CO2 world. Ecol. Evol. 4, 2787–2798 (2014). doi: 10.1002/ece3.1105; pmid: 25077027 98. M. O. Clarkson et al., Ocean acidification and the Permo-Triassic mass extinction. Science 348, 229–232 (2015). doi: 10.1126/science.aaa0193; pmid: 25859043 99. S. E. Moffitt, T. M. Hill, P. D. Roopnarine, J. P. Kennett, Response of seafloor ecosystems to abrupt global climate change. Proc. Natl. Acad. Sci. U.S.A. 112, 4684–4689 (2015). doi: 10.1073/pnas.1417130112; pmid: 25825727 100. A. Böhnke-Henrichs, C. Baulcomb, R. Koss, S. S. Hussain, R. S. de Groot, Typology and indicators of ecosystem services for marine spatial planning and management. J. Environ. Manage. 130, 135–145 (2013). doi: 10.1016/ j.jenvman.2013.08.027; pmid: 24076513 101. J. Mendler de Suarez, B. Cicin-Sain, K. Wowk, R. Payet, O. Hoegh-Guldberg, Ensuring survival: Oceans, climate and security. Ocean Coast. Manage. 90, 27–37 (2014). doi: 10.1016/j.ocecoaman.2013.08.007 102. U. Riebesell, A. Körtzinger, A. Oschlies, Sensitivities of marine carbon fluxes to ocean change. Proc. Natl. Acad. Sci. U.S.A. 106, 20602–20609 (2009). doi: 10.1073/pnas.0813291106; pmid: 19995981 103. C. M. Duarte, I. J. Losada, I. E. Hendriks, I. Mazarrasa, N. Marbà, The role of coastal plant communities for climate change mitigation and adaptation. Nat. Clim. Change 3, 961–968 (2013). doi: 10.1038/nclimate1970 104. M. D. Spalding et al., The role of ecosystems in coastal protection: Adapting to climate change and coastal hazards. Ocean Coast. Manage. 90, 50–57 (2014). doi: 10.1016/ j.ocecoaman.2013.09.007 105. B. Ondiviela et al., The role of seagrasses in coastal protection in a changing climate. Coast. Eng. 87, 158–168 (2014). doi: 10.1016/j.coastaleng.2013.11.005 106. J. Hinkel et al., Coastal flood damage and adaptation costs under 21st century sea-level rise. Proc. Natl. Acad. Sci. U.S.A. 111, 3292–3297 (2014). doi: 10.1073/pnas.1222469111; pmid: 24596428 107. R. Costanza et al., The value of coastal wetlands for hurricane protection. Ambio 37, 241–248 (2008). doi: 10.1579/ 0044-7447(2008)37[241:TVOCWF]2.0.CO;2; pmid: 18686502 108. E. B. Barbier, Valuing the storm protection service of estuarine and coastal ecosystems. Ecosyst. Serv. 11, 32–38 (2015). doi: 10.1016/j.ecoser.2014.06.010 109. U. R. Sumaila, W. W. L. Cheung, V. W. Y. Lam, D. Pauly, S. Herrick, Climate change impacts on the biophysics and economics of world fisheries. Nat. Clim. Change 1, 449–456 (2011). doi: 10.1038/nclimate1301 110. W. W. Cheung, R. Watson, D. Pauly, Signature of ocean warming in global fisheries catch. Nature 497, 365–368 (2013). doi: 10.1038/nature12156; pmid: 23676754 111. W. W. L. Cheung et al., Shrinking of fishes exacerbates impacts of global ocean changes on marine ecosystems. Nat. Clim. Change. 3, 254–258 (2012). doi: 10.1038/nclimate1691 112. I. Montero-Serra, M. Edwards, M. J. Genner, Warming shelf seas drive the subtropicalization of European pelagic fish communities. Glob. Change Biol. 21, 144–153 (2015). doi: 10.1111/gcb.12747; pmid: 25230844 113. S. D. Simpson et al., Continental shelf-wide response of a fish assemblage to rapid warming of the sea. Curr. Biol. 21, 1565–1570 (2011). doi: 10.1016/j.cub.2011.08.016; pmid: 21924906 114. D. Yemane et al., Assessing changes in the distribution and range size of demersal fish populations in the Benguela Current Large Marine Ecosystem. Rev. Fish Biol. Fish. 24, 463–483 (2014). doi: 10.1007/s11160-014-9357-7 115. A. R. Baudron, C. L. Needle, A. D. Rijnsdorp, C. T. Marshall, Warming temperatures and smaller body sizes: Synchronous changes in growth of North Sea fishes. Glob. Change Biol. 20, 1023–1031 (2014). doi: 10.1111/gcb.12514; pmid: 24375891 116. S. R. Cooley, J. T. Mathis, Addressing ocean acidification as part of sustainable ocean development. Ocean Yearbook Online 27, 29–47 (2013). doi: 10.1163/22116001-90000153 117. M. Barange et al., Impacts of climate change on marine ecosystem production in societies dependent on fisheries. Nat. Clim. Change 4, 211–216 (2014). doi: 10.1038/ nclimate2119 118. V. W. Y. Lam, W. W. L. Cheung, U. R. Sumaila, Marine capture fisheries in the Arctic: Winners or losers under climate change and ocean acidification? Fish Fish., (2014). doi: 10.1111/faf.12106 119. V. W. Y. Lam, W. Cheung, W. Swartz, U. R. Sumaila, Climate change impacts on fisheries in West Africa: Implications for economic, food and nutritional security. Afr. J. Mar. Sci. 34, 103–117 (2012). doi: 10.2989/ 1814232X.2012.673294 120. J. D. Bell et al., Mixed responses of tropical Pacific fisheries and aquaculture to climate change. Nat. Clim. Change 3, 591–599 (2013). doi: 10.1038/nclimate1838 121. W. W. L. Cheung et al., Large-scale redistribution of maximum fisheries catch potential in the global ocean under climate change. Glob. Change Biol. 16, 24–35 (2010). doi: 10.1111/j.1365-2486.2009.01995.x 122. J. T. Mathis et al., Ocean acidification risk assessment for Alaska’s fishery sector. Prog. Oceanogr., (2014). doi: 10.1016/j.pocean.2014.07.001 123. C. H. Ainsworth et al., Potential impacts of climate change on Northeast Pacific marine foodwebs and fisheries. ICES J. Mar. Sci. 68, 1217–1229 (2011). doi: 10.1093/icesjms/fsr043 124. W. W. L. Cheung, J. Pinnegar, G. Merino, M. C. Jones, M. Barange, Review of climate change impacts on marine fisheries in the UK and Ireland. Aquat. Conserv. Mar. Freshwater Ecosyst. 22, 368–388 (2012). doi: 10.1002/aqc.2248 125. J. S. Christiansen, C. W. Mecklenburg, O. V. Karamushko, Arctic marine fishes and their fisheries in light of global change. Glob. Change Biol. 20, 352–359 (2014). doi: 10.1111/ gcb.12395; pmid: 24105993 126. K. A. Miller, G. R. Munro, U. R. Sumaila, W. W. L. Cheung, Governing marine fisheries in a changing climate: A game- theoretic perspective. Can. J. Agric. Econ. 61, 309–334 (2013). doi: 10.1111/cjag.12011 127. R. Callaway et al., Review of climate change impacts on marine aquaculture in the UK and Ireland. Aquat. Conserv. Mar. Freshwater Ecosyst. 22, 389–421 (2012). doi: 10.1002/ aqc.2247 128. M. Ruckelshaus et al., Securing ocean benefits for society in the face of climate change. Mar. Policy 40, 154–159 (2013). doi: 10.1016/j.marpol.2013.01.009 129. A. Barton, B. Hales, G. G. Waldbusser, C. Langdon, R. A. Feely, The Pacific oyster, Crassostrea gigas, shows negative correlation to naturally elevated carbon dioxide levels: Implications for near-term ocean acidification effects. Limnol. Oceanogr. 57, 698–710 (2012). doi: 10.4319/ lo.2012.57.3.0698 130. D. Narita, K. Rehdanz, R. S. J. Tol, Economic costs of ocean acidification: A look into the impacts on global shellfish production. Clim. Change 113, 1049–1063 (2012). doi: 10.1007/s10584-011-0383-3 SCIENCE sciencemag.org 3 JULY 2015 • VOL 349 ISSUE 6243 aac4722-9 RESEARCH | REVIEW
- 11. 131. S. S. De Silva, “Climate change impacts: Challenges for aquaculture,” in Farming the Waters for People and Food, R. P. Subasinghe et al., Eds. (FAO and Network of Aquaculture Centres in Asia-Pacific, Rome and Bangkok, 2012), pp. 75–110. 132. C. A. Burge et al., Climate change influences on marine infectious diseases: Implications for management and society. Annu. Rev. Mar. Sci. 6, 249–277 (2014). doi: 10.1146/ annurev-marine-010213-135029; pmid: 23808894 133. J. Garai, “The impacts of climate change on the livelihoods of coastal people in Bangladesh: A sociological study,” in International Perspectives on Climate Change, W. Leal Filho, F. Alves, S. Caeiro, U. M. Azeiteiro, Eds. (Springer, Switzerland, 2014), pp. 151–163. 134. P.-Y. Chen, C.-C. Chen, L. F. Chu, B. McCarl, Evaluating the economic damage of climate change on global coral reefs. Glob. Environ. Change 30, 12–20 (2015). doi: 10.1016/ j.gloenvcha.2014.10.011 135. Deloitte Access Economics, Economic Contribution of the Great Barrier Reef (Great Barrier Reef Marine Park Authority, Townsville, Australia, 2013). 136. L. M. Brander, K. Rehdanz, R. S. J. Tol, P. J. H. Van Beukering, The economic impact of ocean acidification on coral reefs. Clim. Change Econ. 03, 1250002 (2012). doi: 10.1142/ S2010007812500029 137. L. M. Burke, K. Reytar, M. Spalding, A. Perry, Reefs at Risk Revisited (World Resources Institute, Washington, DC, 2011), p. 114. 138. M. Pascual, X. Rodó, S. P. Ellner, R. Colwell, M. J. Bouma, Cholera dynamics and El Niño-Southern Oscillation. Science 289, 1766–1769 (2000). doi: 10.1126/science.289.5485.1766; pmid: 10976073 139. C. Baker-Austin et al., Emerging Vibrio risk at high latitudes in response to ocean warming. Nat. Clim. Change 3, 73–77 (2013). doi: 10.1038/nclimate1628 140. S. Altizer, R. S. Ostfeld, P. T. Johnson, S. Kutz, C. D. Harvell, Climate change and infectious diseases: From evidence to a predictive framework. Science 341, 514–519 (2013). doi: 10.1126/science.1239401; pmid: 23908230 141. T. L. F. Leung, A. E. Bates, More rapid and severe disease outbreaks for aquaculture at the tropics: Implications for food security. J. Appl. Ecol. 50, 215–222 (2013). doi: 10.1111/1365-2644.12017 142. T. Wheeler, J. von Braun, Climate change impacts on global food security. Science 341, 508–513 (2013). doi: 10.1126/science.1239402; pmid: 23908229 143. R. P. Kelly, M. R. Caldwell, Ten ways states can combat ocean acidification (and why they should). Harvard Environ. Law Rev. 37, 57–103 (2013). doi: 10.2139/ssrn.2020520 144. E. Mcleod et al., Preparing to manage coral reefs for ocean acidification: Lessons from coral bleaching. Front. Ecol. Environ 11, 20–27 (2013). doi: 10.1890/110240 145. A. L. Strong, K. J. Kroeker, L. T. Teneva, L. A. Mease, R. P. Kelly, Ocean acidification 2.0: Managing our changing coastal ocean chemistry. Bioscience 64, 581–592 (2014). doi: 10.1093/biosci/biu072 146. R. Billé et al., Taking action against ocean acidification: A review of management and policy options. Environ. Manage. 52, 761–779 (2013). doi: 10.1007/s00267-013-0132-7; pmid: 23897413 147. Committee on Geoengineering Climate, “Technical evaluation and discussion of impacts,” in Climate Intervention: Reflecting Sunlight to Cool Earth (National Academy of Sciences, Washington, DC, 2015). 148. M. D. Eisaman et al., CO2 extraction from seawater using bipolar membrane electrodialysis. Energy Environ. Sci. 5, 7346 (2012). doi: 10.1039/c2ee03393c 149. M. J. H. van Oppen, J. K. Oliver, H. M. Putnam, R. D. Gates, Building coral reef resilience through assisted evolution. Proc. Natl. Acad. Sci. U.S.A. 112, 2307–2313 (2015). doi: 10.1073/ pnas.1422301112; pmid: 25646461 150. C. N. Young, S. A. Schopmeyer, D. Lirman, A review of reef restoration and coral propagation using the threatened genus Acropora in the Caribbean and Western Atlantic. Bull. Mar. Sci. 88, 1075–1098 (2012). doi: 10.5343/ bms.2011.1143 151. H. Govan et al., Status and Potential of Locally-Managed Marine Areas in the South Pacific: Meeting Nature Conservation and Sustainable Livelihood Targets Through Wide-Spread Implementation of LMMAs (South Pacific Regional Environmental Program/WWF/WorldFish-Reefbase/Coral Reefs Initiative for the Pacific, Noumea, New Caledonia, 2009). 152. R. P. Kelly, S. R. Cooley, T. Klinger, Narratives can motivate environmental action: The Whiskey Creek ocean acidification story. Ambio 43, 592–599 (2014). doi: 10.1007/ s13280-013-0442-2; pmid: 24081705 153. L. Weatherdon, A. Rogers, R. Sumaila, A. Magnan, W. W. L. Cheung, The Oceans 2015 Initiative, Part II: An Updated Understanding of the Observed and Projected Impacts of Ocean Warming and Acidification on Marine and Coastal Socioeconomic Activities/Sectors (Institut du Développement Durable et des Relations Internationales, Paris, 2015). 154. R. Murti, C. Buyck, Eds., Safe Havens: Protected Areas for Disaster Risk Reduction and Climate Change Adaptation (IUCN, Gland, Switzerland, 2014). 155. G. Keppel et al., The capacity of refugia for conservation planning under climate change. Front. Ecol. Environ 13, 106–112 (2015). doi: 10.1890/140055 156. C. Cacciapaglia, R. van Woesik, Reef-coral refugia in a rapidly changing ocean. Glob. Change Biol. 21, 2272–2282 (2015). doi: 10.1111/gcb.12851; pmid: 25646684 157. M. D. Mastrandrea et al., Guidance Note for Lead Authors of the IPCC Fifth Assessment Report on Consistent Treatment of Uncertainties (IPCC, New York, 2010). ACKNOWLEDGMENTS This is a product of “The Oceans 2015 Initiative,” an expert group supported by the Prince Albert II of Monaco Foundation, the Ocean Acidification International Coordination Centre of the International Atomic Energy Agency, the BNP Paribas Foundation, and the Monégasque Association for Ocean Acidification. This study is also a contribution to the international IMBER (Integrated Marine Biogeochemistry and Ecosystem Research) project. We are grateful for the considerable help of Y. Estrada (Technical Support Unit of IPCC WG II) and M. Khamla to finalize the illustrations and H. Flores for useful discussion. A.M. acknowledges support from the French National Research Agency (CapAdapt project, ANR-2011-JSH1-004 01). R.B. is supported by the RESCCUE project funded by the French Development Agency and the French Global Environment Facility (AFD CZZ 1647 01 F and FFEM CZZ 1667 01 H). W.W.L.C. acknowledges support from the Nippon Foundation–UBC Nereus Program and Natural Science and Engineering Research Council of Canada. U.R.S. and W.W.L.C. thank the Social Sciences and Humanities Research Council– sponsored OceanCanada Partnership for support. C.T. is supported by the UK Ocean Acidification research program. F.J. acknowledges support by the Swiss National Science Foundation and the European Commission through the European Union Framework Programme 7 project CARBOCHANGE (no. 264879). O.H.-G. is grateful for support from the University of Queensland, Australian Research Council Centre for Excellence, and his ARC Laureate Fellowship. H.-O.P. acknowledges support by the PACES and BIOACID programs. C.M.E. acknowledges support from the National Oceanic and Atmospheric Administration (NOAA) and NASA. The International Atomic Energy Agency is grateful to the government of the Principality of Monaco for the support provided to its Environment Laboratories. We acknowledge the World Climate Research Programme's Working Group on Coupled Modelling, which is responsible for the Coupled Model Intercomparison Project (CMIP), and thank the climate modeling groups for producing and making available their model output. For CMIP, the U.S. Department of Energy's Program for Climate Model Diagnosis and Intercomparison provides coordinating support and led development of software infrastructure in partnership with the Global Organization for Earth System Science Portals. The contents of this paper are solely the opinions of the authors and do not constitute a statement of policy, decision, or position on behalf of NOAA, NASA, the International Atomic Energy Agency, the U.S. government, or the Secretariat of the Pacific Community. SUPPLEMENTARY MATERIALS www.sciencemag.org/content/349/6243/aac4722/suppl/DC1 Supplementary Text Tables S1 and S2 References (158–219) 10.1126/science.aac4722 aac4722-10 3 JULY 2015 • VOL 349 ISSUE 6243 sciencemag.org SCIENCE RESEARCH | REVIEW