Toronto real estate statistics july 2011
•
0 gostou•433 visualizações

Toronto Real Estate Market Statistics for July 2011. Focus on East End Toronto Homes and East End Toronto Real Estate. The Beaches, Riverdale, Leslieville, Danforth Village, East Danforth, Danforth Mosaic

Recomendados
Recomendados
Mais conteúdo relacionado
Mais procurados
Mais procurados (15)
Semelhante a Toronto real estate statistics july 2011
Semelhante a Toronto real estate statistics july 2011 (20)
Mais de John Helfrich
Mais de John Helfrich (20)
Último
Último (20)
Toronto real estate statistics july 2011
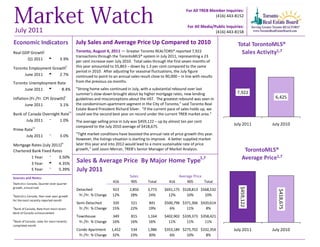
- 1. For All TREB Member Inquiries: (416) 443-8152 For All Media/Public Inquiries: July 2011 (416) 443-8158 Economic Indicators July Sales and Average Price Up Compared to 2010 Total TorontoMLS® Real GDP Growthi Toronto, August 4, 2011 — Greater Toronto REALTORS® reported 7,922 Sales Activity1,7 transactions through the TorontoMLS® system in July 2011, representing a 23 Q1 2011 t 3.9% per cent increase over July 2010. Total sales through the first seven months of Toronto Employment Growthi i this year amounted to 55,863 – down by 1.3 per cent compared to the same period in 2010. After adjusting for seasonal fluctuations, the July figure June 2011 t 2.7% continued to point to an annual sales result close to 90,000 – in line with results Toronto Unemployment Rate from the previous six months. June 2011 u 8.4% "Strong home sales continued in July, with a substantial rebound over last summer’s slow-down brought about by higher mortgage rates, new lending 7,922 Inflation (Yr./Yr. CPI Growth) ii guidelines and misconceptions about the HST. The greatest rebound was seen in 6,425 June 2011 3.1% the condominium apartment segment in the City of Toronto," said Toronto Real Estate Board President Richard Silver. "If the current pace of sales holds up, we iii Bank of Canada Overnight Rate could see the second best year on record under the current TREB market area." July 2011 q 1.0% The average selling price in July was $459,122 – up by almost ten per cent compared to the July 2010 average of $418,675. July 2011 July 2010 iv Prime Rate July 2011 q 3.0% “Tight market conditions have boosted the annual rate of price growth this year. However, the listings situation is starting to improve. A better supplied market iv later this year and into 2012 would lead to a more sustainable rate of price Mortgage Rates (July 2011) Chartered Bank Fixed Rates growth,” said Jason Mercer, TREB’s Senior Manager of Market Analysis. TorontoMLS® 1 Year q 3.50% Sales & Average Price By Major Home Type 1,7 Average Price1,7 3 Year t 4.35% 5 Year q 5.39% July 2011 Sources and Notes: Sales Average Price i Statistics Canada, Quarter-over-quarter 416 905 Total 416 905 Total growth, annualized $459,122 Detached 923 2,850 3,773 $691,175 $528,813 $568,532 $418,675 ii Statistics Canada, Year-over-year growth Yr./Yr. % Change 12% 28% 24% 12% 10% 10% for the most recently reported month Semi-Detached 320 521 841 $500,796 $371,366 $420,614 iii Bank of Canada, Rate from most recent Yr./Yr. % Change 15% 22% 19% 6% 11% 8% Bank of Canada announcement Townhouse 349 815 1,164 $402,902 $339,373 $358,421 iv Bank of Canada, rates for most recently Yr./Yr. % Change 16% 16% 16% 11% 11% 11% completed month Condo Apartment 1,452 534 1,986 $353,189 $275,702 $332,354 July 2011 July 2010 Yr./Yr. % Change 32% 23% 30% 6% 10% 8%
- 2. Toronto Real Estate Board SALES BY PRICE RANGE AND HOUSE TYPE1,7 Industrial Leasing JULY 2011 Price Range Detached Semi-Detached Att/Row/Twnhouse Condo Townhouse Condo Apt Link Co-op Apt Det Condo Co-ownership Apt Total $0 to $99,999 3 1 0 5 13 0 0 0 1 23 $100,000 to $199,999 88 17 4 66 285 1 3 0 0 464 $200,000 to $299,999 327 95 112 204 672 33 1 1 3 1,448 $300,000 to $399,999 704 329 209 247 583 30 2 4 0 2,108 $400,000 to $499,999 820 248 129 51 232 55 0 3 0 1,538 $500,000 to $599,999 660 77 52 24 106 18 1 0 0 938 $600,000 to $699,999 448 40 23 11 39 1 0 0 0 562 $700,000 to $799,999 216 17 9 4 20 0 0 1 0 267 $800,000 to $899,999 167 5 7 1 10 0 0 0 0 190 $900,000 to $999,999 85 2 2 1 7 0 0 0 0 97 $1,000,000 to $1,249,999 102 7 1 1 11 0 0 0 0 122 $1,250,000 to $1,499,999 61 1 0 0 2 0 0 0 0 64 $1,500,000 to $1,749,999 36 2 1 0 2 0 0 0 0 41 $1,750,000 to $1,999,999 14 0 0 0 1 0 0 0 0 15 $2,000,000 + 42 0 0 0 3 0 0 0 0 45 Total Sales 3,773 841 549 615 1,986 138 7 9 4 7,922 Share of Total Sales 47.6% 10.6% 6.9% 7.8% 25.1% 1.7% 0.1% 0.1% 0.1% - Average Price $568,532 $420,614 $401,195 $320,237 $332,354 $394,835 $276,286 $425,900 $211,875 $459,122 SALES BY PRICE RANGE AND HOUSE TYPE1,7 YEAR-TO-DATE, 2011 Price Range Detached Semi-Detached Att/Row/Twnhouse Condo Townhouse Condo Apt Link Co-op Apt Det Condo Co-ownership Apt Total $0 to $99,999 21 1 5 33 139 0 11 0 4 214 $100,000 to $199,999 483 150 57 545 2,058 14 35 2 14 3,358 $200,000 to $299,999 2,386 718 844 1,610 4,528 234 16 19 24 10,379 $300,000 to $399,999 5,182 2,425 1,620 1,559 4,028 224 10 18 4 15,070 $400,000 to $499,999 5,579 1,691 921 355 1,531 321 5 13 0 10,416 $500,000 to $599,999 4,458 530 346 135 632 107 4 6 1 6,219 $600,000 to $699,999 2,906 318 140 87 254 14 0 0 0 3,719 $700,000 to $799,999 1,652 159 65 33 131 2 0 2 0 2,044 $800,000 to $899,999 1,054 83 34 16 58 0 0 2 0 1,247 $900,000 to $999,999 636 28 13 11 40 0 0 0 0 728 $1,000,000 to $1,249,999 874 40 11 10 60 0 1 0 0 996 $1,250,000 to $1,499,999 525 17 8 6 19 0 0 0 0 575 $1,500,000 to $1,749,999 268 14 4 1 22 0 0 0 0 309 $1,750,000 to $1,999,999 165 9 2 0 9 0 0 1 0 186 $2,000,000 + 364 14 0 0 25 0 0 0 0 403 Total Sales 26,553 6,197 4,070 4,401 13,534 916 82 63 47 55,863 Share of Total Sales 47.5% 11.1% 7.3% 7.9% 24.2% 1.6% 0.1% 0.1% 0.1% - Average Price $583,691 $430,903 $394,204 $316,130 $328,575 $385,857 $226,846 $407,271 $219,151 $465,777 Page 3 July 2010 Market Watch, July 2011 2
- 3. Toronto Real Estate Board ALL HOME TYPES, JULY 2011 SUMMARY OF EXISTING HOME TRANSACTIONS ALL TREB AREAS Sales1 Average Selling Price1 1 Number of Sales Yr./Yr. % Change Dollar Volume Avg. Price Level Yr./Yr. % Change Median Price1 New Listings2 Active Listings3 Avg. SP/LP 4 Avg. DOM5 TREB Total 7,922 23.3% $3,637,168,257 $459,122 9.7% $395,000 12,508 17,546 98% 26 Halton Region 461 29.1% $242,184,482 $525,346 15.1% $450,000 636 991 98% 29 Burlington 48 -5.9% $20,520,700 $427,515 14.4% $374,450 79 139 97% 20 Halton Hills 87 11.5% $36,611,100 $420,817 0.4% $412,500 103 204 98% 29 Milton 129 26.5% $57,645,282 $446,863 8.7% $427,000 192 212 98% 24 Oakville 197 56.3% $127,407,400 $646,738 17.7% $570,000 262 436 97% 33 Peel Region 1,727 17.4% $722,754,078 $418,503 9.2% $380,000 2,760 3,404 98% 23 Brampton 709 22.9% $274,600,393 $387,307 9.1% $368,000 1,158 1,324 98% 22 Caledon 66 1.5% $36,699,500 $556,053 -2.9% $507,000 112 274 97% 34 Mississauga 952 14.8% $411,454,185 $432,200 11.5% $386,444 1,490 1,806 98% 23 City of Toronto 3,072 20.8% $1,461,402,170 $475,717 7.4% $392,650 5,075 6,928 99% 24 ! TURN PAGE FOR CITY OF TORONTO TABLES OR CLICK HERE: York Region 1,557 35.3% $843,836,645 $541,963 10.4% $490,000 2,350 3,068 99% 24 Aurora 82 67.3% $43,387,300 $529,113 1.2% $452,500 112 164 97% 24 E. Gwillimbury 26 -3.7% $10,924,778 $420,184 0.6% $405,750 40 97 97% 33 Georgina 78 20.0% $22,607,899 $289,845 -17.1% $279,500 139 348 97% 43 King 16 33.3% $10,536,900 $658,556 -9.7% $609,000 62 171 96% 60 Markham 436 29.4% $247,472,262 $567,597 10.6% $515,000 661 629 100% 19 Newmarket 137 38.4% $57,687,875 $421,079 11.1% $389,000 167 175 98% 29 Richmond Hill 391 32.5% $240,223,525 $614,382 17.8% $550,000 626 663 99% 20 Vaughan 300 35.7% $160,069,168 $533,564 10.0% $490,000 435 612 98% 23 Whitchurch-Stouffville 91 97.8% $50,926,938 $559,637 1.9% $482,000 108 209 97% 35 Durham Region 906 23.6% $298,939,699 $329,956 11.2% $300,000 1,328 2,247 98% 32 Ajax 169 29.0% $60,516,600 $358,086 7.3% $340,000 235 317 98% 27 Brock 19 46.2% $4,292,400 $225,916 -18.2% $210,000 34 147 96% 65 Clarington 133 13.7% $37,727,090 $283,662 3.1% $265,000 202 373 97% 32 Oshawa 273 30.6% $76,267,596 $279,368 15.4% $254,900 399 661 98% 32 Pickering 121 23.5% $47,091,700 $389,188 10.3% $349,000 177 228 98% 25 Scugog 30 30.4% $12,955,400 $431,847 36.6% $330,000 51 134 97% 39 Uxbridge 38 58.3% $18,737,000 $493,079 31.6% $452,500 44 133 96% 72 Whitby 123 4.2% $41,351,913 $336,194 8.5% $310,000 186 254 98% 25 Dufferin County 49 -2.0% $16,048,353 $327,517 7.2% $325,000 88 135 98% 38 Orangeville 49 -2.0% $16,048,353 $327,517 7.2% $325,000 88 135 98% 38 Simcoe County 150 24.0% $52,002,830 $346,686 6.2% $289,950 271 773 97% 51 Adjala-Tosorontio 11 22.2% $5,068,500 $460,773 6.5% $470,000 28 117 97% 84 Bradford West Gwillimbury 37 5.7% $13,316,100 $359,895 2.6% $339,000 52 120 98% 31 Essa 15 150.0% $4,358,250 $290,550 -10.6% $245,000 39 107 97% 56 Innisfil 43 26.5% $15,769,690 $366,737 25.0% $269,000 85 234 96% 52 New Tecumseth 44 18.9% $13,490,290 $306,598 -0.5% $287,850 67 195 97% 56 Page 3 July 2010 Market Watch, July 2011 3
- 4. Toronto Real Estate Board ALL HOME TYPES, JULY 2011 SUMMARY OF EXISTING HOME TRANSACTIONS CITY OF TORONTO Industrial Leasing MUNICIPAL BREAKDOWN Sales1 Average Selling Price1 1 1 2 3 4 5 Number of Sales Yr./Yr. % Change Dollar Volume Avg. Price Level Yr./Yr. % Change Median Price New Listings Active Listings Avg. SP/LP Avg. DOM TREB Total 7,922 23.3% $3,637,168,257 $459,122 9.7% $395,000 12,508 17,546 98% 26 City of Toronto Total 3,072 20.8% $1,461,402,170 $475,717 7.4% $392,650 5,075 6,928 99% 24 Toronto West 748 22.6% $317,215,831 $424,085 1.9% $375,500 1,235 2,023 99% 27 Toronto W01 68 17.2% $32,363,752 $475,938 -3.7% $384,700 81 123 101% 26 Toronto W02 67 -8.2% $35,529,228 $530,287 10.3% $489,000 96 97 101% 17 Toronto W03 54 38.5% $19,447,227 $360,134 17.8% $355,750 115 163 99% 28 Toronto W04 72 56.5% $25,599,000 $355,542 14.5% $342,500 130 222 98% 36 Toronto W05 94 10.6% $33,006,400 $351,132 10.8% $353,750 200 389 97% 32 Toronto W06 92 19.5% $39,447,000 $428,772 0.4% $408,500 167 287 98% 26 Toronto W07 52 -1.9% $26,201,002 $503,865 -5.8% $463,750 34 48 99% 21 Toronto W08 99 19.3% $58,058,551 $586,450 -0.8% $480,000 167 272 97% 26 Toronto W09 47 30.6% $17,030,400 $362,349 7.1% $390,000 87 150 99% 29 Toronto W10 103 71.7% $30,533,271 $296,440 22.3% $280,000 158 272 98% 22 Toronto Central 1,439 23.4% $798,718,956 $555,051 9.5% $418,000 2,431 3,247 99% 24 Toronto C01 409 32.4% $175,630,611 $429,415 6.5% $384,900 751 1,173 99% 29 Toronto C02 61 17.3% $48,253,009 $791,033 4.3% $605,000 91 160 98% 34 Toronto C03 37 -30.2% $23,311,900 $630,051 -1.4% $520,000 56 109 98% 27 Toronto C04 77 10.0% $64,401,918 $836,389 15.5% $765,000 103 136 99% 23 Toronto C06 33 57.1% $19,794,800 $599,842 11.4% $560,000 47 46 98% 19 Toronto C07 111 32.1% $59,311,689 $534,340 31.3% $419,900 167 193 99% 21 Toronto C08 156 11.4% $63,016,945 $403,955 6.2% $372,000 247 321 99% 22 Toronto C09 27 -10.0% $27,538,000 $1,019,926 23.2% $882,000 25 53 97% 29 Toronto C10 68 21.4% $51,769,500 $761,316 8.7% $525,000 78 82 97% 26 Toronto C11 32 60.0% $14,510,055 $453,439 -37.9% $281,250 58 77 99% 34 Toronto C12 32 10.3% $45,789,000 $1,430,906 11.0% $1,314,500 75 133 97% 19 Toronto C13 58 3.6% $31,979,838 $551,377 30.4% $435,750 114 130 101% 23 Toronto C14 214 43.6% $117,265,998 $547,972 32.2% $405,500 406 372 99% 17 Toronto C15 124 27.8% $56,145,693 $452,788 4.3% $391,000 213 262 100% 21 Toronto East 885 15.5% $345,467,383 $390,359 6.3% $370,000 1,409 1,658 100% 23 Toronto E01 67 -10.7% $34,108,864 $509,088 15.3% $491,000 109 120 102% 14 Toronto E02 71 47.9% $42,896,321 $604,174 -7.4% $545,000 100 84 100% 15 Toronto E03 91 5.8% $39,179,172 $430,540 11.9% $430,000 120 150 100% 21 Toronto E04 97 49.2% $30,877,765 $318,327 6.8% $325,000 169 199 100% 27 Toronto E05 115 25.0% $43,947,487 $382,152 4.2% $339,000 147 127 101% 18 Toronto E06 38 -9.5% $16,946,200 $445,953 11.0% $412,500 39 60 99% 20 Toronto E07 93 45.3% $33,163,466 $356,596 6.0% $347,000 175 190 99% 20 Toronto E08 60 -25.0% $20,984,338 $349,739 3.4% $357,500 101 158 98% 32 Toronto E09 115 19.8% $34,075,476 $296,308 14.0% $279,500 238 285 99% 25 Toronto E10 39 -7.1% $18,865,400 $483,728 17.0% $460,000 64 82 98% 27 Toronto E11 99 30.3% $30,422,894 $307,302 2.3% $297,000 147 203 98% 31 Page 3 July 2010 Market Watch, July 2011 4
- 5. Toronto Real Estate Board ALL HOME TYPES, YEAR-TO-DATE 2011 SUMMARY OF EXISTING HOME TRANSACTIONS IndustrialAREAS ALL TREB Leasing Sales1 Average Selling Price1 Number of Sales Yr./Yr. % Change Dollar Volume1 Avg. Price Level Yr./Yr. % Change Median Price1 New Listings2 Avg. SP/LP 4 Avg. DOM5 TREB Total 55,863 -1.3% $26,019,690,572 $465,777 7.8% $390,000 93,380 99% 25 Halton Region 3,295 8.8% $1,717,616,676 $521,280 9.6% $439,900 5,305 98% 26 Burlington 394 10.7% $175,542,345 $445,539 13.4% $367,000 595 97% 30 Halton Hills 591 -1.2% $253,006,191 $428,098 3.5% $397,000 910 98% 29 Milton 977 8.9% $413,155,164 $422,881 2.7% $395,000 1,554 99% 20 Oakville 1,333 13.3% $875,912,976 $657,099 13.2% $549,000 2,246 97% 29 Peel Region 11,813 -7.1% $4,809,949,448 $407,174 6.1% $370,000 19,488 98% 23 Brampton 4,771 -7.6% $1,795,283,581 $376,291 6.8% $358,300 7,917 98% 22 Caledon 500 -1.0% $258,028,661 $516,057 2.7% $450,000 902 97% 30 Mississauga 6,542 -7.2% $2,756,637,206 $421,375 5.7% $376,300 10,669 98% 23 City of Toronto 22,268 -1.8% $11,242,287,639 $504,863 7.4% $399,850 37,739 100% 24 ! TURN PAGE FOR CITY OF TORONTO TABLES OR CLICK HERE: York Region 10,756 5.0% $5,782,004,088 $537,561 8.9% $480,000 17,234 99% 23 Aurora 603 6.3% $310,156,719 $514,356 6.3% $440,000 915 98% 24 E. Gwillimbury 169 -6.1% $73,364,978 $434,112 -0.4% $382,500 315 97% 39 Georgina 497 -6.4% $139,082,867 $279,845 -3.6% $270,000 985 97% 40 King 136 -19.0% $105,084,777 $772,682 12.3% $677,500 385 94% 55 Markham 2,871 5.2% $1,602,325,495 $558,107 6.6% $503,000 4,364 100% 19 Newmarket 907 -0.9% $374,536,615 $412,940 8.5% $380,100 1,275 98% 23 Richmond Hill 2,776 7.9% $1,644,210,255 $592,295 13.7% $540,000 4,522 99% 20 Vaughan 2,328 6.1% $1,273,221,295 $546,916 7.8% $493,000 3,641 98% 23 Whitchurch-Stouffville 469 20.3% $260,021,087 $554,416 6.8% $460,000 832 97% 32 Durham Region 6,213 -3.7% $1,973,280,477 $317,605 4.9% $292,100 10,850 98% 30 Ajax 1,106 -7.9% $381,735,667 $345,150 3.8% $328,750 1,882 98% 25 Brock 115 22.3% $27,595,280 $239,959 -11.6% $220,000 309 96% 71 Clarington 888 -9.7% $244,538,079 $275,381 2.8% $259,950 1,656 98% 31 Oshawa 1,797 -0.1% $482,438,728 $268,469 5.8% $246,000 3,169 98% 31 Pickering 834 -3.0% $316,218,249 $379,159 7.3% $345,000 1,320 98% 25 Scugog 183 -23.4% $66,045,459 $360,904 6.9% $326,900 401 97% 50 Uxbridge 223 1.8% $104,728,710 $469,635 12.6% $418,000 420 97% 52 Whitby 1,067 0.9% $349,980,305 $328,004 3.9% $313,000 1,693 98% 23 Dufferin County 386 0.0% $123,795,531 $320,714 2.3% $299,250 584 98% 34 Orangeville 386 0.0% $123,795,531 $320,714 2.3% $299,250 584 98% 34 Simcoe County 1,132 2.9% $370,756,713 $327,524 5.3% $296,000 2,180 97% 50 Adjala-Tosorontio 81 -17.3% $33,936,400 $418,968 8.1% $385,000 208 97% 72 Bradford West Gwillimbury 305 7.0% $106,670,177 $349,738 4.1% $334,000 485 97% 34 Essa 151 8.6% $42,606,389 $282,162 -6.4% $253,000 339 98% 52 Innisfil 288 7.1% $92,822,005 $322,299 15.2% $281,750 613 96% 59 New Tecumseth 307 -0.6% $94,721,742 $308,540 4.5% $285,000 535 97% 51 Page 3 July 2010 Market Watch, July 2011 5
- 6. Toronto Real Estate Board Industrial Leasing ALL HOME TYPES, YEAR-TO-DATE 2011 SUMMARY OF EXISTING HOME TRANSACTIONS CITY OF TORONTO MUNICIPAL BREAKDOWN Sales1 Average Selling Price1 1 1 2 4 5 Number of Sales Yr./Yr. % Change Dollar Volume Avg. Price Level Yr./Yr. % Change Median Price New Listings Avg. SP/LP Avg. DOM TREB Total 55,863 -1.3% $26,019,690,572 $465,777 7.8% $390,000 93,380 99% 25 City of Toronto Total 22,268 -1.8% $11,242,287,639 $504,863 7.4% $399,850 37,739 100% 24 Toronto West 5,319 -5.5% $2,339,752,750 $439,886 4.8% $380,000 9,401 99% 27 Toronto W01 470 9.3% $253,214,251 $538,754 2.1% $439,900 815 102% 21 Toronto W02 533 -4.0% $285,307,057 $535,285 4.9% $476,000 745 102% 17 Toronto W03 440 -2.9% $150,506,703 $342,061 3.3% $343,500 788 99% 27 Toronto W04 466 -4.5% $157,006,659 $336,924 5.5% $330,250 821 98% 32 Toronto W05 660 -7.8% $224,354,156 $339,931 7.3% $340,000 1,348 97% 33 Toronto W06 688 -12.4% $296,789,893 $431,381 5.5% $400,000 1,358 99% 27 Toronto W07 408 -15.2% $221,178,600 $542,104 7.5% $530,000 562 100% 22 Toronto W08 730 -10.9% $457,924,612 $627,294 6.9% $518,963 1,261 100% 24 Toronto W09 324 4.5% $127,783,253 $394,393 2.6% $421,050 622 99% 35 Toronto W10 600 1.9% $165,687,566 $276,146 5.1% $277,950 1,081 97% 30 Toronto Central 10,639 2.0% $6,363,358,318 $598,116 7.2% $429,000 17,981 99% 23 Toronto C01 2,924 9.4% $1,256,217,623 $429,623 4.0% $378,000 5,528 99% 26 Toronto C02 533 -4.7% $480,997,257 $902,434 17.7% $670,000 919 99% 25 Toronto C03 342 -10.5% $295,373,277 $863,665 2.5% $566,250 592 99% 26 Toronto C04 655 -14.6% $588,141,329 $897,926 8.4% $810,500 1,056 100% 21 Toronto C06 236 21.0% $124,493,087 $527,513 -4.9% $521,750 384 99% 21 Toronto C07 892 8.0% $437,736,311 $490,736 11.4% $403,250 1,329 99% 22 Toronto C08 1,039 -9.6% $449,457,891 $432,587 10.7% $382,000 1,748 99% 24 Toronto C09 254 11.4% $324,176,465 $1,276,285 6.5% $930,000 369 99% 24 Toronto C10 625 2.3% $506,328,390 $810,125 11.6% $580,000 887 100% 22 Toronto C11 250 4.6% $155,466,396 $621,866 13.5% $581,250 404 102% 24 Toronto C12 247 -13.6% $394,729,055 $1,598,093 11.5% $1,380,000 485 97% 28 Toronto C13 449 -1.8% $219,266,150 $488,343 15.4% $400,000 733 101% 21 Toronto C14 1,323 11.3% $705,880,696 $533,545 12.2% $400,000 2,133 100% 20 Toronto C15 870 0.0% $425,094,391 $488,614 8.4% $420,000 1,414 101% 21 Toronto East 6,310 -4.6% $2,539,176,571 $402,405 7.5% $375,000 10,357 100% 21 Toronto E01 574 -1.4% $313,308,217 $545,833 12.5% $521,750 934 104% 14 Toronto E02 558 1.5% $353,413,779 $633,358 3.2% $545,000 901 101% 14 Toronto E03 772 -5.0% $342,403,483 $443,528 6.5% $431,000 1,246 102% 19 Toronto E04 599 4.4% $192,080,562 $320,669 8.3% $340,000 1,013 100% 21 Toronto E05 681 0.3% $246,778,973 $362,377 5.6% $321,000 975 101% 18 Toronto E06 372 2.8% $168,573,555 $453,155 10.5% $402,250 600 99% 21 Toronto E07 578 -1.5% $216,714,323 $374,938 10.8% $378,500 976 101% 19 Toronto E08 513 -7.9% $181,776,749 $354,341 11.3% $347,000 849 98% 29 Toronto E09 743 -13.6% $213,907,585 $287,897 5.3% $273,000 1,307 99% 27 Toronto E10 329 -10.6% $134,885,117 $409,985 1.7% $405,500 519 99% 22 Toronto E11 591 -13.2% $175,334,228 $296,674 -1.5% $285,000 1,037 99% 29 Page 3 July 2010 Market Watch, July 2011 6
- 7. Toronto Real Estate Board DETACHED HOUSES, JULY 2011 Industrial Leasing SUMMARY OF EXISTING HOME TRANSACTIONS ALL TREB AREAS Sales1 Dollar Volume1 Average Price1 Median Price1 New Listings2 Active Listings3 Avg. SP/LP 4 Avg. DOM5 TREB Total 3,773 - $2,145,072,427 - $568,532 - $493,000 - 5,821 - 8,715 - 98% - 26 - Halton Region 292 $182,104,950 $623,647 $538,500 417 717 97% 31 Burlington 21 $12,183,500 $580,167 $538,000 40 82 96% 20 Halton Hills 66 $30,559,200 $463,018 $439,500 86 174 98% 30 Milton 76 $39,332,550 $517,534 $499,950 121 158 98% 30 Oakville 129 - $100,029,700 - $775,424 - $645,000 - 170 - 303 - 97% - 33 - Peel Region 823 $436,531,999 $530,416 $485,000 1,318 1,714 98% 23 Brampton 413 $186,243,144 $450,952 $438,000 696 822 98% 23 Caledon 55 $32,788,000 $596,145 $542,000 96 256 97% 36 Mississauga 355 - $217,500,855 - $612,678 - $552,500 - 526 - 636 - 98% - 22 - City of Toronto 923 $637,954,256 $691,175 $550,000 1,433 1,707 99% 20 ! TURN PAGE FOR CITY OF TORONTO TABLES OR CLICK HERE: - - - - - - - - York Region 917 $593,074,126 $646,755 $595,000 1,399 2,076 98% 26 Aurora 47 $30,415,600 $647,140 $565,000 73 116 96% 24 E. Gwillimbury 23 $10,125,278 $440,229 $416,500 39 96 97% 33 Georgina 75 $21,836,899 $291,159 $285,000 134 333 97% 44 King 14 $9,947,000 $710,500 $642,000 51 158 96% 65 Markham 221 $159,794,177 $723,051 $670,000 305 275 100% 20 Newmarket 83 $40,585,700 $488,984 $458,000 110 129 98% 32 Richmond Hill 225 $173,781,206 $772,361 $688,000 363 408 99% 20 Vaughan 153 $100,835,578 $659,056 $583,100 237 375 98% 24 Whitchurch-Stouffville 76 - $45,752,688 - $602,009 - $505,500 - 87 - 186 - 97% - 35 - Durham Region 675 $242,062,893 $358,612 $330,000 980 1,740 97% 33 Ajax 113 $45,506,650 $402,714 $382,500 162 220 98% 27 Brock 18 $4,122,400 $229,022 $212,500 32 138 96% 68 Clarington 100 $30,491,000 $304,910 $275,000 150 295 97% 32 Oshawa 221 $65,851,530 $297,971 $272,000 310 502 97% 33 Pickering 75 $34,088,000 $454,507 $395,000 109 155 97% 24 Scugog 30 $12,955,400 $431,847 $330,000 48 130 97% 39 Uxbridge 36 $18,239,500 $506,653 $472,500 38 120 96% 72 Whitby 82 - $30,808,413 - $375,712 - $375,000 - 131 - 180 - 98% - 23 - Dufferin County 35 $12,669,953 $361,999 $343,000 56 91 98% 33 Orangeville 35 - $12,669,953 - $361,999 - $343,000 - 56 - 91 - 98% - 33 - Simcoe County 108 $40,674,250 $376,613 $319,500 218 670 97% 53 Adjala-Tosorontio 11 $5,068,500 $460,773 $470,000 28 117 97% 84 Bradford West Gwillimbury 24 $9,508,900 $396,204 $378,500 36 98 97% 34 Essa 9 $2,977,250 $330,806 $266,000 31 92 96% 63 Innisfil 38 $14,572,400 $383,484 $281,000 78 227 96% 56 New Tecumseth 26 $8,547,200 $328,738 $313,750 45 136 97% 49 Page 3 July 2010 Market Watch, July 2011 7
- 8. Toronto Real Estate Board DETACHED HOUSES, JULY 2011 Industrial Leasing SUMMARY OF EXISTING HOME TRANSACTIONS CITY OF TORONTO MUNICIPAL BREAKDOWN Sales1 Dollar Volume1 Average Price1 Median Price1 New Listings2 Active Listings3 Avg. SP/LP 4 Avg. DOM5 TREB Total 3,773 $2,145,072,427 $568,532 $493,000 5,821 8,715 98% 26 City of Toronto Total 923 $637,954,256 $691,175 $550,000 1,433 1,707 99% 20 Toronto West 296 $163,707,857 $553,067 $475,000 438 617 99% 23 Toronto W01 10 $8,367,750 $836,775 $736,500 11 14 99% 25 Toronto W02 15 $10,690,349 $712,690 $735,000 28 35 100% 20 Toronto W03 35 $13,135,750 $375,307 $355,000 65 93 99% 26 Toronto W04 41 $18,444,100 $449,856 $425,000 60 84 98% 30 Toronto W05 26 $12,633,800 $485,915 $439,000 46 69 98% 32 Toronto W06 30 $14,221,550 $474,052 $462,000 46 61 100% 16 Toronto W07 24 $15,623,452 $650,977 $601,000 21 28 100% 18 Toronto W08 46 $40,186,601 $873,622 $675,000 61 112 97% 21 Toronto W09 20 $10,793,500 $539,675 $540,000 45 50 99% 22 Toronto W10 49 $19,611,005 $400,225 $385,000 55 71 98% 21 Toronto Central 273 $295,533,461 $1,082,540 $840,000 440 561 99% 21 Toronto C01 6 $4,354,000 $725,667 $644,000 8 9 98% 23 Toronto C02 12 $16,025,500 $1,335,458 $870,000 14 22 102% 31 Toronto C03 15 $12,518,000 $834,533 $626,000 28 60 97% 28 Toronto C04 48 $50,723,418 $1,056,738 $887,509 73 97 98% 23 Toronto C06 21 $15,305,800 $728,848 $685,000 27 22 98% 20 Toronto C07 29 $26,587,414 $916,807 $712,000 43 54 99% 20 Toronto C08 - - - - 4 6 - - Toronto C09 8 $13,283,000 $1,660,375 $1,537,500 7 23 97% 24 Toronto C10 10 $18,567,000 $1,856,700 $1,032,500 14 23 95% 29 Toronto C11 6 $6,046,855 $1,007,809 $861,000 15 16 98% 15 Toronto C12 19 $38,282,500 $2,014,868 $1,685,500 46 100 97% 23 Toronto C13 23 $20,622,638 $896,636 $730,000 39 31 102% 13 Toronto C14 49 $52,762,148 $1,076,779 $925,000 67 56 100% 17 Toronto C15 27 $20,455,188 $757,600 $705,000 55 42 100% 15 Toronto East 354 $178,712,938 $504,839 $462,250 555 529 100% 17 Toronto E01 16 $10,192,777 $637,049 $619,500 21 33 100% 12 Toronto E02 22 $17,451,600 $793,255 $747,250 38 30 100% 12 Toronto E03 46 $23,302,471 $506,575 $477,500 67 78 100% 19 Toronto E04 44 $18,004,100 $409,184 $406,500 86 71 101% 16 Toronto E05 33 $19,642,199 $595,218 $619,000 41 28 104% 11 Toronto E06 28 $13,104,900 $468,032 $422,500 31 36 99% 18 Toronto E07 33 $16,394,400 $496,800 $495,000 46 36 101% 16 Toronto E08 32 $15,431,488 $482,234 $409,500 46 56 99% 26 Toronto E09 42 $16,323,900 $388,664 $378,500 87 64 101% 14 Toronto E10 28 $15,683,400 $560,121 $510,000 46 53 98% 26 Toronto E11 30 $13,181,703 $439,390 $429,250 46 44 99% 17 Page 3 July 2010 Market Watch, July 2011 8
- 9. Toronto Real Estate Board SEMI-DETACHED HOUSES, JULY 2011 Industrial Leasing SUMMARY OF EXISTING HOME TRANSACTIONS ALL TREB AREAS Sales1 Dollar Volume1 Average Price1 Median Price1 New Listings2 Active Listings3 Avg. SP/LP 4 Avg. DOM5 TREB Total 841 - $353,736,404 - $420,614 - $390,000 - 1,201 - 1,094 - 100% - 18 - Halton Region 32 $12,482,700 $390,084 $379,950 49 44 99% 18 Burlington 6 $2,417,000 $402,833 $424,000 9 9 98% 11 Halton Hills 5 $1,598,500 $319,700 $300,000 3 3 99% 20 Milton 15 $5,755,300 $383,687 $378,500 26 19 100% 16 Oakville 6- $2,711,900 - $451,983 - $459,750 - 11 - 13 - 99% - 28 - Peel Region 302 $112,386,837 $372,142 $359,250 443 383 99% 16 Brampton 136 $45,542,851 $334,874 $333,900 225 208 99% 15 Caledon 6 $2,093,500 $348,917 $357,750 7 6 98% 41 Mississauga 160 - $64,750,486 - $404,691 - $405,000 - 211 - 169 - 99% - 15 - City of Toronto 320 $160,254,788 $500,796 $455,000 476 457 101% 17 ! TURN PAGE FOR CITY OF TORONTO TABLES OR CLICK HERE: - - - - - - - - York Region 121 $52,342,513 $432,583 $442,000 159 118 100% 17 Aurora 8 $2,943,800 $367,975 $348,500 11 10 98% 21 E. Gwillimbury - - - - - 1 - - Georgina 2 $536,000 $268,000 $268,000 - 5 98% 33 King - - - - - - - - Markham 27 $12,376,488 $458,388 $459,000 42 28 102% 14 Newmarket 20 $6,727,675 $336,384 $343,750 28 20 99% 20 Richmond Hill 25 $12,235,300 $489,412 $495,000 28 18 99% 20 Vaughan 33 $15,274,000 $462,848 $475,000 41 25 100% 10 Whitchurch-Stouffville 6- $2,249,250 - $374,875 - $372,500 - 9- 11 - 98% - 38 - Durham Region 56 $13,789,666 $246,244 $257,500 62 75 98% 25 Ajax 15 $4,621,150 $308,077 $305,000 16 18 99% 21 Brock - - - - - 1 - - Clarington 5 $868,400 $173,680 $192,900 5 8 96% 22 Oshawa 21 $3,962,616 $188,696 $192,000 23 29 98% 31 Pickering 9 $2,740,500 $304,500 $296,000 12 12 99% 24 Scugog - - - - 2 2 - - Uxbridge - - - - - 1 - - Whitby 6- $1,597,000 - $266,167 - $269,500 - 4- 4- 97% - 18 - Dufferin County 7 $1,677,900 $239,700 $239,000 7 7 98% 49 Orangeville 7 - $1,677,900 - $239,700 - $239,000 - 7 - 7 - 98% - 49 - Simcoe County 3 $802,000 $267,333 $274,000 5 10 99% 27 Adjala-Tosorontio - - - - - - - - Bradford West Gwillimbury 2 $579,000 $289,500 $289,500 4 5 99% 9 Essa - - - - - 1 - - Innisfil - - - - - - - - New Tecumseth 1 $223,000 $223,000 $223,000 1 4 98% 63 Page 3 July 2010 Market Watch, July 2011 9
- 10. Toronto Real Estate Board SEMI-DETACHED HOUSES, JULY 2011 Industrial Leasing SUMMARY OF EXISTING HOME TRANSACTIONS CITY OF TORONTO MUNICIPAL BREAKDOWN Sales1 Dollar Volume1 Average Price1 Median Price1 New Listings2 Active Listings3 Avg. SP/LP 4 Avg. DOM5 TREB Total 841 $353,736,404 $420,614 $390,000 1,201 1,094 100% 18 City of Toronto Total 320 $160,254,788 $500,796 $455,000 476 457 101% 17 Toronto West 105 $47,182,366 $449,356 $392,000 172 194 101% 19 Toronto W01 12 $7,606,022 $633,835 $642,750 10 3 107% 11 Toronto W02 25 $14,227,079 $569,083 $581,000 32 24 104% 10 Toronto W03 13 $4,762,477 $366,344 $375,000 41 51 99% 22 Toronto W04 4 $1,209,000 $302,250 $318,500 8 15 98% 27 Toronto W05 38 $14,344,400 $377,484 $360,500 62 84 97% 27 Toronto W06 2 $985,100 $492,550 $492,550 1 2 99% 23 Toronto W07 - - - - - - - - Toronto W08 1 $445,000 $445,000 $445,000 2 1 99% 16 Toronto W09 4 $1,633,900 $408,475 $401,000 6 4 101% 12 Toronto W10 6 $1,969,388 $328,231 $332,000 10 10 98% 14 Toronto Central 89 $54,809,700 $615,839 $525,000 120 104 100% 19 Toronto C01 8 $6,776,500 $847,063 $542,500 15 15 99% 30 Toronto C02 18 $12,492,000 $694,000 $548,000 18 24 95% 33 Toronto C03 6 $2,953,500 $492,250 $407,500 9 13 99% 21 Toronto C04 6 $4,496,000 $749,333 $752,500 3 1 104% 7 Toronto C06 1 $495,000 $495,000 $495,000 2 2 97% 28 Toronto C07 8 $3,640,500 $455,063 $445,000 6 5 98% 23 Toronto C08 4 $2,879,900 $719,975 $642,450 10 9 98% 20 Toronto C09 2 $1,910,000 $955,000 $955,000 3 5 96% 20 Toronto C10 5 $3,448,000 $689,600 $650,000 9 4 103% 7 Toronto C11 3 $2,027,000 $675,667 $695,000 3 - 108% 6 Toronto C12 1 $560,000 $560,000 $560,000 4 2 112% 7 Toronto C13 6 $2,899,100 $483,183 $449,500 12 10 100% 26 Toronto C14 - - - - 1 1 - - Toronto C15 21 $10,232,200 $487,248 $478,000 25 13 103% 9 Toronto East 126 $58,262,722 $462,403 $438,250 184 159 101% 15 Toronto E01 29 $14,321,600 $493,848 $477,500 46 40 103% 15 Toronto E02 32 $17,175,421 $536,732 $517,500 38 25 102% 14 Toronto E03 22 $10,886,301 $494,832 $469,750 28 24 101% 13 Toronto E04 7 $2,396,500 $342,357 $329,000 14 16 100% 11 Toronto E05 9 $3,817,500 $424,167 $436,500 13 5 99% 5 Toronto E06 4 $1,598,500 $399,625 $379,500 3 8 99% 17 Toronto E07 6 $2,450,500 $408,417 $399,500 14 12 102% 11 Toronto E08 1 $360,000 $360,000 $360,000 2 3 96% 21 Toronto E09 4 $1,310,900 $327,725 $328,500 7 5 99% 24 Toronto E10 2 $758,500 $379,250 $379,250 1 1 99% 19 Toronto E11 10 $3,187,000 $318,700 $307,500 18 20 98% 25 Page 3 July 2010 Market Watch, July 2011 10
- 11. Toronto Real Estate Board CONDOMINIUM TOWNHOUSES, JULY 2011 Industrial Leasing SUMMARY OF EXISTING HOME TRANSACTIONS ALL TREB AREAS Sales1 Dollar Volume1 Average Price1 Median Price1 New Listings2 Active Listings3 Avg. SP/LP 4 Avg. DOM5 TREB Total 615 - $196,945,465 - $320,237 - $311,000 - 907 - 1,181 - 99% - 25 - Halton Region 29 $8,028,999 $276,862 $245,000 30 49 99% 34 Burlington 7 $1,928,900 $275,557 $284,900 10 19 97% 23 Halton Hills 8 $1,835,000 $229,375 $233,500 5 8 99% 33 Milton 5 $1,528,499 $305,700 $352,500 - - 99% 39 Oakville 9- $2,736,600 - $304,067 - $284,500 - 15 - 22 - 99% - 40 - Peel Region 212 $63,262,056 $298,406 $304,000 322 381 99% 25 Brampton 44 $10,361,100 $235,480 $223,250 67 81 98% 34 Caledon - - - - 2 2 - - Mississauga 168 - $52,900,956 - $314,887 - $321,500 - 253 - 298 - 99% - 23 - City of Toronto 237 $82,959,362 $350,040 $334,000 355 472 99% 23 ! TURN PAGE FOR CITY OF TORONTO TABLES OR CLICK HERE: - - - - - - - - York Region 81 $30,102,698 $371,638 $349,000 111 132 99% 22 Aurora 8 $3,486,500 $435,813 $392,000 11 15 98% 19 E. Gwillimbury - - - - - - - - Georgina - - - - 1 4 - - King - - - - 1 3 - - Markham 29 $10,344,810 $356,718 $325,000 45 56 99% 27 Newmarket 10 $3,028,200 $302,820 $272,450 10 8 99% 15 Richmond Hill 19 $7,322,388 $385,389 $402,000 25 27 100% 18 Vaughan 13 $5,493,800 $422,600 $371,000 15 16 99% 27 Whitchurch-Stouffville 2- $427,000 - $213,500 - $213,500 - 3- 3- 96% - 15 - Durham Region 50 $11,461,050 $229,221 $215,500 80 131 97% 36 Ajax 11 $2,449,000 $222,636 $215,000 10 18 97% 35 Brock 1 $170,000 $170,000 $170,000 2 6 97% 12 Clarington 3 $1,128,000 $376,000 $298,000 6 12 96% 61 Oshawa 8 $1,208,150 $151,019 $154,200 19 39 97% 36 Pickering 20 $4,903,900 $245,195 $229,500 27 31 98% 36 Scugog - - - - 1 1 - - Uxbridge - - - - 3 5 - - Whitby 7- $1,602,000 - $228,857 - $204,000 - 12 - 19 - 96% - 29 - Dufferin County 4 $763,500 $190,875 $194,000 5 5 98% 20 Orangeville 4 - $763,500 - $190,875 - $194,000 - 5 - 5 - 98% - 20 - Simcoe County 2 $367,800 $183,900 $183,900 4 11 100% 30 Adjala-Tosorontio - - - - - - - - Bradford West Gwillimbury - - - - 1 3 - - Essa - - - - - - - - Innisfil - - - - - - - - New Tecumseth 2 $367,800 $183,900 $183,900 3 8 100% 30 Page 3 July 2010 Market Watch, July 2011 11