SlideShare uma empresa Scribd logo
1 de 13
Baixar para ler offline
Regional Housing Market Tables
City of Toronto: East

September 2011
Toronto Real Estate Board                                                                                                                                   Regional Housing Market Tables

City of Toronto, Toronto East                                                                                                                                                 SEPTEMBER 2011
                                                1                          1                      1                     1                      2                       3                4                  5
                                         Sales             Dollar Volume          Average Price          Median Price            New Listings          Active Listings     Avg. SP/LP           Avg. DOM
All Home Types                            910               $376,303,759             $413,521               $379,500                 1,727                  1,856             100%                 23
 Detached                                 411               $207,476,513             $504,809               $460,000                  786                    662              100%                 19
 Semi-Detached                            143                $68,040,978             $475,811               $445,000                  252                    174              102%                 16
 Condominium Townhouse                     76                $21,764,648             $286,377               $279,000                  133                    167              99%                  25
 Condominium Apartment                    213                $50,232,299             $235,832               $225,500                  459                    769              98%                  34
 Link                                      11                 $4,653,800             $423,073               $415,000                   16                     14              98%                  24
 Att/Row/Townhouse                         52                $23,423,521             $450,452               $409,125                   75                     64              103%                 19
 Co-Operative Apartment                    4                   $712,000              $178,000               $178,500                   5                      4               95%                  66
 Detached Condominium                      0                      $0                    -                      -                       1                      2                 -                   -
 Co-Ownership Apartment                    0                      $0                    -                      -                       0                      0                 -                   -


                                                                                                                                                                                            6
City of Toronto, Toronto East                                                                                                                         YEAR-TO-DATE 2011

                                         Sales1            Dollar Volume1         Average Price1         Median Price1           New Listings2          Avg. SP/LP 4       Avg. DOM5
All Home Types                           7,981             $3,202,990,373            $401,327               $375,000                13,408                  100%               21
 Detached                                3,468             $1,739,081,205            $501,465               $443,900                 5,622                  101%               17
 Semi-Detached                           1,216              $576,406,288             $474,018               $440,000                 1,860                  102%               14
 Condominium Townhouse                    717               $200,750,669             $279,987               $280,000                 1,191                  99%                26
 Condominium Apartment                   2,043              $468,395,488             $229,268               $215,000                 3,892                  98%                33
 Link                                     107               $43,812,470              $409,462               $412,000                  166                   102%               16
 Att/Row/Townhouse                        400               $168,252,953             $420,632               $389,000                  619                   101%               18
 Co-Operative Apartment                    23                $3,994,700              $173,683               $147,000                   45                   96%                40
 Detached Condominium                      4                 $1,353,700              $338,425               $287,500                   11                   98%                23
 Co-Ownership Apartment                    3                  $942,900               $314,300               $370,000                   2                    104%               75


NOTES
1
 Sales, dollar volume, average sale prices and median sale prices are based on firm transactions entered into the TorontoMLS® system between the first
and last day of the month/period being reported.
2
 New listings entered into the TorontoMLS® system between the first and last day of the month/period being reported.
3
 Active listings at the end of the last day of the month/period being reported.
4
 Ratio of the average selling price to the average listing price for firm transactions entered into the TorontoMLS® system between the first and last day
of the month/period being reported.
5
 Average number of days on the market for firm transactions entered into the TorontoMLS® system between the first and last day of the month/period
being reported.
6
 Past monthly and year-to-date figures are revised on a monthly basis.

                                                                                                                                                        Toronto East, September 2011                           2
Toronto Real Estate Board                                                                                                                                   Regional Housing Market Tables

City of Toronto, Toronto E01                                                                                                                                                  SEPTEMBER 2011
                                                1                          1                      1                     1                      2                       3                4                  5
                                         Sales             Dollar Volume          Average Price          Median Price            New Listings          Active Listings     Avg. SP/LP           Avg. DOM
All Home Types                             79               $41,786,571              $528,944               $536,000                  165                    152              103%                 15
 Detached                                  10                $6,547,500              $654,750               $623,500                   37                     37              99%                  17
 Semi-Detached                             42               $22,132,000              $526,952               $529,000                   73                     53              103%                 13
 Condominium Townhouse                     4                 $1,527,000              $381,750               $345,000                   8                      9               100%                 31
 Condominium Apartment                     10                $4,109,500              $410,950               $398,500                   28                     39              100%                 22
 Link                                      0                      -                     -                      -                       0                      0                 -                   -
 Att/Row/Townhouse                         13                $7,470,571              $574,659               $571,000                   19                     14              109%                 8
 Co-Operative Apartment                    0                      -                     -                      -                       0                      0                 -                   -
 Detached Condominium                      0                      -                     -                      -                       0                      0                 -                   -
 Co-Ownership Apartment                    0                      -                     -                      -                       0                      0                 -                   -


                                                                                                                                                                                            6
City of Toronto, Toronto E01                                                                                                                          YEAR-TO-DATE 2011

                                         Sales1            Dollar Volume1         Average Price1         Median Price1           New Listings2          Avg. SP/LP 4       Avg. DOM5
All Home Types                            702               $382,593,015             $545,004               $523,500                 1,192                  103%               14
 Detached                                 161               $106,875,539             $663,823               $625,000                  289                   104%               13
 Semi-Detached                            337               $183,770,883             $545,314               $527,000                  532                   104%               13
 Condominium Townhouse                     39                $14,485,293             $371,418               $345,000                   65                   100%               25
 Condominium Apartment                     78                $33,021,900             $423,358               $424,000                  175                   100%               19
 Link                                      0                      -                     -                      -                       0                      -                 -
 Att/Row/Townhouse                         86                $43,924,400             $510,749               $535,550                  130                   104%               13
 Co-Operative Apartment                    0                      -                     -                      -                       0                      -                 -
 Detached Condominium                      1                  $515,000               $515,000               $515,000                   1                    99%                14
 Co-Ownership Apartment                    0                      -                     -                      -                       0                      -                 -


NOTES
1
 Sales, dollar volume, average sale prices and median sale prices are based on firm transactions entered into the TorontoMLS® system between the first
and last day of the month/period being reported.
2
 New listings entered into the TorontoMLS® system between the first and last day of the month/period being reported.
3
 Active listings at the end of the last day of the month/period being reported.
4
 Ratio of the average selling price to the average listing price for firm transactions entered into the TorontoMLS® system between the first and last day
of the month/period being reported.
5
 Average number of days on the market for firm transactions entered into the TorontoMLS® system between the first and last day of the month/period
being reported.
6
 Past monthly and year-to-date figures are revised on a monthly basis.

                                                                                                                                                        Toronto East, September 2011                           3
Toronto Real Estate Board                                                                                                                                   Regional Housing Market Tables

City of Toronto, Toronto E02                                                                                                                                                  SEPTEMBER 2011
                                                1                          1                      1                     1                      2                       3                4                  5
                                         Sales             Dollar Volume          Average Price          Median Price            New Listings          Active Listings     Avg. SP/LP           Avg. DOM
All Home Types                             76               $46,187,288              $607,727               $558,500                  158                    114              101%                 14
 Detached                                  31               $22,643,788              $730,445               $710,000                   66                     46              101%                 10
 Semi-Detached                             26               $14,167,600              $544,908               $487,750                   49                     31              103%                 10
 Condominium Townhouse                     3                 $1,536,900              $512,300               $360,000                   4                      7               99%                  19
 Condominium Apartment                     5                 $2,193,000              $438,600               $295,000                   25                     23              100%                 24
 Link                                      0                      -                     -                      -                       0                      0                 -                   -
 Att/Row/Townhouse                         10                $5,401,000              $540,100               $547,000                   13                     7               100%                 17
 Co-Operative Apartment                    1                  $245,000               $245,000               $245,000                   1                      0               94%                 134
 Detached Condominium                      0                      -                     -                      -                       0                      0                 -                   -
 Co-Ownership Apartment                    0                      -                     -                      -                       0                      0                 -                   -


                                                                                                                                                                                            6
City of Toronto, Toronto E02                                                                                                                          YEAR-TO-DATE 2011

                                         Sales1            Dollar Volume1         Average Price1         Median Price1           New Listings2          Avg. SP/LP 4       Avg. DOM5
All Home Types                            686               $429,445,967             $626,015               $545,000                 1,148                  101%               14
 Detached                                 257               $208,148,329             $809,916               $727,000                  434                   101%               13
 Semi-Detached                            277               $148,478,938             $536,025               $499,000                  421                   102%               12
 Condominium Townhouse                     30                $15,158,900             $505,297               $464,000                   60                   98%                20
 Condominium Apartment                     62                $26,857,400             $433,184               $402,500                  127                   99%                20
 Link                                      0                       -                    -                      -                       0                      -                 -
 Att/Row/Townhouse                         53                $28,600,400             $539,630               $520,000                   88                   101%               15
 Co-Operative Apartment                    5                  $1,450,500             $290,100               $285,000                   15                   95%                52
 Detached Condominium                      0                       -                    -                      -                       1                      -                 -
 Co-Ownership Apartment                    2                   $751,500              $375,750               $375,750                   2                    105%               13


NOTES
1
 Sales, dollar volume, average sale prices and median sale prices are based on firm transactions entered into the TorontoMLS® system between the first
and last day of the month/period being reported.
2
 New listings entered into the TorontoMLS® system between the first and last day of the month/period being reported.
3
 Active listings at the end of the last day of the month/period being reported.
4
 Ratio of the average selling price to the average listing price for firm transactions entered into the TorontoMLS® system between the first and last day
of the month/period being reported.
5
 Average number of days on the market for firm transactions entered into the TorontoMLS® system between the first and last day of the month/period
being reported.
6
 Past monthly and year-to-date figures are revised on a monthly basis.

                                                                                                                                                        Toronto East, September 2011                           4
Toronto Real Estate Board                                                                                                                                   Regional Housing Market Tables

City of Toronto, Toronto E03                                                                                                                                                  SEPTEMBER 2011
                                                1                          1                      1                     1                      2                       3                4                  5
                                         Sales             Dollar Volume          Average Price          Median Price            New Listings          Active Listings     Avg. SP/LP           Avg. DOM
All Home Types                             97               $47,831,665              $493,110               $463,000                  209                    167              102%                 22
 Detached                                  57               $29,185,475              $512,026               $465,000                  136                    105              101%                 23
 Semi-Detached                             31               $16,344,690              $527,248               $470,000                   52                     26              102%                 15
 Condominium Townhouse                     0                      -                     -                      -                       0                      1                 -                   -
 Condominium Apartment                     6                  $937,000               $156,167               $142,500                   17                     29              98%                  49
 Link                                      0                      -                     -                      -                       0                      0                 -                   -
 Att/Row/Townhouse                         3                 $1,364,500              $454,833               $410,000                   4                      6               102%                 26
 Co-Operative Apartment                    0                      -                     -                      -                       0                      0                 -                   -
 Detached Condominium                      0                      -                     -                      -                       0                      0                 -                   -
 Co-Ownership Apartment                    0                      -                     -                      -                       0                      0                 -                   -


                                                                                                                                                                                            6
City of Toronto, Toronto E03                                                                                                                          YEAR-TO-DATE 2011

                                         Sales1            Dollar Volume1         Average Price1         Median Price1           New Listings2          Avg. SP/LP 4       Avg. DOM5
All Home Types                            922               $411,507,600             $446,321               $432,500                 1,545                  102%               20
 Detached                                 505               $261,345,530             $517,516               $470,000                  881                   102%               17
 Semi-Detached                            205               $101,829,119             $496,727               $480,000                  318                   103%               14
 Condominium Townhouse                     11                 $3,277,800             $297,982               $294,000                   12                   98%                37
 Condominium Apartment                    185                $38,164,051             $206,292               $177,000                  299                   97%                33
 Link                                      0                       -                    -                      -                       0                      -                 -
 Att/Row/Townhouse                         15                 $6,699,700             $446,647               $410,000                   35                   101%               20
 Co-Operative Apartment                    0                       -                    -                      -                       0                      -                 -
 Detached Condominium                      0                       -                    -                      -                       0                      -                 -
 Co-Ownership Apartment                    1                   $191,400              $191,400               $191,400                   0                    101%              198


NOTES
1
 Sales, dollar volume, average sale prices and median sale prices are based on firm transactions entered into the TorontoMLS® system between the first
and last day of the month/period being reported.
2
 New listings entered into the TorontoMLS® system between the first and last day of the month/period being reported.
3
 Active listings at the end of the last day of the month/period being reported.
4
 Ratio of the average selling price to the average listing price for firm transactions entered into the TorontoMLS® system between the first and last day
of the month/period being reported.
5
 Average number of days on the market for firm transactions entered into the TorontoMLS® system between the first and last day of the month/period
being reported.
6
 Past monthly and year-to-date figures are revised on a monthly basis.

                                                                                                                                                        Toronto East, September 2011                           5
Toronto Real Estate Board                                                                                                                                   Regional Housing Market Tables

City of Toronto, Toronto E04                                                                                                                                                  SEPTEMBER 2011
                                                1                          1                      1                     1                      2                       3                4                  5
                                         Sales             Dollar Volume          Average Price          Median Price            New Listings          Active Listings     Avg. SP/LP           Avg. DOM
All Home Types                             97               $31,069,255              $320,302               $353,000                  168                    199              100%                 28
 Detached                                  51               $20,298,907              $398,018               $392,000                   83                     67              101%                 17
 Semi-Detached                             13                $4,247,300              $326,715               $348,000                   11                     9               98%                  27
 Condominium Townhouse                     4                 $1,145,098              $286,275               $281,499                   20                     26              98%                  20
 Condominium Apartment                     27                $4,859,700              $179,989               $152,000                   52                     93              97%                  44
 Link                                      0                      -                     -                      -                       0                      0                 -                   -
 Att/Row/Townhouse                         1                  $408,250               $408,250               $408,250                   2                      4               97%                  62
 Co-Operative Apartment                    1                  $110,000               $110,000               $110,000                   0                      0               98%                 117
 Detached Condominium                      0                      -                     -                      -                       0                      0                 -                   -
 Co-Ownership Apartment                    0                      -                     -                      -                       0                      0                 -                   -


                                                                                                                                                                                            6
City of Toronto, Toronto E04                                                                                                                          YEAR-TO-DATE 2011

                                         Sales1            Dollar Volume1         Average Price1         Median Price1           New Listings2          Avg. SP/LP 4       Avg. DOM5
All Home Types                            798               $259,633,046             $325,355               $347,700                 1,335                  100%               22
 Detached                                 409               $164,094,525             $401,209               $391,000                  614                   101%               15
 Semi-Detached                             61                $19,996,600             $327,813               $318,000                   99                   99%                17
 Condominium Townhouse                     86                $25,637,958             $298,116               $304,990                  182                   99%                22
 Condominium Apartment                    213                $40,481,425             $190,054               $193,000                  402                   97%                35
 Link                                      0                       -                    -                      -                       0                      -                 -
 Att/Row/Townhouse                         23                 $8,588,538             $373,415               $389,000                   31                   99%                42
 Co-Operative Apartment                    6                   $834,000              $139,000               $117,000                   7                    94%                56
 Detached Condominium                      0                       -                    -                      -                       0                      -                 -
 Co-Ownership Apartment                    0                       -                    -                      -                       0                      -                 -


NOTES
1
 Sales, dollar volume, average sale prices and median sale prices are based on firm transactions entered into the TorontoMLS® system between the first
and last day of the month/period being reported.
2
 New listings entered into the TorontoMLS® system between the first and last day of the month/period being reported.
3
 Active listings at the end of the last day of the month/period being reported.
4
 Ratio of the average selling price to the average listing price for firm transactions entered into the TorontoMLS® system between the first and last day
of the month/period being reported.
5
 Average number of days on the market for firm transactions entered into the TorontoMLS® system between the first and last day of the month/period
being reported.
6
 Past monthly and year-to-date figures are revised on a monthly basis.

                                                                                                                                                        Toronto East, September 2011                           6
Toronto Real Estate Board                                                                                                                                   Regional Housing Market Tables

City of Toronto, Toronto E05                                                                                                                                                  SEPTEMBER 2011
                                                1                          1                      1                     1                      2                       3                4                  5
                                         Sales             Dollar Volume          Average Price          Median Price            New Listings          Active Listings     Avg. SP/LP           Avg. DOM
All Home Types                            104               $42,792,838              $411,470               $391,900                  160                    153              101%                 19
 Detached                                  41               $24,034,538              $586,208               $572,138                   59                     43              102%                 14
 Semi-Detached                             5                 $2,124,800              $424,960               $418,000                   11                     6               104%                 9
 Condominium Townhouse                     22                $6,769,000              $307,682               $302,000                   33                     27              101%                 23
 Condominium Apartment                     30                $7,315,500              $243,850               $235,000                   51                     72              98%                  23
 Link                                      3                 $1,354,000              $451,333               $455,000                   3                      3               98%                  21
 Att/Row/Townhouse                         3                 $1,195,000              $398,333               $405,000                   3                      2               102%                 21
 Co-Operative Apartment                    0                      -                     -                      -                       0                      0                 -                   -
 Detached Condominium                      0                      -                     -                      -                       0                      0                 -                   -
 Co-Ownership Apartment                    0                      -                     -                      -                       0                      0                 -                   -


                                                                                                                                                                                            6
City of Toronto, Toronto E05                                                                                                                          YEAR-TO-DATE 2011

                                         Sales1            Dollar Volume1         Average Price1         Median Price1           New Listings2          Avg. SP/LP 4       Avg. DOM5
All Home Types                            888               $327,562,988             $368,877               $330,000                 1,294                  101%               18
 Detached                                 255               $141,906,504             $556,496               $552,000                  399                   103%               12
 Semi-Detached                             63                $25,744,388             $408,641               $402,000                   79                   101%               9
 Condominium Townhouse                    189                $55,151,452             $291,807               $288,000                  254                   101%               17
 Condominium Apartment                    321                $79,204,226             $246,742               $236,900                  485                   98%                26
 Link                                      36                $16,301,618             $452,823               $457,400                   48                   102%               16
 Att/Row/Townhouse                         24                 $9,254,800             $385,617               $386,000                   29                   103%               11
 Co-Operative Apartment                    0                       -                    -                      -                       0                      -                 -
 Detached Condominium                      0                       -                    -                      -                       0                      -                 -
 Co-Ownership Apartment                    0                       -                    -                      -                       0                      -                 -


NOTES
1
 Sales, dollar volume, average sale prices and median sale prices are based on firm transactions entered into the TorontoMLS® system between the first
and last day of the month/period being reported.
2
 New listings entered into the TorontoMLS® system between the first and last day of the month/period being reported.
3
 Active listings at the end of the last day of the month/period being reported.
4
 Ratio of the average selling price to the average listing price for firm transactions entered into the TorontoMLS® system between the first and last day
of the month/period being reported.
5
 Average number of days on the market for firm transactions entered into the TorontoMLS® system between the first and last day of the month/period
being reported.
6
 Past monthly and year-to-date figures are revised on a monthly basis.

                                                                                                                                                        Toronto East, September 2011                           7
Toronto Real Estate Board                                                                                                                                   Regional Housing Market Tables

City of Toronto, Toronto E06                                                                                                                                                  SEPTEMBER 2011
                                                1                          1                      1                     1                      2                       3                4                  5
                                         Sales             Dollar Volume          Average Price          Median Price            New Listings          Active Listings     Avg. SP/LP           Avg. DOM
All Home Types                             47               $21,128,550              $449,544               $390,000                   84                    69               99%                  21
 Detached                                  37               $17,568,650              $474,828               $440,000                   69                    52               99%                  15
 Semi-Detached                             5                 $2,044,900              $408,980               $355,000                   5                     4                100%                 46
 Condominium Townhouse                     0                      -                     -                      -                       0                     1                  -                   -
 Condominium Apartment                     4                 $1,305,000              $326,250               $316,750                   7                     7                99%                  49
 Link                                      0                      -                     -                      -                       0                     0                  -                   -
 Att/Row/Townhouse                         0                      -                     -                      -                       1                     3                  -                   -
 Co-Operative Apartment                    1                  $210,000               $210,000               $210,000                   2                     2                92%                  9
 Detached Condominium                      0                      -                     -                      -                       0                     0                  -                   -
 Co-Ownership Apartment                    0                      -                     -                      -                       0                     0                  -                   -


                                                                                                                                                                                            6
City of Toronto, Toronto E06                                                                                                                          YEAR-TO-DATE 2011

                                         Sales1            Dollar Volume1         Average Price1         Median Price1           New Listings2          Avg. SP/LP 4       Avg. DOM5
All Home Types                            444               $200,410,605             $451,375               $403,050                  741                   99%                21
 Detached                                 328               $156,199,914             $476,219               $417,000                  546                   99%                19
 Semi-Detached                             50                $18,982,701             $379,654               $345,500                   82                   99%                24
 Condominium Townhouse                     6                  $1,952,990             $325,498               $317,500                   9                    101%               24
 Condominium Apartment                     34                $11,528,100             $339,062               $308,450                   54                   99%                33
 Link                                      0                       -                    -                      -                       0                      -                 -
 Att/Row/Townhouse                         25                $11,536,900             $461,476               $450,000                   46                   99%                24
 Co-Operative Apartment                    1                   $210,000              $210,000               $210,000                   4                    92%                9
 Detached Condominium                      0                       -                    -                      -                       0                      -                 -
 Co-Ownership Apartment                    0                       -                    -                      -                       0                      -                 -


NOTES
1
 Sales, dollar volume, average sale prices and median sale prices are based on firm transactions entered into the TorontoMLS® system between the first
and last day of the month/period being reported.
2
 New listings entered into the TorontoMLS® system between the first and last day of the month/period being reported.
3
 Active listings at the end of the last day of the month/period being reported.
4
 Ratio of the average selling price to the average listing price for firm transactions entered into the TorontoMLS® system between the first and last day
of the month/period being reported.
5
 Average number of days on the market for firm transactions entered into the TorontoMLS® system between the first and last day of the month/period
being reported.
6
 Past monthly and year-to-date figures are revised on a monthly basis.

                                                                                                                                                        Toronto East, September 2011                           8
Toronto Real Estate Board                                                                                                                                   Regional Housing Market Tables

City of Toronto, Toronto E07                                                                                                                                                  SEPTEMBER 2011
                                                1                          1                      1                     1                      2                       3                4                  5
                                         Sales             Dollar Volume          Average Price          Median Price            New Listings          Active Listings     Avg. SP/LP           Avg. DOM
All Home Types                             94               $34,059,154              $362,331               $344,900                  204                    251              100%                 24
 Detached                                  34               $16,814,566              $494,546               $497,904                   68                     52              101%                 15
 Semi-Detached                             5                 $1,982,888              $396,578               $408,000                   14                     10              99%                  18
 Condominium Townhouse                     8                 $2,448,000              $306,000               $296,000                   13                     11              100%                 17
 Condominium Apartment                     38                $9,215,400              $242,511               $235,875                   92                    165              98%                  34
 Link                                      6                 $2,532,300              $422,050               $435,000                   9                      7               98%                  27
 Att/Row/Townhouse                         3                 $1,066,000              $355,333               $353,000                   8                      6               98%                  18
 Co-Operative Apartment                    0                      -                     -                      -                       0                      0                 -                   -
 Detached Condominium                      0                      -                     -                      -                       0                      0                 -                   -
 Co-Ownership Apartment                    0                      -                     -                      -                       0                      0                 -                   -


                                                                                                                                                                                            6
City of Toronto, Toronto E07                                                                                                                          YEAR-TO-DATE 2011

                                         Sales1            Dollar Volume1         Average Price1         Median Price1           New Listings2          Avg. SP/LP 4       Avg. DOM5
All Home Types                            771               $287,900,795             $373,412               $374,000                 1,357                  100%               20
 Detached                                 301               $153,505,346             $509,985               $488,000                  459                   101%               14
 Semi-Detached                             72                $28,393,242             $394,351               $390,750                   99                   101%               14
 Condominium Townhouse                     67                $20,057,126             $299,360               $294,000                   96                   101%               18
 Condominium Apartment                    245                $53,445,441             $218,145               $222,000                  572                   97%                31
 Link                                      54                $21,530,052             $398,705               $392,000                   85                   102%               14
 Att/Row/Townhouse                         31                $10,745,588             $346,632               $348,000                   45                   101%               12
 Co-Operative Apartment                    1                  $224,000               $224,000               $224,000                   1                    98%                23
 Detached Condominium                      0                      -                     -                      -                       0                      -                 -
 Co-Ownership Apartment                    0                      -                     -                      -                       0                      -                 -


NOTES
1
 Sales, dollar volume, average sale prices and median sale prices are based on firm transactions entered into the TorontoMLS® system between the first
and last day of the month/period being reported.
2
 New listings entered into the TorontoMLS® system between the first and last day of the month/period being reported.
3
 Active listings at the end of the last day of the month/period being reported.
4
 Ratio of the average selling price to the average listing price for firm transactions entered into the TorontoMLS® system between the first and last day
of the month/period being reported.
5
 Average number of days on the market for firm transactions entered into the TorontoMLS® system between the first and last day of the month/period
being reported.
6
 Past monthly and year-to-date figures are revised on a monthly basis.

                                                                                                                                                        Toronto East, September 2011                           9
Toronto Real Estate Board                                                                                                                                   Regional Housing Market Tables

City of Toronto, Toronto E08                                                                                                                                                  SEPTEMBER 2011
                                                1                          1                      1                     1                      2                       3                4                  5
                                         Sales             Dollar Volume          Average Price          Median Price            New Listings          Active Listings     Avg. SP/LP           Avg. DOM
All Home Types                             68               $30,351,001              $446,338               $372,650                   98                    141              97%                  27
 Detached                                  44               $25,294,301              $574,870               $436,950                   61                     64              96%                  23
 Semi-Detached                             0                      -                     -                      -                       0                      1                -                    -
 Condominium Townhouse                     5                 $1,387,000              $277,400               $260,000                   11                     19              99%                  24
 Condominium Apartment                     19                $3,669,700              $193,142               $170,100                   23                     53              96%                  37
 Link                                      0                      -                     -                      -                       0                      0                -                    -
 Att/Row/Townhouse                         0                      -                     -                      -                       3                      3                -                    -
 Co-Operative Apartment                    0                      -                     -                      -                       0                      0                -                    -
 Detached Condominium                      0                      -                     -                      -                       0                      1                -                    -
 Co-Ownership Apartment                    0                      -                     -                      -                       0                      0                -                    -


                                                                                                                                                                                            6
City of Toronto, Toronto E08                                                                                                                          YEAR-TO-DATE 2011

                                         Sales1            Dollar Volume1         Average Price1         Median Price1           New Listings2          Avg. SP/LP 4       Avg. DOM5
All Home Types                            627               $225,684,550             $359,943               $347,500                 1,033                  98%                29
 Detached                                 357               $169,208,200             $473,973               $400,000                  565                   98%                21
 Semi-Detached                             14                 $4,129,500             $294,964               $286,500                   15                   98%                36
 Condominium Townhouse                     52                $13,547,450             $260,528               $261,250                  103                   98%                32
 Condominium Apartment                    188                $32,672,800             $173,791               $165,900                  323                   96%                43
 Link                                      2                   $820,100              $410,050               $410,050                   6                    106%               4
 Att/Row/Townhouse                         14                 $5,306,500             $379,036               $363,500                   20                   98%                17
 Co-Operative Apartment                    0                       -                    -                      -                       0                      -                 -
 Detached Condominium                      0                       -                    -                      -                       1                      -                 -
 Co-Ownership Apartment                    0                       -                    -                      -                       0                      -                 -


NOTES
1
 Sales, dollar volume, average sale prices and median sale prices are based on firm transactions entered into the TorontoMLS® system between the first
and last day of the month/period being reported.
2
 New listings entered into the TorontoMLS® system between the first and last day of the month/period being reported.
3
 Active listings at the end of the last day of the month/period being reported.
4
 Ratio of the average selling price to the average listing price for firm transactions entered into the TorontoMLS® system between the first and last day
of the month/period being reported.
5
 Average number of days on the market for firm transactions entered into the TorontoMLS® system between the first and last day of the month/period
being reported.
6
 Past monthly and year-to-date figures are revised on a monthly basis.

                                                                                                                                                        Toronto East, September 2011                    10
Toronto Real Estate Board                                                                                                                                   Regional Housing Market Tables

City of Toronto, Toronto E09                                                                                                                                                  SEPTEMBER 2011
                                                1                          1                      1                     1                      2                       3                4                  5
                                         Sales             Dollar Volume          Average Price          Median Price            New Listings          Active Listings     Avg. SP/LP           Avg. DOM
All Home Types                            114               $34,379,399              $301,574               $292,000                  208                    274              98%                  30
 Detached                                  44               $17,305,500              $393,307               $370,500                   80                     69              99%                  22
 Semi-Detached                             4                 $1,207,000              $301,750               $300,500                   3                      5               96%                  36
 Condominium Townhouse                     7                 $1,450,000              $207,143               $217,000                   13                     18              98%                  31
 Condominium Apartment                     57               $13,632,099              $239,160               $236,000                  111                    181              97%                  35
 Link                                      0                      -                     -                      -                       0                      0                -                    -
 Att/Row/Townhouse                         2                  $784,800               $392,400               $392,400                   1                      1               99%                  36
 Co-Operative Apartment                    0                      -                     -                      -                       0                      0                -                    -
 Detached Condominium                      0                      -                     -                      -                       0                      0                -                    -
 Co-Ownership Apartment                    0                      -                     -                      -                       0                      0                -                    -


                                                                                                                                                                                            6
City of Toronto, Toronto E09                                                                                                                          YEAR-TO-DATE 2011

                                         Sales1            Dollar Volume1         Average Price1         Median Price1           New Listings2          Avg. SP/LP 4       Avg. DOM5
All Home Types                            962               $279,277,974             $290,310               $275,300                 1,699                   98%               28
 Detached                                 354               $135,511,384             $382,801               $375,000                  550                    99%               19
 Semi-Detached                             27                 $8,474,745             $313,879               $315,000                   32                    99%               28
 Condominium Townhouse                     86                $17,098,850             $198,824               $206,500                  138                    97%               43
 Condominium Apartment                    488               $115,459,195             $236,597               $235,000                  966                    98%               31
 Link                                      0                       -                    -                      -                       0                      -                 -
 Att/Row/Townhouse                         7                  $2,733,800             $390,543               $395,000                   13                    98%               19
 Co-Operative Apartment                    0                       -                    -                      -                       0                      -                 -
 Detached Condominium                      0                       -                    -                      -                       0                      -                 -
 Co-Ownership Apartment                    0                       -                    -                      -                       0                      -                 -


NOTES
1
 Sales, dollar volume, average sale prices and median sale prices are based on firm transactions entered into the TorontoMLS® system between the first
and last day of the month/period being reported.
2
 New listings entered into the TorontoMLS® system between the first and last day of the month/period being reported.
3
 Active listings at the end of the last day of the month/period being reported.
4
 Ratio of the average selling price to the average listing price for firm transactions entered into the TorontoMLS® system between the first and last day
of the month/period being reported.
5
 Average number of days on the market for firm transactions entered into the TorontoMLS® system between the first and last day of the month/period
being reported.
6
 Past monthly and year-to-date figures are revised on a monthly basis.

                                                                                                                                                        Toronto East, September 2011                    11
Toronto Real Estate Board                                                                                                                                   Regional Housing Market Tables

City of Toronto, Toronto E10                                                                                                                                                  SEPTEMBER 2011
                                                1                          1                      1                     1                      2                       3                4                  5
                                         Sales             Dollar Volume          Average Price          Median Price            New Listings          Active Listings     Avg. SP/LP           Avg. DOM
All Home Types                             41               $16,561,100              $403,929               $373,000                  102                    115              98%                  18
 Detached                                  26               $12,540,500              $482,327               $427,500                   69                     71              98%                  17
 Semi-Detached                             3                  $913,900               $304,633               $308,000                   8                      6               98%                  14
 Condominium Townhouse                     5                 $1,051,300              $210,260               $210,000                   12                     16              97%                  29
 Condominium Apartment                     1                  $162,500               $162,500               $162,500                   7                      17              99%                  2
 Link                                      0                      -                     -                      -                       0                      0                 -                   -
 Att/Row/Townhouse                         5                 $1,745,900              $349,180               $350,000                   4                      3               100%                 25
 Co-Operative Apartment                    1                  $147,000               $147,000               $147,000                   2                      2               98%                  5
 Detached Condominium                      0                      -                     -                      -                       0                      0                 -                   -
 Co-Ownership Apartment                    0                      -                     -                      -                       0                      0                 -                   -


                                                                                                                                                                                            6
City of Toronto, Toronto E10                                                                                                                          YEAR-TO-DATE 2011

                                         Sales1            Dollar Volume1         Average Price1         Median Price1           New Listings2          Avg. SP/LP 4       Avg. DOM5
All Home Types                            416               $170,342,917             $409,478               $404,000                  697                   99%                21
 Detached                                 292               $137,921,695             $472,335               $445,500                  481                   99%                18
 Semi-Detached                             20                 $6,909,686             $345,484               $324,950                   31                   100%               14
 Condominium Townhouse                     36                 $7,902,050             $219,501               $216,450                   68                   98%                34
 Condominium Apartment                     23                 $3,567,000             $155,087               $149,000                   55                   96%                34
 Link                                      0                       -                    -                      -                       0                      -                 -
 Att/Row/Townhouse                         35                $12,766,286             $364,751               $358,000                   45                   99%                23
 Co-Operative Apartment                    10                 $1,276,200             $127,620               $140,000                   17                   97%                29
 Detached Condominium                      0                       -                    -                      -                       0                      -                 -
 Co-Ownership Apartment                    0                       -                    -                      -                       0                      -                 -


NOTES
1
 Sales, dollar volume, average sale prices and median sale prices are based on firm transactions entered into the TorontoMLS® system between the first
and last day of the month/period being reported.
2
 New listings entered into the TorontoMLS® system between the first and last day of the month/period being reported.
3
 Active listings at the end of the last day of the month/period being reported.
4
 Ratio of the average selling price to the average listing price for firm transactions entered into the TorontoMLS® system between the first and last day
of the month/period being reported.
5
 Average number of days on the market for firm transactions entered into the TorontoMLS® system between the first and last day of the month/period
being reported.
6
 Past monthly and year-to-date figures are revised on a monthly basis.

                                                                                                                                                        Toronto East, September 2011                    12
Toronto Real Estate Board                                                                                                                                   Regional Housing Market Tables

City of Toronto, Toronto E11                                                                                                                                                  SEPTEMBER 2011
                                                1                          1                      1                     1                      2                       3                4                  5
                                         Sales             Dollar Volume          Average Price          Median Price            New Listings          Active Listings     Avg. SP/LP           Avg. DOM
All Home Types                             93               $30,156,938              $324,268               $317,000                  171                    221              98%                  26
 Detached                                  36               $15,242,788              $423,411               $382,950                   58                     56              98%                  25
 Semi-Detached                             9                 $2,875,900              $319,544               $287,000                   26                     23              100%                 17
 Condominium Townhouse                     18                $4,450,350              $247,242               $224,250                   19                     32              98%                  30
 Condominium Apartment                     16                $2,832,900              $177,056               $174,750                   46                     90              96%                  31
 Link                                      2                  $767,500               $383,750               $383,750                   4                      4               100%                 18
 Att/Row/Townhouse                         12                $3,987,500              $332,292               $328,000                   17                     15              100%                 22
 Co-Operative Apartment                    0                      -                     -                      -                       0                      0                 -                   -
 Detached Condominium                      0                      -                     -                      -                       1                      1                 -                   -
 Co-Ownership Apartment                    0                      -                     -                      -                       0                      0                 -                   -


                                                                                                                                                                                            6
City of Toronto, Toronto E11                                                                                                                          YEAR-TO-DATE 2011

                                         Sales1            Dollar Volume1         Average Price1         Median Price1           New Listings2          Avg. SP/LP 4       Avg. DOM5
All Home Types                            765               $228,630,916             $298,864               $289,000                 1,367                  99%                28
 Detached                                 249               $104,364,239             $419,133               $410,000                  404                   99%                21
 Semi-Detached                             90                $29,696,486             $329,961               $319,500                  152                   100%               14
 Condominium Townhouse                    115                $26,480,800             $230,268               $217,500                  204                   97%                32
 Condominium Apartment                    206                $33,993,950             $165,019               $162,750                  434                   97%                46
 Link                                      15                 $5,160,700             $344,047               $334,600                   27                   99%                26
 Att/Row/Townhouse                         87                $28,096,041             $322,943               $319,900                  137                   99%                20
 Co-Operative Apartment                    0                       -                    -                      -                       1                      -                 -
 Detached Condominium                      3                   $838,700              $279,567               $285,000                   8                    97%                26
 Co-Ownership Apartment                    0                       -                    -                      -                       0                      -                 -


NOTES
1
 Sales, dollar volume, average sale prices and median sale prices are based on firm transactions entered into the TorontoMLS® system between the first
and last day of the month/period being reported.
2
 New listings entered into the TorontoMLS® system between the first and last day of the month/period being reported.
3
 Active listings at the end of the last day of the month/period being reported.
4
 Ratio of the average selling price to the average listing price for firm transactions entered into the TorontoMLS® system between the first and last day
of the month/period being reported.
5
 Average number of days on the market for firm transactions entered into the TorontoMLS® system between the first and last day of the month/period
being reported.
6
 Past monthly and year-to-date figures are revised on a monthly basis.

                                                                                                                                                        Toronto East, September 2011                    13

Mais conteúdo relacionado

Mais procurados

Toronto Central Community Real Estate Reports December 2012
Toronto Central Community Real Estate Reports December 2012Toronto Central Community Real Estate Reports December 2012
Toronto Central Community Real Estate Reports December 2012Trish Bongard Godfrey
 
North Texas MLS Sales Activity May 2012
North Texas MLS Sales Activity May 2012North Texas MLS Sales Activity May 2012
North Texas MLS Sales Activity May 2012Rick Michels
 
All schools
All schoolsAll schools
All schoolsMoCoRE
 
Deutsche EuroShop | Annual Report 2011 | Financials
Deutsche EuroShop | Annual Report 2011 | Financials Deutsche EuroShop | Annual Report 2011 | Financials
Deutsche EuroShop | Annual Report 2011 | Financials Deutsche EuroShop AG
 
First time home buyer
First time home buyerFirst time home buyer
First time home buyerLacy Williams
 
starbucks Annual_Report_2004_part2
starbucks  Annual_Report_2004_part2starbucks  Annual_Report_2004_part2
starbucks Annual_Report_2004_part2finance41
 
Puget Sound Q4 2012 Office Market
Puget Sound Q4 2012 Office MarketPuget Sound Q4 2012 Office Market
Puget Sound Q4 2012 Office MarketGilWhiteCRE
 
Snapshot: NAR Profile of Home Buyers and Sellers
Snapshot: NAR Profile of Home Buyers and SellersSnapshot: NAR Profile of Home Buyers and Sellers
Snapshot: NAR Profile of Home Buyers and SellersNar Res
 
Mafia Wars Expense Guide
Mafia Wars Expense GuideMafia Wars Expense Guide
Mafia Wars Expense Guideguest26cede
 
Solon OH Real Estate Market. How many months needed to sell existing invento...
 Solon OH Real Estate Market. How many months needed to sell existing invento... Solon OH Real Estate Market. How many months needed to sell existing invento...
Solon OH Real Estate Market. How many months needed to sell existing invento...Svetlana Stolyarova
 

Mais procurados (15)

Toronto Central Community Real Estate Reports December 2012
Toronto Central Community Real Estate Reports December 2012Toronto Central Community Real Estate Reports December 2012
Toronto Central Community Real Estate Reports December 2012
 
Toronto Central Community Market Charts for the 4th Quarter 2012
Toronto Central Community Market Charts for the 4th Quarter 2012Toronto Central Community Market Charts for the 4th Quarter 2012
Toronto Central Community Market Charts for the 4th Quarter 2012
 
Tmo Feb
Tmo FebTmo Feb
Tmo Feb
 
Jan Tmo
Jan TmoJan Tmo
Jan Tmo
 
North Texas MLS Sales Activity May 2012
North Texas MLS Sales Activity May 2012North Texas MLS Sales Activity May 2012
North Texas MLS Sales Activity May 2012
 
All schools
All schoolsAll schools
All schools
 
Deutsche EuroShop | Annual Report 2011 | Financials
Deutsche EuroShop | Annual Report 2011 | Financials Deutsche EuroShop | Annual Report 2011 | Financials
Deutsche EuroShop | Annual Report 2011 | Financials
 
22152reportfeb2011
22152reportfeb201122152reportfeb2011
22152reportfeb2011
 
First time home buyer
First time home buyerFirst time home buyer
First time home buyer
 
starbucks Annual_Report_2004_part2
starbucks  Annual_Report_2004_part2starbucks  Annual_Report_2004_part2
starbucks Annual_Report_2004_part2
 
Puget Sound Q4 2012 Office Market
Puget Sound Q4 2012 Office MarketPuget Sound Q4 2012 Office Market
Puget Sound Q4 2012 Office Market
 
Snapshot: NAR Profile of Home Buyers and Sellers
Snapshot: NAR Profile of Home Buyers and SellersSnapshot: NAR Profile of Home Buyers and Sellers
Snapshot: NAR Profile of Home Buyers and Sellers
 
Mafia Wars Expense Guide
Mafia Wars Expense GuideMafia Wars Expense Guide
Mafia Wars Expense Guide
 
Solon OH Real Estate Market. How many months needed to sell existing invento...
 Solon OH Real Estate Market. How many months needed to sell existing invento... Solon OH Real Estate Market. How many months needed to sell existing invento...
Solon OH Real Estate Market. How many months needed to sell existing invento...
 
TOL_2008_AR
TOL_2008_ARTOL_2008_AR
TOL_2008_AR
 

Semelhante a Toronto EAST Real Estate statistics september 2011

Toronto central market charts 20124 q
Toronto central market charts 20124 qToronto central market charts 20124 q
Toronto central market charts 20124 qdainamedeiros
 
January 2011 Austin Real Estate Market Stats
January 2011 Austin Real Estate Market StatsJanuary 2011 Austin Real Estate Market Stats
January 2011 Austin Real Estate Market StatsKristee Leonard
 
Houston marketreport sep12_sf
Houston marketreport sep12_sfHouston marketreport sep12_sf
Houston marketreport sep12_sfToni Moss
 
295 davenport financial
295 davenport financial295 davenport financial
295 davenport financialHarish Maraj
 
P4 raymond alvarez excel
P4 raymond alvarez excelP4 raymond alvarez excel
P4 raymond alvarez excelraymond4321
 
P4 raymond alvarez excel
P4 raymond alvarez excelP4 raymond alvarez excel
P4 raymond alvarez excelraymond4321
 
Slide show survey period 4
Slide show survey period 4Slide show survey period 4
Slide show survey period 4raymond4321
 
Cu, Sharry Mao, Roger Miljkovic, Alex Pareek, Naveena Riddle, John Charting ...
Cu, Sharry Mao, Roger  Miljkovic, Alex Pareek, Naveena Riddle, John Charting ...Cu, Sharry Mao, Roger  Miljkovic, Alex Pareek, Naveena Riddle, John Charting ...
Cu, Sharry Mao, Roger Miljkovic, Alex Pareek, Naveena Riddle, John Charting ...John Riddle
 
ecolab BusinessFinancial
ecolab  BusinessFinancialecolab  BusinessFinancial
ecolab BusinessFinancialfinance37
 
ecolab Ecolab_2004_Final
ecolab  Ecolab_2004_Finalecolab  Ecolab_2004_Final
ecolab Ecolab_2004_Finalfinance37
 
Loopnet Q4 2009 Insight Report 1 16 09
Loopnet Q4 2009 Insight Report 1 16 09Loopnet Q4 2009 Insight Report 1 16 09
Loopnet Q4 2009 Insight Report 1 16 09aporrazzo
 
whirlpool Annual Report2006
whirlpool Annual Report2006whirlpool Annual Report2006
whirlpool Annual Report2006finance13
 
whirlpool Financial Highlights / Chairman's Letter
whirlpool Financial Highlights / Chairman's Letterwhirlpool Financial Highlights / Chairman's Letter
whirlpool Financial Highlights / Chairman's Letterfinance13
 
Vancouver real estate stats package, December 2011
Vancouver real estate stats package, December 2011Vancouver real estate stats package, December 2011
Vancouver real estate stats package, December 2011Matt Collinge
 

Semelhante a Toronto EAST Real Estate statistics september 2011 (20)

Toronto central market charts 20124 q
Toronto central market charts 20124 qToronto central market charts 20124 q
Toronto central market charts 20124 q
 
January 2011 Austin Real Estate Market Stats
January 2011 Austin Real Estate Market StatsJanuary 2011 Austin Real Estate Market Stats
January 2011 Austin Real Estate Market Stats
 
3025 finch
3025 finch3025 finch
3025 finch
 
Houston marketreport sep12_sf
Houston marketreport sep12_sfHouston marketreport sep12_sf
Houston marketreport sep12_sf
 
295 davenport financial
295 davenport financial295 davenport financial
295 davenport financial
 
Toronto rental market
Toronto rental marketToronto rental market
Toronto rental market
 
P4 raymond alvarez excel
P4 raymond alvarez excelP4 raymond alvarez excel
P4 raymond alvarez excel
 
P4 raymond alvarez excel
P4 raymond alvarez excelP4 raymond alvarez excel
P4 raymond alvarez excel
 
Slide show survey period 4
Slide show survey period 4Slide show survey period 4
Slide show survey period 4
 
Cu, Sharry Mao, Roger Miljkovic, Alex Pareek, Naveena Riddle, John Charting ...
Cu, Sharry Mao, Roger  Miljkovic, Alex Pareek, Naveena Riddle, John Charting ...Cu, Sharry Mao, Roger  Miljkovic, Alex Pareek, Naveena Riddle, John Charting ...
Cu, Sharry Mao, Roger Miljkovic, Alex Pareek, Naveena Riddle, John Charting ...
 
Cu, Sharry Mao, Roger Miljkovic, Alex Pareek, Naveena Riddle, John Charting ...
Cu, Sharry Mao, Roger  Miljkovic, Alex Pareek, Naveena Riddle, John Charting ...Cu, Sharry Mao, Roger  Miljkovic, Alex Pareek, Naveena Riddle, John Charting ...
Cu, Sharry Mao, Roger Miljkovic, Alex Pareek, Naveena Riddle, John Charting ...
 
Dalkeith
DalkeithDalkeith
Dalkeith
 
ecolab BusinessFinancial
ecolab  BusinessFinancialecolab  BusinessFinancial
ecolab BusinessFinancial
 
ecolab Ecolab_2004_Final
ecolab  Ecolab_2004_Finalecolab  Ecolab_2004_Final
ecolab Ecolab_2004_Final
 
Loopnet Q4 2009 Insight Report 1 16 09
Loopnet Q4 2009 Insight Report 1 16 09Loopnet Q4 2009 Insight Report 1 16 09
Loopnet Q4 2009 Insight Report 1 16 09
 
whirlpool Annual Report2006
whirlpool Annual Report2006whirlpool Annual Report2006
whirlpool Annual Report2006
 
whirlpool Financial Highlights / Chairman's Letter
whirlpool Financial Highlights / Chairman's Letterwhirlpool Financial Highlights / Chairman's Letter
whirlpool Financial Highlights / Chairman's Letter
 
2006 Q3 Google Earnings Slides
2006 Q3 Google Earnings Slides2006 Q3 Google Earnings Slides
2006 Q3 Google Earnings Slides
 
Vancouver real estate stats package, December 2011
Vancouver real estate stats package, December 2011Vancouver real estate stats package, December 2011
Vancouver real estate stats package, December 2011
 

Mais de John Helfrich

Toronto real estate statistics january 2012
Toronto real estate statistics january 2012Toronto real estate statistics january 2012
Toronto real estate statistics january 2012John Helfrich
 
Toronto real estate statistics charts january 2012
Toronto real estate statistics charts january 2012Toronto real estate statistics charts january 2012
Toronto real estate statistics charts january 2012John Helfrich
 
Toronto condo market statistical report Q4 2011
Toronto condo market statistical report Q4 2011Toronto condo market statistical report Q4 2011
Toronto condo market statistical report Q4 2011John Helfrich
 
Toronto real estate statistics December 2011
Toronto real estate statistics December 2011Toronto real estate statistics December 2011
Toronto real estate statistics December 2011John Helfrich
 
John Helfrich Real Estate Newsletter January February 2012
John Helfrich Real Estate Newsletter January February 2012John Helfrich Real Estate Newsletter January February 2012
John Helfrich Real Estate Newsletter January February 2012John Helfrich
 
Toronto real estate statistics november 2011
Toronto real estate statistics november 2011Toronto real estate statistics november 2011
Toronto real estate statistics november 2011John Helfrich
 
Toronto real estate statistics October 2011
Toronto real estate statistics October 2011Toronto real estate statistics October 2011
Toronto real estate statistics October 2011John Helfrich
 
Toronto condo market statistical report 2011
Toronto condo market statistical report 2011Toronto condo market statistical report 2011
Toronto condo market statistical report 2011John Helfrich
 
Toronto Real Estate Statistics september 2011
Toronto Real Estate Statistics september 2011Toronto Real Estate Statistics september 2011
Toronto Real Estate Statistics september 2011John Helfrich
 
Toronto Air Quality Study - Toronto Environment Office
Toronto Air Quality Study - Toronto Environment OfficeToronto Air Quality Study - Toronto Environment Office
Toronto Air Quality Study - Toronto Environment OfficeJohn Helfrich
 
Toronto real estate statistics chart august 2011
Toronto real estate statistics chart august 2011Toronto real estate statistics chart august 2011
Toronto real estate statistics chart august 2011John Helfrich
 
Toronto real estate statistics august 2011
Toronto real estate statistics august 2011Toronto real estate statistics august 2011
Toronto real estate statistics august 2011John Helfrich
 
Toronto real estate statistics charts july 2011
Toronto real estate statistics charts july 2011Toronto real estate statistics charts july 2011
Toronto real estate statistics charts july 2011John Helfrich
 
Toronto real estate statistics july 2011
Toronto real estate statistics july 2011Toronto real estate statistics july 2011
Toronto real estate statistics july 2011John Helfrich
 
Toronto real estate statistics june 2011
Toronto real estate statistics june 2011Toronto real estate statistics june 2011
Toronto real estate statistics june 2011John Helfrich
 
Toronto real estate statistics may 2011
Toronto real estate statistics may 2011Toronto real estate statistics may 2011
Toronto real estate statistics may 2011John Helfrich
 
Toronto real estate statistics charts april 2011
Toronto real estate statistics charts april 2011Toronto real estate statistics charts april 2011
Toronto real estate statistics charts april 2011John Helfrich
 
Toronto real estate statistics april 2011
Toronto real estate statistics april 2011Toronto real estate statistics april 2011
Toronto real estate statistics april 2011John Helfrich
 
Toronto real estate statistics march 2011
Toronto real estate statistics march 2011Toronto real estate statistics march 2011
Toronto real estate statistics march 2011John Helfrich
 
Toronto Real Estate Statistics February 2011
Toronto Real Estate Statistics February 2011Toronto Real Estate Statistics February 2011
Toronto Real Estate Statistics February 2011John Helfrich
 

Mais de John Helfrich (20)

Toronto real estate statistics january 2012
Toronto real estate statistics january 2012Toronto real estate statistics january 2012
Toronto real estate statistics january 2012
 
Toronto real estate statistics charts january 2012
Toronto real estate statistics charts january 2012Toronto real estate statistics charts january 2012
Toronto real estate statistics charts january 2012
 
Toronto condo market statistical report Q4 2011
Toronto condo market statistical report Q4 2011Toronto condo market statistical report Q4 2011
Toronto condo market statistical report Q4 2011
 
Toronto real estate statistics December 2011
Toronto real estate statistics December 2011Toronto real estate statistics December 2011
Toronto real estate statistics December 2011
 
John Helfrich Real Estate Newsletter January February 2012
John Helfrich Real Estate Newsletter January February 2012John Helfrich Real Estate Newsletter January February 2012
John Helfrich Real Estate Newsletter January February 2012
 
Toronto real estate statistics november 2011
Toronto real estate statistics november 2011Toronto real estate statistics november 2011
Toronto real estate statistics november 2011
 
Toronto real estate statistics October 2011
Toronto real estate statistics October 2011Toronto real estate statistics October 2011
Toronto real estate statistics October 2011
 
Toronto condo market statistical report 2011
Toronto condo market statistical report 2011Toronto condo market statistical report 2011
Toronto condo market statistical report 2011
 
Toronto Real Estate Statistics september 2011
Toronto Real Estate Statistics september 2011Toronto Real Estate Statistics september 2011
Toronto Real Estate Statistics september 2011
 
Toronto Air Quality Study - Toronto Environment Office
Toronto Air Quality Study - Toronto Environment OfficeToronto Air Quality Study - Toronto Environment Office
Toronto Air Quality Study - Toronto Environment Office
 
Toronto real estate statistics chart august 2011
Toronto real estate statistics chart august 2011Toronto real estate statistics chart august 2011
Toronto real estate statistics chart august 2011
 
Toronto real estate statistics august 2011
Toronto real estate statistics august 2011Toronto real estate statistics august 2011
Toronto real estate statistics august 2011
 
Toronto real estate statistics charts july 2011
Toronto real estate statistics charts july 2011Toronto real estate statistics charts july 2011
Toronto real estate statistics charts july 2011
 
Toronto real estate statistics july 2011
Toronto real estate statistics july 2011Toronto real estate statistics july 2011
Toronto real estate statistics july 2011
 
Toronto real estate statistics june 2011
Toronto real estate statistics june 2011Toronto real estate statistics june 2011
Toronto real estate statistics june 2011
 
Toronto real estate statistics may 2011
Toronto real estate statistics may 2011Toronto real estate statistics may 2011
Toronto real estate statistics may 2011
 
Toronto real estate statistics charts april 2011
Toronto real estate statistics charts april 2011Toronto real estate statistics charts april 2011
Toronto real estate statistics charts april 2011
 
Toronto real estate statistics april 2011
Toronto real estate statistics april 2011Toronto real estate statistics april 2011
Toronto real estate statistics april 2011
 
Toronto real estate statistics march 2011
Toronto real estate statistics march 2011Toronto real estate statistics march 2011
Toronto real estate statistics march 2011
 
Toronto Real Estate Statistics February 2011
Toronto Real Estate Statistics February 2011Toronto Real Estate Statistics February 2011
Toronto Real Estate Statistics February 2011
 

Último

Premium Villa Projects in Sarjapur Road Bengaluru
Premium Villa Projects in Sarjapur Road BengaluruPremium Villa Projects in Sarjapur Road Bengaluru
Premium Villa Projects in Sarjapur Road BengaluruShivaSeo3
 
Magarpatta Nova Elegance Mundhwa Pune E-Brochure.pdf
Magarpatta Nova Elegance Mundhwa Pune  E-Brochure.pdfMagarpatta Nova Elegance Mundhwa Pune  E-Brochure.pdf
Magarpatta Nova Elegance Mundhwa Pune E-Brochure.pdfManishSaxena95
 
BDSM⚡Call Girls in Sector 57 Noida Escorts >༒8448380779 Escort Service
BDSM⚡Call Girls in Sector 57 Noida Escorts >༒8448380779 Escort ServiceBDSM⚡Call Girls in Sector 57 Noida Escorts >༒8448380779 Escort Service
BDSM⚡Call Girls in Sector 57 Noida Escorts >༒8448380779 Escort ServiceDelhi Call girls
 
Call Girls in laxmi Nagar Delhi 💯Call Us 🔝 9582086666🔝 South Delhi Escorts Se...
Call Girls in laxmi Nagar Delhi 💯Call Us 🔝 9582086666🔝 South Delhi Escorts Se...Call Girls in laxmi Nagar Delhi 💯Call Us 🔝 9582086666🔝 South Delhi Escorts Se...
Call Girls in laxmi Nagar Delhi 💯Call Us 🔝 9582086666🔝 South Delhi Escorts Se...delhimodel235
 
9990771857 Call Girls in Dwarka Sector 2 Delhi (Call Girls) Delhi
9990771857 Call Girls in Dwarka Sector 2 Delhi (Call Girls) Delhi9990771857 Call Girls in Dwarka Sector 2 Delhi (Call Girls) Delhi
9990771857 Call Girls in Dwarka Sector 2 Delhi (Call Girls) Delhidelhimodel235
 
Call Girls in Noida Sector 11 Noida 💯Call Us 🔝 9582086666 🔝 South Delhi Escor...
Call Girls in Noida Sector 11 Noida 💯Call Us 🔝 9582086666 🔝 South Delhi Escor...Call Girls in Noida Sector 11 Noida 💯Call Us 🔝 9582086666 🔝 South Delhi Escor...
Call Girls in Noida Sector 11 Noida 💯Call Us 🔝 9582086666 🔝 South Delhi Escor...delhimodel235
 
Call girls in new Ashok NagarDelhi꧁ 8447779280꧂ Escort Service Women Seeking ...
Call girls in new Ashok NagarDelhi꧁ 8447779280꧂ Escort Service Women Seeking ...Call girls in new Ashok NagarDelhi꧁ 8447779280꧂ Escort Service Women Seeking ...
Call girls in new Ashok NagarDelhi꧁ 8447779280꧂ Escort Service Women Seeking ...asmaqueen5
 
call girls in ganesh nagar Delhi 8264348440 ✅ call girls ❤️
call girls in ganesh nagar Delhi 8264348440 ✅ call girls ❤️call girls in ganesh nagar Delhi 8264348440 ✅ call girls ❤️
call girls in ganesh nagar Delhi 8264348440 ✅ call girls ❤️soniya singh
 
3D Architectural Rendering Company by Panoram CGI
3D Architectural Rendering Company by Panoram CGI3D Architectural Rendering Company by Panoram CGI
3D Architectural Rendering Company by Panoram CGIPanoram CGI
 
Call Girls in Noida Sector 77 Noida 💯Call Us 🔝 9582086666 🔝 South Delhi Escor...
Call Girls in Noida Sector 77 Noida 💯Call Us 🔝 9582086666 🔝 South Delhi Escor...Call Girls in Noida Sector 77 Noida 💯Call Us 🔝 9582086666 🔝 South Delhi Escor...
Call Girls in Noida Sector 77 Noida 💯Call Us 🔝 9582086666 🔝 South Delhi Escor...delhimodel235
 
Maha Mauka Squarefeet Brochure |Maha Mauka Squarefeet PDF Brochure|
Maha Mauka Squarefeet Brochure |Maha Mauka Squarefeet PDF Brochure|Maha Mauka Squarefeet Brochure |Maha Mauka Squarefeet PDF Brochure|
Maha Mauka Squarefeet Brochure |Maha Mauka Squarefeet PDF Brochure|AkshayJoshi575980
 
9990771857 Call Girls in Dwarka Sector 137 Noida (Call Girls) Delhi
9990771857 Call Girls in Dwarka Sector 137 Noida (Call Girls) Delhi9990771857 Call Girls in Dwarka Sector 137 Noida (Call Girls) Delhi
9990771857 Call Girls in Dwarka Sector 137 Noida (Call Girls) Delhidelhimodel235
 
Listing Turkey Sylvana Istanbul - Bahcesehir
Listing Turkey Sylvana Istanbul - BahcesehirListing Turkey Sylvana Istanbul - Bahcesehir
Listing Turkey Sylvana Istanbul - BahcesehirListing Turkey
 
Call Girls In Laxmi Nagar Delhi +91-8447779280! !Best Woman Seeking Man Escor...
Call Girls In Laxmi Nagar Delhi +91-8447779280! !Best Woman Seeking Man Escor...Call Girls In Laxmi Nagar Delhi +91-8447779280! !Best Woman Seeking Man Escor...
Call Girls In Laxmi Nagar Delhi +91-8447779280! !Best Woman Seeking Man Escor...asmaqueen5
 
Purva Soukhyam in Guduvancheri Chennai.pdf
Purva Soukhyam in Guduvancheri Chennai.pdfPurva Soukhyam in Guduvancheri Chennai.pdf
Purva Soukhyam in Guduvancheri Chennai.pdfpritika141199
 
Best Deal Virtual Space in Satya The Hive Tata Zudio 750 Sqft 1.89 Cr All inc...
Best Deal Virtual Space in Satya The Hive Tata Zudio 750 Sqft 1.89 Cr All inc...Best Deal Virtual Space in Satya The Hive Tata Zudio 750 Sqft 1.89 Cr All inc...
Best Deal Virtual Space in Satya The Hive Tata Zudio 750 Sqft 1.89 Cr All inc...ApartmentWala1
 
9990771857 Call Girls in Dwarka Sector 1 Delhi (Call Girls) Delhi
9990771857 Call Girls in Dwarka Sector 1 Delhi (Call Girls) Delhi9990771857 Call Girls in Dwarka Sector 1 Delhi (Call Girls) Delhi
9990771857 Call Girls in Dwarka Sector 1 Delhi (Call Girls) Delhidelhimodel235
 
Low Rate ↬Call Girls in Trilokpuri Delhi ↫8447779280}Escorts Service In Delhi
Low Rate ↬Call Girls in Trilokpuri Delhi ↫8447779280}Escorts Service In DelhiLow Rate ↬Call Girls in Trilokpuri Delhi ↫8447779280}Escorts Service In Delhi
Low Rate ↬Call Girls in Trilokpuri Delhi ↫8447779280}Escorts Service In Delhiasmaqueen5
 
Majestique Viman Nagar Pune Brochure.pdf
Majestique Viman Nagar Pune Brochure.pdfMajestique Viman Nagar Pune Brochure.pdf
Majestique Viman Nagar Pune Brochure.pdfBabyrudram
 
Call Girls in Noida Sector 13 Noida 💯Call Us 🔝 9582086666 🔝 South Delhi Escor...
Call Girls in Noida Sector 13 Noida 💯Call Us 🔝 9582086666 🔝 South Delhi Escor...Call Girls in Noida Sector 13 Noida 💯Call Us 🔝 9582086666 🔝 South Delhi Escor...
Call Girls in Noida Sector 13 Noida 💯Call Us 🔝 9582086666 🔝 South Delhi Escor...delhimodel235
 

Último (20)

Premium Villa Projects in Sarjapur Road Bengaluru
Premium Villa Projects in Sarjapur Road BengaluruPremium Villa Projects in Sarjapur Road Bengaluru
Premium Villa Projects in Sarjapur Road Bengaluru
 
Magarpatta Nova Elegance Mundhwa Pune E-Brochure.pdf
Magarpatta Nova Elegance Mundhwa Pune  E-Brochure.pdfMagarpatta Nova Elegance Mundhwa Pune  E-Brochure.pdf
Magarpatta Nova Elegance Mundhwa Pune E-Brochure.pdf
 
BDSM⚡Call Girls in Sector 57 Noida Escorts >༒8448380779 Escort Service
BDSM⚡Call Girls in Sector 57 Noida Escorts >༒8448380779 Escort ServiceBDSM⚡Call Girls in Sector 57 Noida Escorts >༒8448380779 Escort Service
BDSM⚡Call Girls in Sector 57 Noida Escorts >༒8448380779 Escort Service
 
Call Girls in laxmi Nagar Delhi 💯Call Us 🔝 9582086666🔝 South Delhi Escorts Se...
Call Girls in laxmi Nagar Delhi 💯Call Us 🔝 9582086666🔝 South Delhi Escorts Se...Call Girls in laxmi Nagar Delhi 💯Call Us 🔝 9582086666🔝 South Delhi Escorts Se...
Call Girls in laxmi Nagar Delhi 💯Call Us 🔝 9582086666🔝 South Delhi Escorts Se...
 
9990771857 Call Girls in Dwarka Sector 2 Delhi (Call Girls) Delhi
9990771857 Call Girls in Dwarka Sector 2 Delhi (Call Girls) Delhi9990771857 Call Girls in Dwarka Sector 2 Delhi (Call Girls) Delhi
9990771857 Call Girls in Dwarka Sector 2 Delhi (Call Girls) Delhi
 
Call Girls in Noida Sector 11 Noida 💯Call Us 🔝 9582086666 🔝 South Delhi Escor...
Call Girls in Noida Sector 11 Noida 💯Call Us 🔝 9582086666 🔝 South Delhi Escor...Call Girls in Noida Sector 11 Noida 💯Call Us 🔝 9582086666 🔝 South Delhi Escor...
Call Girls in Noida Sector 11 Noida 💯Call Us 🔝 9582086666 🔝 South Delhi Escor...
 
Call girls in new Ashok NagarDelhi꧁ 8447779280꧂ Escort Service Women Seeking ...
Call girls in new Ashok NagarDelhi꧁ 8447779280꧂ Escort Service Women Seeking ...Call girls in new Ashok NagarDelhi꧁ 8447779280꧂ Escort Service Women Seeking ...
Call girls in new Ashok NagarDelhi꧁ 8447779280꧂ Escort Service Women Seeking ...
 
call girls in ganesh nagar Delhi 8264348440 ✅ call girls ❤️
call girls in ganesh nagar Delhi 8264348440 ✅ call girls ❤️call girls in ganesh nagar Delhi 8264348440 ✅ call girls ❤️
call girls in ganesh nagar Delhi 8264348440 ✅ call girls ❤️
 
3D Architectural Rendering Company by Panoram CGI
3D Architectural Rendering Company by Panoram CGI3D Architectural Rendering Company by Panoram CGI
3D Architectural Rendering Company by Panoram CGI
 
Call Girls in Noida Sector 77 Noida 💯Call Us 🔝 9582086666 🔝 South Delhi Escor...
Call Girls in Noida Sector 77 Noida 💯Call Us 🔝 9582086666 🔝 South Delhi Escor...Call Girls in Noida Sector 77 Noida 💯Call Us 🔝 9582086666 🔝 South Delhi Escor...
Call Girls in Noida Sector 77 Noida 💯Call Us 🔝 9582086666 🔝 South Delhi Escor...
 
Maha Mauka Squarefeet Brochure |Maha Mauka Squarefeet PDF Brochure|
Maha Mauka Squarefeet Brochure |Maha Mauka Squarefeet PDF Brochure|Maha Mauka Squarefeet Brochure |Maha Mauka Squarefeet PDF Brochure|
Maha Mauka Squarefeet Brochure |Maha Mauka Squarefeet PDF Brochure|
 
9990771857 Call Girls in Dwarka Sector 137 Noida (Call Girls) Delhi
9990771857 Call Girls in Dwarka Sector 137 Noida (Call Girls) Delhi9990771857 Call Girls in Dwarka Sector 137 Noida (Call Girls) Delhi
9990771857 Call Girls in Dwarka Sector 137 Noida (Call Girls) Delhi
 
Listing Turkey Sylvana Istanbul - Bahcesehir
Listing Turkey Sylvana Istanbul - BahcesehirListing Turkey Sylvana Istanbul - Bahcesehir
Listing Turkey Sylvana Istanbul - Bahcesehir
 
Call Girls In Laxmi Nagar Delhi +91-8447779280! !Best Woman Seeking Man Escor...
Call Girls In Laxmi Nagar Delhi +91-8447779280! !Best Woman Seeking Man Escor...Call Girls In Laxmi Nagar Delhi +91-8447779280! !Best Woman Seeking Man Escor...
Call Girls In Laxmi Nagar Delhi +91-8447779280! !Best Woman Seeking Man Escor...
 
Purva Soukhyam in Guduvancheri Chennai.pdf
Purva Soukhyam in Guduvancheri Chennai.pdfPurva Soukhyam in Guduvancheri Chennai.pdf
Purva Soukhyam in Guduvancheri Chennai.pdf
 
Best Deal Virtual Space in Satya The Hive Tata Zudio 750 Sqft 1.89 Cr All inc...
Best Deal Virtual Space in Satya The Hive Tata Zudio 750 Sqft 1.89 Cr All inc...Best Deal Virtual Space in Satya The Hive Tata Zudio 750 Sqft 1.89 Cr All inc...
Best Deal Virtual Space in Satya The Hive Tata Zudio 750 Sqft 1.89 Cr All inc...
 
9990771857 Call Girls in Dwarka Sector 1 Delhi (Call Girls) Delhi
9990771857 Call Girls in Dwarka Sector 1 Delhi (Call Girls) Delhi9990771857 Call Girls in Dwarka Sector 1 Delhi (Call Girls) Delhi
9990771857 Call Girls in Dwarka Sector 1 Delhi (Call Girls) Delhi
 
Low Rate ↬Call Girls in Trilokpuri Delhi ↫8447779280}Escorts Service In Delhi
Low Rate ↬Call Girls in Trilokpuri Delhi ↫8447779280}Escorts Service In DelhiLow Rate ↬Call Girls in Trilokpuri Delhi ↫8447779280}Escorts Service In Delhi
Low Rate ↬Call Girls in Trilokpuri Delhi ↫8447779280}Escorts Service In Delhi
 
Majestique Viman Nagar Pune Brochure.pdf
Majestique Viman Nagar Pune Brochure.pdfMajestique Viman Nagar Pune Brochure.pdf
Majestique Viman Nagar Pune Brochure.pdf
 
Call Girls in Noida Sector 13 Noida 💯Call Us 🔝 9582086666 🔝 South Delhi Escor...
Call Girls in Noida Sector 13 Noida 💯Call Us 🔝 9582086666 🔝 South Delhi Escor...Call Girls in Noida Sector 13 Noida 💯Call Us 🔝 9582086666 🔝 South Delhi Escor...
Call Girls in Noida Sector 13 Noida 💯Call Us 🔝 9582086666 🔝 South Delhi Escor...
 

Toronto EAST Real Estate statistics september 2011

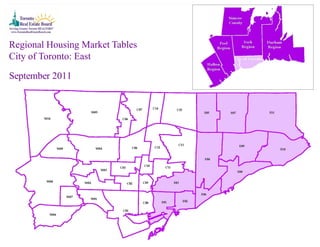
  • 1. Regional Housing Market Tables City of Toronto: East September 2011
  • 2. Toronto Real Estate Board Regional Housing Market Tables City of Toronto, Toronto East SEPTEMBER 2011 1 1 1 1 2 3 4 5 Sales Dollar Volume Average Price Median Price New Listings Active Listings Avg. SP/LP Avg. DOM All Home Types 910 $376,303,759 $413,521 $379,500 1,727 1,856 100% 23 Detached 411 $207,476,513 $504,809 $460,000 786 662 100% 19 Semi-Detached 143 $68,040,978 $475,811 $445,000 252 174 102% 16 Condominium Townhouse 76 $21,764,648 $286,377 $279,000 133 167 99% 25 Condominium Apartment 213 $50,232,299 $235,832 $225,500 459 769 98% 34 Link 11 $4,653,800 $423,073 $415,000 16 14 98% 24 Att/Row/Townhouse 52 $23,423,521 $450,452 $409,125 75 64 103% 19 Co-Operative Apartment 4 $712,000 $178,000 $178,500 5 4 95% 66 Detached Condominium 0 $0 - - 1 2 - - Co-Ownership Apartment 0 $0 - - 0 0 - - 6 City of Toronto, Toronto East YEAR-TO-DATE 2011 Sales1 Dollar Volume1 Average Price1 Median Price1 New Listings2 Avg. SP/LP 4 Avg. DOM5 All Home Types 7,981 $3,202,990,373 $401,327 $375,000 13,408 100% 21 Detached 3,468 $1,739,081,205 $501,465 $443,900 5,622 101% 17 Semi-Detached 1,216 $576,406,288 $474,018 $440,000 1,860 102% 14 Condominium Townhouse 717 $200,750,669 $279,987 $280,000 1,191 99% 26 Condominium Apartment 2,043 $468,395,488 $229,268 $215,000 3,892 98% 33 Link 107 $43,812,470 $409,462 $412,000 166 102% 16 Att/Row/Townhouse 400 $168,252,953 $420,632 $389,000 619 101% 18 Co-Operative Apartment 23 $3,994,700 $173,683 $147,000 45 96% 40 Detached Condominium 4 $1,353,700 $338,425 $287,500 11 98% 23 Co-Ownership Apartment 3 $942,900 $314,300 $370,000 2 104% 75 NOTES 1 Sales, dollar volume, average sale prices and median sale prices are based on firm transactions entered into the TorontoMLS® system between the first and last day of the month/period being reported. 2 New listings entered into the TorontoMLS® system between the first and last day of the month/period being reported. 3 Active listings at the end of the last day of the month/period being reported. 4 Ratio of the average selling price to the average listing price for firm transactions entered into the TorontoMLS® system between the first and last day of the month/period being reported. 5 Average number of days on the market for firm transactions entered into the TorontoMLS® system between the first and last day of the month/period being reported. 6 Past monthly and year-to-date figures are revised on a monthly basis. Toronto East, September 2011 2
  • 3. Toronto Real Estate Board Regional Housing Market Tables City of Toronto, Toronto E01 SEPTEMBER 2011 1 1 1 1 2 3 4 5 Sales Dollar Volume Average Price Median Price New Listings Active Listings Avg. SP/LP Avg. DOM All Home Types 79 $41,786,571 $528,944 $536,000 165 152 103% 15 Detached 10 $6,547,500 $654,750 $623,500 37 37 99% 17 Semi-Detached 42 $22,132,000 $526,952 $529,000 73 53 103% 13 Condominium Townhouse 4 $1,527,000 $381,750 $345,000 8 9 100% 31 Condominium Apartment 10 $4,109,500 $410,950 $398,500 28 39 100% 22 Link 0 - - - 0 0 - - Att/Row/Townhouse 13 $7,470,571 $574,659 $571,000 19 14 109% 8 Co-Operative Apartment 0 - - - 0 0 - - Detached Condominium 0 - - - 0 0 - - Co-Ownership Apartment 0 - - - 0 0 - - 6 City of Toronto, Toronto E01 YEAR-TO-DATE 2011 Sales1 Dollar Volume1 Average Price1 Median Price1 New Listings2 Avg. SP/LP 4 Avg. DOM5 All Home Types 702 $382,593,015 $545,004 $523,500 1,192 103% 14 Detached 161 $106,875,539 $663,823 $625,000 289 104% 13 Semi-Detached 337 $183,770,883 $545,314 $527,000 532 104% 13 Condominium Townhouse 39 $14,485,293 $371,418 $345,000 65 100% 25 Condominium Apartment 78 $33,021,900 $423,358 $424,000 175 100% 19 Link 0 - - - 0 - - Att/Row/Townhouse 86 $43,924,400 $510,749 $535,550 130 104% 13 Co-Operative Apartment 0 - - - 0 - - Detached Condominium 1 $515,000 $515,000 $515,000 1 99% 14 Co-Ownership Apartment 0 - - - 0 - - NOTES 1 Sales, dollar volume, average sale prices and median sale prices are based on firm transactions entered into the TorontoMLS® system between the first and last day of the month/period being reported. 2 New listings entered into the TorontoMLS® system between the first and last day of the month/period being reported. 3 Active listings at the end of the last day of the month/period being reported. 4 Ratio of the average selling price to the average listing price for firm transactions entered into the TorontoMLS® system between the first and last day of the month/period being reported. 5 Average number of days on the market for firm transactions entered into the TorontoMLS® system between the first and last day of the month/period being reported. 6 Past monthly and year-to-date figures are revised on a monthly basis. Toronto East, September 2011 3
  • 4. Toronto Real Estate Board Regional Housing Market Tables City of Toronto, Toronto E02 SEPTEMBER 2011 1 1 1 1 2 3 4 5 Sales Dollar Volume Average Price Median Price New Listings Active Listings Avg. SP/LP Avg. DOM All Home Types 76 $46,187,288 $607,727 $558,500 158 114 101% 14 Detached 31 $22,643,788 $730,445 $710,000 66 46 101% 10 Semi-Detached 26 $14,167,600 $544,908 $487,750 49 31 103% 10 Condominium Townhouse 3 $1,536,900 $512,300 $360,000 4 7 99% 19 Condominium Apartment 5 $2,193,000 $438,600 $295,000 25 23 100% 24 Link 0 - - - 0 0 - - Att/Row/Townhouse 10 $5,401,000 $540,100 $547,000 13 7 100% 17 Co-Operative Apartment 1 $245,000 $245,000 $245,000 1 0 94% 134 Detached Condominium 0 - - - 0 0 - - Co-Ownership Apartment 0 - - - 0 0 - - 6 City of Toronto, Toronto E02 YEAR-TO-DATE 2011 Sales1 Dollar Volume1 Average Price1 Median Price1 New Listings2 Avg. SP/LP 4 Avg. DOM5 All Home Types 686 $429,445,967 $626,015 $545,000 1,148 101% 14 Detached 257 $208,148,329 $809,916 $727,000 434 101% 13 Semi-Detached 277 $148,478,938 $536,025 $499,000 421 102% 12 Condominium Townhouse 30 $15,158,900 $505,297 $464,000 60 98% 20 Condominium Apartment 62 $26,857,400 $433,184 $402,500 127 99% 20 Link 0 - - - 0 - - Att/Row/Townhouse 53 $28,600,400 $539,630 $520,000 88 101% 15 Co-Operative Apartment 5 $1,450,500 $290,100 $285,000 15 95% 52 Detached Condominium 0 - - - 1 - - Co-Ownership Apartment 2 $751,500 $375,750 $375,750 2 105% 13 NOTES 1 Sales, dollar volume, average sale prices and median sale prices are based on firm transactions entered into the TorontoMLS® system between the first and last day of the month/period being reported. 2 New listings entered into the TorontoMLS® system between the first and last day of the month/period being reported. 3 Active listings at the end of the last day of the month/period being reported. 4 Ratio of the average selling price to the average listing price for firm transactions entered into the TorontoMLS® system between the first and last day of the month/period being reported. 5 Average number of days on the market for firm transactions entered into the TorontoMLS® system between the first and last day of the month/period being reported. 6 Past monthly and year-to-date figures are revised on a monthly basis. Toronto East, September 2011 4
  • 5. Toronto Real Estate Board Regional Housing Market Tables City of Toronto, Toronto E03 SEPTEMBER 2011 1 1 1 1 2 3 4 5 Sales Dollar Volume Average Price Median Price New Listings Active Listings Avg. SP/LP Avg. DOM All Home Types 97 $47,831,665 $493,110 $463,000 209 167 102% 22 Detached 57 $29,185,475 $512,026 $465,000 136 105 101% 23 Semi-Detached 31 $16,344,690 $527,248 $470,000 52 26 102% 15 Condominium Townhouse 0 - - - 0 1 - - Condominium Apartment 6 $937,000 $156,167 $142,500 17 29 98% 49 Link 0 - - - 0 0 - - Att/Row/Townhouse 3 $1,364,500 $454,833 $410,000 4 6 102% 26 Co-Operative Apartment 0 - - - 0 0 - - Detached Condominium 0 - - - 0 0 - - Co-Ownership Apartment 0 - - - 0 0 - - 6 City of Toronto, Toronto E03 YEAR-TO-DATE 2011 Sales1 Dollar Volume1 Average Price1 Median Price1 New Listings2 Avg. SP/LP 4 Avg. DOM5 All Home Types 922 $411,507,600 $446,321 $432,500 1,545 102% 20 Detached 505 $261,345,530 $517,516 $470,000 881 102% 17 Semi-Detached 205 $101,829,119 $496,727 $480,000 318 103% 14 Condominium Townhouse 11 $3,277,800 $297,982 $294,000 12 98% 37 Condominium Apartment 185 $38,164,051 $206,292 $177,000 299 97% 33 Link 0 - - - 0 - - Att/Row/Townhouse 15 $6,699,700 $446,647 $410,000 35 101% 20 Co-Operative Apartment 0 - - - 0 - - Detached Condominium 0 - - - 0 - - Co-Ownership Apartment 1 $191,400 $191,400 $191,400 0 101% 198 NOTES 1 Sales, dollar volume, average sale prices and median sale prices are based on firm transactions entered into the TorontoMLS® system between the first and last day of the month/period being reported. 2 New listings entered into the TorontoMLS® system between the first and last day of the month/period being reported. 3 Active listings at the end of the last day of the month/period being reported. 4 Ratio of the average selling price to the average listing price for firm transactions entered into the TorontoMLS® system between the first and last day of the month/period being reported. 5 Average number of days on the market for firm transactions entered into the TorontoMLS® system between the first and last day of the month/period being reported. 6 Past monthly and year-to-date figures are revised on a monthly basis. Toronto East, September 2011 5
  • 6. Toronto Real Estate Board Regional Housing Market Tables City of Toronto, Toronto E04 SEPTEMBER 2011 1 1 1 1 2 3 4 5 Sales Dollar Volume Average Price Median Price New Listings Active Listings Avg. SP/LP Avg. DOM All Home Types 97 $31,069,255 $320,302 $353,000 168 199 100% 28 Detached 51 $20,298,907 $398,018 $392,000 83 67 101% 17 Semi-Detached 13 $4,247,300 $326,715 $348,000 11 9 98% 27 Condominium Townhouse 4 $1,145,098 $286,275 $281,499 20 26 98% 20 Condominium Apartment 27 $4,859,700 $179,989 $152,000 52 93 97% 44 Link 0 - - - 0 0 - - Att/Row/Townhouse 1 $408,250 $408,250 $408,250 2 4 97% 62 Co-Operative Apartment 1 $110,000 $110,000 $110,000 0 0 98% 117 Detached Condominium 0 - - - 0 0 - - Co-Ownership Apartment 0 - - - 0 0 - - 6 City of Toronto, Toronto E04 YEAR-TO-DATE 2011 Sales1 Dollar Volume1 Average Price1 Median Price1 New Listings2 Avg. SP/LP 4 Avg. DOM5 All Home Types 798 $259,633,046 $325,355 $347,700 1,335 100% 22 Detached 409 $164,094,525 $401,209 $391,000 614 101% 15 Semi-Detached 61 $19,996,600 $327,813 $318,000 99 99% 17 Condominium Townhouse 86 $25,637,958 $298,116 $304,990 182 99% 22 Condominium Apartment 213 $40,481,425 $190,054 $193,000 402 97% 35 Link 0 - - - 0 - - Att/Row/Townhouse 23 $8,588,538 $373,415 $389,000 31 99% 42 Co-Operative Apartment 6 $834,000 $139,000 $117,000 7 94% 56 Detached Condominium 0 - - - 0 - - Co-Ownership Apartment 0 - - - 0 - - NOTES 1 Sales, dollar volume, average sale prices and median sale prices are based on firm transactions entered into the TorontoMLS® system between the first and last day of the month/period being reported. 2 New listings entered into the TorontoMLS® system between the first and last day of the month/period being reported. 3 Active listings at the end of the last day of the month/period being reported. 4 Ratio of the average selling price to the average listing price for firm transactions entered into the TorontoMLS® system between the first and last day of the month/period being reported. 5 Average number of days on the market for firm transactions entered into the TorontoMLS® system between the first and last day of the month/period being reported. 6 Past monthly and year-to-date figures are revised on a monthly basis. Toronto East, September 2011 6
  • 7. Toronto Real Estate Board Regional Housing Market Tables City of Toronto, Toronto E05 SEPTEMBER 2011 1 1 1 1 2 3 4 5 Sales Dollar Volume Average Price Median Price New Listings Active Listings Avg. SP/LP Avg. DOM All Home Types 104 $42,792,838 $411,470 $391,900 160 153 101% 19 Detached 41 $24,034,538 $586,208 $572,138 59 43 102% 14 Semi-Detached 5 $2,124,800 $424,960 $418,000 11 6 104% 9 Condominium Townhouse 22 $6,769,000 $307,682 $302,000 33 27 101% 23 Condominium Apartment 30 $7,315,500 $243,850 $235,000 51 72 98% 23 Link 3 $1,354,000 $451,333 $455,000 3 3 98% 21 Att/Row/Townhouse 3 $1,195,000 $398,333 $405,000 3 2 102% 21 Co-Operative Apartment 0 - - - 0 0 - - Detached Condominium 0 - - - 0 0 - - Co-Ownership Apartment 0 - - - 0 0 - - 6 City of Toronto, Toronto E05 YEAR-TO-DATE 2011 Sales1 Dollar Volume1 Average Price1 Median Price1 New Listings2 Avg. SP/LP 4 Avg. DOM5 All Home Types 888 $327,562,988 $368,877 $330,000 1,294 101% 18 Detached 255 $141,906,504 $556,496 $552,000 399 103% 12 Semi-Detached 63 $25,744,388 $408,641 $402,000 79 101% 9 Condominium Townhouse 189 $55,151,452 $291,807 $288,000 254 101% 17 Condominium Apartment 321 $79,204,226 $246,742 $236,900 485 98% 26 Link 36 $16,301,618 $452,823 $457,400 48 102% 16 Att/Row/Townhouse 24 $9,254,800 $385,617 $386,000 29 103% 11 Co-Operative Apartment 0 - - - 0 - - Detached Condominium 0 - - - 0 - - Co-Ownership Apartment 0 - - - 0 - - NOTES 1 Sales, dollar volume, average sale prices and median sale prices are based on firm transactions entered into the TorontoMLS® system between the first and last day of the month/period being reported. 2 New listings entered into the TorontoMLS® system between the first and last day of the month/period being reported. 3 Active listings at the end of the last day of the month/period being reported. 4 Ratio of the average selling price to the average listing price for firm transactions entered into the TorontoMLS® system between the first and last day of the month/period being reported. 5 Average number of days on the market for firm transactions entered into the TorontoMLS® system between the first and last day of the month/period being reported. 6 Past monthly and year-to-date figures are revised on a monthly basis. Toronto East, September 2011 7
  • 8. Toronto Real Estate Board Regional Housing Market Tables City of Toronto, Toronto E06 SEPTEMBER 2011 1 1 1 1 2 3 4 5 Sales Dollar Volume Average Price Median Price New Listings Active Listings Avg. SP/LP Avg. DOM All Home Types 47 $21,128,550 $449,544 $390,000 84 69 99% 21 Detached 37 $17,568,650 $474,828 $440,000 69 52 99% 15 Semi-Detached 5 $2,044,900 $408,980 $355,000 5 4 100% 46 Condominium Townhouse 0 - - - 0 1 - - Condominium Apartment 4 $1,305,000 $326,250 $316,750 7 7 99% 49 Link 0 - - - 0 0 - - Att/Row/Townhouse 0 - - - 1 3 - - Co-Operative Apartment 1 $210,000 $210,000 $210,000 2 2 92% 9 Detached Condominium 0 - - - 0 0 - - Co-Ownership Apartment 0 - - - 0 0 - - 6 City of Toronto, Toronto E06 YEAR-TO-DATE 2011 Sales1 Dollar Volume1 Average Price1 Median Price1 New Listings2 Avg. SP/LP 4 Avg. DOM5 All Home Types 444 $200,410,605 $451,375 $403,050 741 99% 21 Detached 328 $156,199,914 $476,219 $417,000 546 99% 19 Semi-Detached 50 $18,982,701 $379,654 $345,500 82 99% 24 Condominium Townhouse 6 $1,952,990 $325,498 $317,500 9 101% 24 Condominium Apartment 34 $11,528,100 $339,062 $308,450 54 99% 33 Link 0 - - - 0 - - Att/Row/Townhouse 25 $11,536,900 $461,476 $450,000 46 99% 24 Co-Operative Apartment 1 $210,000 $210,000 $210,000 4 92% 9 Detached Condominium 0 - - - 0 - - Co-Ownership Apartment 0 - - - 0 - - NOTES 1 Sales, dollar volume, average sale prices and median sale prices are based on firm transactions entered into the TorontoMLS® system between the first and last day of the month/period being reported. 2 New listings entered into the TorontoMLS® system between the first and last day of the month/period being reported. 3 Active listings at the end of the last day of the month/period being reported. 4 Ratio of the average selling price to the average listing price for firm transactions entered into the TorontoMLS® system between the first and last day of the month/period being reported. 5 Average number of days on the market for firm transactions entered into the TorontoMLS® system between the first and last day of the month/period being reported. 6 Past monthly and year-to-date figures are revised on a monthly basis. Toronto East, September 2011 8
  • 9. Toronto Real Estate Board Regional Housing Market Tables City of Toronto, Toronto E07 SEPTEMBER 2011 1 1 1 1 2 3 4 5 Sales Dollar Volume Average Price Median Price New Listings Active Listings Avg. SP/LP Avg. DOM All Home Types 94 $34,059,154 $362,331 $344,900 204 251 100% 24 Detached 34 $16,814,566 $494,546 $497,904 68 52 101% 15 Semi-Detached 5 $1,982,888 $396,578 $408,000 14 10 99% 18 Condominium Townhouse 8 $2,448,000 $306,000 $296,000 13 11 100% 17 Condominium Apartment 38 $9,215,400 $242,511 $235,875 92 165 98% 34 Link 6 $2,532,300 $422,050 $435,000 9 7 98% 27 Att/Row/Townhouse 3 $1,066,000 $355,333 $353,000 8 6 98% 18 Co-Operative Apartment 0 - - - 0 0 - - Detached Condominium 0 - - - 0 0 - - Co-Ownership Apartment 0 - - - 0 0 - - 6 City of Toronto, Toronto E07 YEAR-TO-DATE 2011 Sales1 Dollar Volume1 Average Price1 Median Price1 New Listings2 Avg. SP/LP 4 Avg. DOM5 All Home Types 771 $287,900,795 $373,412 $374,000 1,357 100% 20 Detached 301 $153,505,346 $509,985 $488,000 459 101% 14 Semi-Detached 72 $28,393,242 $394,351 $390,750 99 101% 14 Condominium Townhouse 67 $20,057,126 $299,360 $294,000 96 101% 18 Condominium Apartment 245 $53,445,441 $218,145 $222,000 572 97% 31 Link 54 $21,530,052 $398,705 $392,000 85 102% 14 Att/Row/Townhouse 31 $10,745,588 $346,632 $348,000 45 101% 12 Co-Operative Apartment 1 $224,000 $224,000 $224,000 1 98% 23 Detached Condominium 0 - - - 0 - - Co-Ownership Apartment 0 - - - 0 - - NOTES 1 Sales, dollar volume, average sale prices and median sale prices are based on firm transactions entered into the TorontoMLS® system between the first and last day of the month/period being reported. 2 New listings entered into the TorontoMLS® system between the first and last day of the month/period being reported. 3 Active listings at the end of the last day of the month/period being reported. 4 Ratio of the average selling price to the average listing price for firm transactions entered into the TorontoMLS® system between the first and last day of the month/period being reported. 5 Average number of days on the market for firm transactions entered into the TorontoMLS® system between the first and last day of the month/period being reported. 6 Past monthly and year-to-date figures are revised on a monthly basis. Toronto East, September 2011 9
  • 10. Toronto Real Estate Board Regional Housing Market Tables City of Toronto, Toronto E08 SEPTEMBER 2011 1 1 1 1 2 3 4 5 Sales Dollar Volume Average Price Median Price New Listings Active Listings Avg. SP/LP Avg. DOM All Home Types 68 $30,351,001 $446,338 $372,650 98 141 97% 27 Detached 44 $25,294,301 $574,870 $436,950 61 64 96% 23 Semi-Detached 0 - - - 0 1 - - Condominium Townhouse 5 $1,387,000 $277,400 $260,000 11 19 99% 24 Condominium Apartment 19 $3,669,700 $193,142 $170,100 23 53 96% 37 Link 0 - - - 0 0 - - Att/Row/Townhouse 0 - - - 3 3 - - Co-Operative Apartment 0 - - - 0 0 - - Detached Condominium 0 - - - 0 1 - - Co-Ownership Apartment 0 - - - 0 0 - - 6 City of Toronto, Toronto E08 YEAR-TO-DATE 2011 Sales1 Dollar Volume1 Average Price1 Median Price1 New Listings2 Avg. SP/LP 4 Avg. DOM5 All Home Types 627 $225,684,550 $359,943 $347,500 1,033 98% 29 Detached 357 $169,208,200 $473,973 $400,000 565 98% 21 Semi-Detached 14 $4,129,500 $294,964 $286,500 15 98% 36 Condominium Townhouse 52 $13,547,450 $260,528 $261,250 103 98% 32 Condominium Apartment 188 $32,672,800 $173,791 $165,900 323 96% 43 Link 2 $820,100 $410,050 $410,050 6 106% 4 Att/Row/Townhouse 14 $5,306,500 $379,036 $363,500 20 98% 17 Co-Operative Apartment 0 - - - 0 - - Detached Condominium 0 - - - 1 - - Co-Ownership Apartment 0 - - - 0 - - NOTES 1 Sales, dollar volume, average sale prices and median sale prices are based on firm transactions entered into the TorontoMLS® system between the first and last day of the month/period being reported. 2 New listings entered into the TorontoMLS® system between the first and last day of the month/period being reported. 3 Active listings at the end of the last day of the month/period being reported. 4 Ratio of the average selling price to the average listing price for firm transactions entered into the TorontoMLS® system between the first and last day of the month/period being reported. 5 Average number of days on the market for firm transactions entered into the TorontoMLS® system between the first and last day of the month/period being reported. 6 Past monthly and year-to-date figures are revised on a monthly basis. Toronto East, September 2011 10
  • 11. Toronto Real Estate Board Regional Housing Market Tables City of Toronto, Toronto E09 SEPTEMBER 2011 1 1 1 1 2 3 4 5 Sales Dollar Volume Average Price Median Price New Listings Active Listings Avg. SP/LP Avg. DOM All Home Types 114 $34,379,399 $301,574 $292,000 208 274 98% 30 Detached 44 $17,305,500 $393,307 $370,500 80 69 99% 22 Semi-Detached 4 $1,207,000 $301,750 $300,500 3 5 96% 36 Condominium Townhouse 7 $1,450,000 $207,143 $217,000 13 18 98% 31 Condominium Apartment 57 $13,632,099 $239,160 $236,000 111 181 97% 35 Link 0 - - - 0 0 - - Att/Row/Townhouse 2 $784,800 $392,400 $392,400 1 1 99% 36 Co-Operative Apartment 0 - - - 0 0 - - Detached Condominium 0 - - - 0 0 - - Co-Ownership Apartment 0 - - - 0 0 - - 6 City of Toronto, Toronto E09 YEAR-TO-DATE 2011 Sales1 Dollar Volume1 Average Price1 Median Price1 New Listings2 Avg. SP/LP 4 Avg. DOM5 All Home Types 962 $279,277,974 $290,310 $275,300 1,699 98% 28 Detached 354 $135,511,384 $382,801 $375,000 550 99% 19 Semi-Detached 27 $8,474,745 $313,879 $315,000 32 99% 28 Condominium Townhouse 86 $17,098,850 $198,824 $206,500 138 97% 43 Condominium Apartment 488 $115,459,195 $236,597 $235,000 966 98% 31 Link 0 - - - 0 - - Att/Row/Townhouse 7 $2,733,800 $390,543 $395,000 13 98% 19 Co-Operative Apartment 0 - - - 0 - - Detached Condominium 0 - - - 0 - - Co-Ownership Apartment 0 - - - 0 - - NOTES 1 Sales, dollar volume, average sale prices and median sale prices are based on firm transactions entered into the TorontoMLS® system between the first and last day of the month/period being reported. 2 New listings entered into the TorontoMLS® system between the first and last day of the month/period being reported. 3 Active listings at the end of the last day of the month/period being reported. 4 Ratio of the average selling price to the average listing price for firm transactions entered into the TorontoMLS® system between the first and last day of the month/period being reported. 5 Average number of days on the market for firm transactions entered into the TorontoMLS® system between the first and last day of the month/period being reported. 6 Past monthly and year-to-date figures are revised on a monthly basis. Toronto East, September 2011 11
  • 12. Toronto Real Estate Board Regional Housing Market Tables City of Toronto, Toronto E10 SEPTEMBER 2011 1 1 1 1 2 3 4 5 Sales Dollar Volume Average Price Median Price New Listings Active Listings Avg. SP/LP Avg. DOM All Home Types 41 $16,561,100 $403,929 $373,000 102 115 98% 18 Detached 26 $12,540,500 $482,327 $427,500 69 71 98% 17 Semi-Detached 3 $913,900 $304,633 $308,000 8 6 98% 14 Condominium Townhouse 5 $1,051,300 $210,260 $210,000 12 16 97% 29 Condominium Apartment 1 $162,500 $162,500 $162,500 7 17 99% 2 Link 0 - - - 0 0 - - Att/Row/Townhouse 5 $1,745,900 $349,180 $350,000 4 3 100% 25 Co-Operative Apartment 1 $147,000 $147,000 $147,000 2 2 98% 5 Detached Condominium 0 - - - 0 0 - - Co-Ownership Apartment 0 - - - 0 0 - - 6 City of Toronto, Toronto E10 YEAR-TO-DATE 2011 Sales1 Dollar Volume1 Average Price1 Median Price1 New Listings2 Avg. SP/LP 4 Avg. DOM5 All Home Types 416 $170,342,917 $409,478 $404,000 697 99% 21 Detached 292 $137,921,695 $472,335 $445,500 481 99% 18 Semi-Detached 20 $6,909,686 $345,484 $324,950 31 100% 14 Condominium Townhouse 36 $7,902,050 $219,501 $216,450 68 98% 34 Condominium Apartment 23 $3,567,000 $155,087 $149,000 55 96% 34 Link 0 - - - 0 - - Att/Row/Townhouse 35 $12,766,286 $364,751 $358,000 45 99% 23 Co-Operative Apartment 10 $1,276,200 $127,620 $140,000 17 97% 29 Detached Condominium 0 - - - 0 - - Co-Ownership Apartment 0 - - - 0 - - NOTES 1 Sales, dollar volume, average sale prices and median sale prices are based on firm transactions entered into the TorontoMLS® system between the first and last day of the month/period being reported. 2 New listings entered into the TorontoMLS® system between the first and last day of the month/period being reported. 3 Active listings at the end of the last day of the month/period being reported. 4 Ratio of the average selling price to the average listing price for firm transactions entered into the TorontoMLS® system between the first and last day of the month/period being reported. 5 Average number of days on the market for firm transactions entered into the TorontoMLS® system between the first and last day of the month/period being reported. 6 Past monthly and year-to-date figures are revised on a monthly basis. Toronto East, September 2011 12
  • 13. Toronto Real Estate Board Regional Housing Market Tables City of Toronto, Toronto E11 SEPTEMBER 2011 1 1 1 1 2 3 4 5 Sales Dollar Volume Average Price Median Price New Listings Active Listings Avg. SP/LP Avg. DOM All Home Types 93 $30,156,938 $324,268 $317,000 171 221 98% 26 Detached 36 $15,242,788 $423,411 $382,950 58 56 98% 25 Semi-Detached 9 $2,875,900 $319,544 $287,000 26 23 100% 17 Condominium Townhouse 18 $4,450,350 $247,242 $224,250 19 32 98% 30 Condominium Apartment 16 $2,832,900 $177,056 $174,750 46 90 96% 31 Link 2 $767,500 $383,750 $383,750 4 4 100% 18 Att/Row/Townhouse 12 $3,987,500 $332,292 $328,000 17 15 100% 22 Co-Operative Apartment 0 - - - 0 0 - - Detached Condominium 0 - - - 1 1 - - Co-Ownership Apartment 0 - - - 0 0 - - 6 City of Toronto, Toronto E11 YEAR-TO-DATE 2011 Sales1 Dollar Volume1 Average Price1 Median Price1 New Listings2 Avg. SP/LP 4 Avg. DOM5 All Home Types 765 $228,630,916 $298,864 $289,000 1,367 99% 28 Detached 249 $104,364,239 $419,133 $410,000 404 99% 21 Semi-Detached 90 $29,696,486 $329,961 $319,500 152 100% 14 Condominium Townhouse 115 $26,480,800 $230,268 $217,500 204 97% 32 Condominium Apartment 206 $33,993,950 $165,019 $162,750 434 97% 46 Link 15 $5,160,700 $344,047 $334,600 27 99% 26 Att/Row/Townhouse 87 $28,096,041 $322,943 $319,900 137 99% 20 Co-Operative Apartment 0 - - - 1 - - Detached Condominium 3 $838,700 $279,567 $285,000 8 97% 26 Co-Ownership Apartment 0 - - - 0 - - NOTES 1 Sales, dollar volume, average sale prices and median sale prices are based on firm transactions entered into the TorontoMLS® system between the first and last day of the month/period being reported. 2 New listings entered into the TorontoMLS® system between the first and last day of the month/period being reported. 3 Active listings at the end of the last day of the month/period being reported. 4 Ratio of the average selling price to the average listing price for firm transactions entered into the TorontoMLS® system between the first and last day of the month/period being reported. 5 Average number of days on the market for firm transactions entered into the TorontoMLS® system between the first and last day of the month/period being reported. 6 Past monthly and year-to-date figures are revised on a monthly basis. Toronto East, September 2011 13