SlideShare uma empresa Scribd logo
1 de 23
Baixar para ler offline
Modeling the role of non-financial constraints in the
          development and adoption of new technologies
     Janne M. Korhonen (primary and corresponding author, responsible for background, theory,
                   analyzing the results of simulations and writing the article)

                                    janne.m.korhonen@aalto.fi

                      Mikito Takada (responsible for coding the simulations)

                                      mikito.takada@aalto.fi

        Suggested key words: Technology adoption; Innovation; Constraints; Environmental
                   innovation; Agent-based models; NK models; Copper mining

Earlier versions of this paper have been presented at PREBEM 2011 conference in Rotterdam
     and accepted for presentation at Organization Science Winter Conference 2012 pre-
                             conference event in Colorado Springs.


Abstract
This paper studies the effects of non-financial constraints (e.g. resource scarcities) on the
development and adoption of technologies. We build a simulation model of technology
development and adoption under constraints, and compare it to a case study from copper
mining industry. Rather than focusing on “jury-rigged” temporary solutions, we are
interested in innovations that remain in use even after the constraint has been lifted. The
results suggest that unexpected constraints only rarely lead to lasting innovations as such,
but they drive firms to adopt previously developed, more efficient technologies and
accelerate convergence to a dominant design. The effects are moderated mostly by
competitive intensity and the complexity of technologies. The results help to reconcile two
opposing viewpoints on the role of constraints and have public policy implications in e.g.
the success measures of “green growth” initiatives.


Introduction
Does necessity give birth to new, improved technologies? A burst of recent research
suggests that under certain circumstances, innovations (defined in this paper as the
implementation of ideas, procedures and structures that are novel to the organization; e.g.
Amabile et al., 1996) can be facilitated by introduction of constraints (Garud and Karnoe,
2003; Gibbert and Scranton, 2009; Gibbert and Välikangas, 2004; Gibbert et al. 2007;
Goldenberg et al., 2001; Hoegl et al. 2008, 2010; Moreau and Dahl, 2005; Peck et al. 2010;
Popp et al., 2011; Srinivas and Sutz, 2005; Starr and MacMillan, 1990; Välikangas and
Gibbert, 2005, Weiss et al., 2011). The conclusions of these studies broadly agree that
constraints (discontinuities that force firms to unexpectedly change its accustomed working
practices, e.g. tightening regulation, pollution limits, and resource shortages) may facilitate
innovation in some but not all conditions. For example, economic historians Rosenberg
(1976) and Hughes (1983) have argued that innovations tend to be made in response to
“bottlenecks” or technological “reverse salients,” and research on environmental innovation
has found that regulatory constraints are the primary driver of innovation (Popp, 2006; Popp
et al., 2011). Although meeting tightening regulatory and other challenges will clearly
require firms to adopt new technologies, the question whether constraints, as a rule, either


                                                                                             1  
benefit or hinder technological development remains open. If we define technological
development as a process towards increasingly efficient-for-purpose solutions to a given
problem, do constraints lead to less or more efficient solutions? In addition, studies on the
role of constraints potentially suffer from a selection bias, as only successful developments
tend to survive to be studied.

In fact, examples of innovation that have been clearly motivated by constraints but have
remained in use afterwards remain relatively scarce. In many cases where an invention
seems to have originated from a specific constraint, an argument can be made that (a) its
origins may be in development work done prior to constraint, even if the constraint was
unexpected (see e.g. Arthur, 2009; Schoenmakers and Duysters, 2010) and (b) its continuous
use may have been dependent on subsequent improvements and modifications that would
have not been possible under conditions of original constraints. Arguably, some constraints
can open previously blocked development paths and lead to overall higher performance.
Equally arguably, other constraints may result to paths that lead to lower performance.

This paper is positioned to extend the existing research on the role of constraints in
innovation (e.g. Hoegl et al., 2008, 2010; Gibbert and Scranton, 2009; Gibbert and Välikangas,
2004; Gibbert et al. 2007; Weiss et al., 2011), on the origins of radical innovations (e.g.
Schoenmakers and Duysters, 2010), and on regulation-driven innovation (e.g. Popp, 2006;
Popp et al., 2011). The main contribution of this paper is in developing a model for assessing
whether constraints – as a rule – tend to have positive or negative influences on the
development and adoption of novel technologies. The focus of this paper is on the most
interesting cases of constrained innovation: those where the innovation remains in use even
after the constraint is removed. A linked contribution is the assessment of the role of
constraints in the emergence of new technological paradigms (Dosi, 1982).

In addition, the micro-level dynamics of technology development and adoption as a result of
constraints are not clear. If constraints spur innovation, the effect of constraints should be to
increase the variety of technologies in use, at least temporarily. The evolutionary model of
technical change (e.g. Dosi, 1984; Nelson and Winter, 1982; Sahal, 1981) suggests that as old
path dependencies are loosened and dominant designs suffer from discontinuities, the
resulting “era of ferment” should bring about a period of technological experimentation (e.g.
Van de Ven and Garud, 1993; Abernathy, 1978; Basalla, 1989). Research so far has attributed
this variety creation either to exogenous stochastic technological advances that “extend” the
space of possible solutions (Dosi, 1982; see also Kaplan and Tripsas, 2008) or to differences in
cognition guiding actor’s framing and interpretation of the technology (Kaplan and Tripsas,
2008). The role of exogenous “limiting” discontinuities, i.e. constraints, is less studied. On
the other hand, the extent of technological experimentation should be moderated by the
companies’ need to quickly adopt workable solutions to their pressing problems. Therefore,
this paper attempts to model the interaction of these effects and determine which of the two
opposing forces - the variety-increasing fermentation or the variety-decreasing competitive
pressure – tend to be dominant in a discontinuity caused by the introduction of constraints.

The paper is structured as follows: first, we discuss prior research into the nature of
constraints and innovation. Second, we introduce a case study from copper manufacturing
industry. This study serves as a context and as an example for a simulation model of the
effects of constraints on innovation. We then compare the assumptions and the results in the
simulation to empirical observations. Finally, a discussion and conclusions is provided.


                                                                                               2  
The Nature of Constraints: some prior explorations
The role of constraints in innovation has been acknowledged for long in maxims such as
“necessity is the mother of innovation,” but research remains surprisingly rare. Constraints
are usually lumped together with other exogenous events that alter the environment where
firms operate. Explicit research on constraints has divided to two streams of research. The
“resource slack” research, focusing mostly on financial constraints, tends to either see
constraints as negative, limiting factors that bound individual and organizational
performance and limit exploration (e.g. Amabile, 1996; Ancona, 1990; Camison-Zornoza et
al. 2004; Damanpour, 1991; Gassman and von Zedtwitz, 2003; Nohria and Gulati, 1996). This
research stream makes an argument that innovators’ access to financial resources – resource
slack - is a key determinant of its performance.

The “breaking the barriers” research stream, on the other hand, sees constraints as “focusing
devices” (Bradshaw, 1992; Frenken, 2006) that help individuals and organizations focus their
attention and cognitive resources to overcome technological “bottlenecks” (Rosenberg, 1976)
or “reverse salients” (Hughes, 1983) that hold up technological progress. According to this
view, constraints force otherwise complacent firms to rethink traditional practices and adopt
new ways of working (Arthur, 2009; Gibbert and Scranton, 2009; Gibbert and Välikangas,
2004; Hoegl et al., 2008, 2010; Katila and Shane, 2005; Mone et al., 1998; Nonaka and Kenney,
1991; Srinivas and Sutz, 2005; Välikangas and Gibbert, 2005; Weiss et al., 2011). In support of
this view, research on environmental innovation has noted that regulatory constraints are
the key drivers of innovation in many industries (Popp, 2006; Popp et al., 2011).

However, the research findings are far from conclusive: for example, empirical evidence
suggests that abundant financial resources can also lead to unhealthy complacency and
favor incremental adaptation and exploitation instead of exploration (Mishina et al., 2004;
Tan and Peng, 2003). Similarly, the beneficial effect is tempered by e.g. increased
complexities introduced by additional design requirements (Arthur, 2009).

The diverging views have caused commentators to explain that innovations can happen
because of or despite constraints (Gibbert and Scranton, 2009; see also Weiss et al., 2011 and
Hoegl et al., 2010). A careful reading of literature suggests that these two, superficially
incompatible views can be reconciled. Constraints come in different forms, and while
exogenous non-financial constraints may very well cause eras of ferment that spur
innovation, financial constraints may make exploitation of these explorations difficult. Much
of the rest of this paper will explore the assumption, focusing on the non-financial
constraints and competitive dynamics.


Historical case study: resource constraints and the development of
autogenous copper smelting
In the first half of the 1900s, copper smelters used energy from coal, oil, gas or electricity to
smelt the ore. To improve the efficiency of the process, experiments in utilizing the latent
energy of sulfurous metal ores had been carried out since the 1870s, with first patents being
awarded in 1897 (Inco, 1955). In theory, by burning sulfur one might dispense with external
energy altogether. Some pilot plants with simple sulfur-burning or “autogenous” furnaces
were in fact built in the early 1900s (Newton and Wilson, 1942; Särkikoski, 1999; Inco, 1955)
but the technology’s limitations, uncertainties over recouping high fixed costs inherent in
industrial-scale trials, and a general lack of concern for energy efficiency prevented the
technology from taking root in the industry. Largely for these reasons, technological
progress within copper smelters was limited to minor improvements on existing furnaces.


                                                                                               3  
Birth of flash smelting
When research resumed after the interruption of the Second World War, autogenous
smelting was “discovered” again. In Canada, mining giant Inco pursued increased
productivity for its huge smelters (Saddington et al., 1966). Building on its pre-war research,
it quickly homed on newly available oxygen generators. Inco’s solution was essentially an
incremental improvement to its existing “reverberatory” furnaces: instead of fossil fuels,
tonnage oxygen was injected to ignite sulfur in pulverized ore concentrate. This almost
completely eliminated the need for fossil fuels, increased productivity, and reduced
emissions (Queneau and Marcuson, 1996). The resulting “Inco flash furnace” was
demonstrated on commercial scale in January 1952 (Queneau and Marcuson, 1996). As one
of the largest mining companies in the world, having essentially inexhaustible resources and
operating in a country untouched by bombings, Inco faced few to no constraints in R&D.

In contrast, a small, state-owned Finnish copper company Outokumpu was in dire straits.
Just before the war, Outokumpu had invested heavily in electric furnaces, completing the
world’s largest electric copper smelter in 1936. Unfortunately, one of the demands of the
1945 peace treaty stipulated that two large hydropower plants had to be ceded to the Soviet
Union. The resulting electricity shortage was an existential threat to Outokumpu
(Särkikoski, 1999; Habashi, 1993), The crisis gave precious little time to conduct extensive
research; furthermore, Outokumpu’s access to advanced technology was severely curtailed
by post-war disruptions and currency limitations. These effectively precluded foreign
technology purchases (Särkikoski, 1999; Habashi, 1993; Bryk et al., 1958).

Fortunately, familiarity with pre-war research and practice provided them with components
necessary for a “novel” innovation. Developed in just about three months in late 1945,
Outokumpu flash furnace integrated a pre-existing idea - burning pulverized ore
concentrate - with components and know-how from coal power plants and sulfur-extracting
roasting furnaces (Särkikoski, 1999). Instead of unavailable, electricity-dependent oxygen
generators, Outokumpu’s furnace design used waste heat from outgoing flue gases to
preheat incoming air. Sulfurous ore could then be injected to the hot air and ignited.
Outokumpu’s flash furnace was demonstrated in commercial scale in February 1947.
Ironically, the electricity rationing that had inspired Outokumpu’s development efforts was
lifted just three months before the first flash furnace went operational.

Spread of flash smelting: emission controls and the 1973 energy crisis
The first licensee for Outokumpu was the modernized Ashio smelter in Japan, which
contracted for a complete turnkey delivery in 1954. After this initial reference, two major
constraints facilitated the spread of Outokumpu’s technology. The first constraint became
apparent in the early 1960s, as copper industry was increasingly put to account for its
harmful emissions. Starting from Japan, many copper producers concluded that modifying
their existing furnaces to comply with tightening emission controls would be uneconomical.
Outokumpu’s solution provided easier emission control, and as a bonus, would increase
energy efficiency as well. This resulted to sales to nine smelters (see Figure 1).

The second major constraint was the 1973 energy crisis. While environmental regulations
were tightening as well, this time the key driver was energy efficiency. Combined, these two
reasons caused ten additional smelters to adopt Outokumpu furnaces between 1973 and
1990 (Särkikoski, 1999). At the same time, the old mainstays (reverberatory, blast and electric
furnaces) became uneconomical for energy and environmental reasons. This led to a
consolidation of industry and left Outokumpu’s furnace the dominant design in newer,
larger copper smelters.


                                                                                             4  
Figure 1. Technologies used at major copper smelters, 1930-1990. Data from Biswas and
Davenport (1976), Davenport et al. (2002), and U.S. Bureau of Mines Minerals Yearbooks,
1933-1990. (Note: As furnace sizes vary and a smelter may operate more than one furnace,
the graph shows smelters using particular furnace technology, rather of the total number of
furnaces.)


In contrast, Inco was never particularly interested in technology sales. In fact, for the first 25
years Inco did not license its technology to anyone. This was largely due to a potential threat
for Inco’s mainstay nickel business, as the furnace type was particularly economical for
nickel smelting as well (Brundenius, 2003). Another likely factor was that income from
technology sales would have been barely visible on giant Inco’s balance sheet; for example,
the contract with Ashio smelter was worth only $156 000, or around $1.3 million in 2011
money (Särkikoski, 1999). It is worth noting, though, that Inco’s method did remain
technically superior up until to the 1970s, with lower overall energy consumption and
higher productivity (Biswas and Davenport, 1976). However, when Outokumpu introduced
oxygen injection in the 1970s, the technological gap nearly disappeared (Figure 2).


                                                                                                5  
Figure 2. Efficiency and productivity developments in copper furnaces (Biswas and
Davenport, 1976; Bryk et al., 1958; Davenport et al., 2002; Saddington et al., 1966).

Why, then, other manufacturers failed to develop flash technologies? Based on the evidence,
the most probable reason seems to be that they lacked a compelling reason to do so. In a
commodity business where investment costs are high and competition intense, developing
or adopting untested processes represents a substantial risk for the operator. As previous
research (e.g. Popp, 2006; Popp et al., 2011) has shown, regulatory or other constraints were
usually needed to persuade producers to develop or adopt new technologies.

It is very likely that Outokumpu itself wouldn’t have taken the gamble without the
constraint imposed by the post-war energy shortage. In fact, it is uncertain whether it would
have even adopted the technology, had the electricity rationing simply been lifted before the
first flash furnace was completed. A comparison can be made to Boliden, in many ways a
similar copper company in neighboring Sweden. When Boliden redesigned its Rönnskär
smelter in 1948, it simply adopted tried and tested electric furnaces supplied with abundant
electricity from Swedish hydropower plants (Herneryd et al., 1954).


Modeling constraints with an NK framework
Although the case study strongly suggests that constraints can advance technological
change, the evidence on the overall effects of constraints is inconclusive. Developing proper
case studies is hampered by the lack of reliable accounts describing the birth of constraint-
induced innovations. What studies there are tend to focus on “success stories,” raising a
question of selection bias. Furthermore, when studying the effects of constraints on the
evolution of technology, the theoretical focus is on longitudinal and nonlinear dynamics.
These conditions make simulations an attractive methodology (Davis et al., 2007, p. 481)

To experiment with history, we have created a simplified model of innovation and
disruptions caused by introduction of constraints. The model is based on NK fitness
landscapes, originally introduced by Anderson (1983; 1985) and famously adapted by
Kauffman (1993) to the study of evolutionary biology. The NK model has been previously
used in important work in strategy and organizational literature (Levinthal, 1997; Levinthal
and Warglien, 1999; Rivkin, 2000; Rivkin and Siggelkow, 2002). The model has also been


                                                                                           6  
previously used to study innovations in a manner very similar to this present work (e.g.
    Almirall and Casadesus-Masanell, 2010; Ethiraj and Levinthal, 2004; Frenken et al., 1999;
    Frenken, 2006). Although simulation studies of innovation are becoming more common, we
    do not know of prior efforts to simulate explicitly the effects constraints have on innovation.

    Modeling the effects of constraints
    In order to study the effects of disruptions due to constraints in as simple model as possible,
    we consider technologies that utilize N components. These components represent the
    decisions and trade-offs that the designer needs to take account when designing a
    technology, e.g. different materials, differing energy sources, different subsystems, different
    requirements, or different ways of organizing a group of people. Although a more general
    model (e.g. Valente, 2008) would allow for more than two states per component, the
    common binary (0/1) assumption results to the simplest and most tractable model without
    undue loss of generality. Therefore, in our model, the simulated organizations have to make
    decisions concerning N components, with each decision having two options.

    Each combination of N options is assumed to lead to a different performance of the
    technology. In other words, there is a mapping between the “design” of a technology and its
    performance. We consider “performance” to be an abstract value that denotes the
    “goodness” or “fitness” of the technology, for example, its productivity. As is the
    convention in the literature utilizing NK models, for reasons of simplicity most parameters
    can be considered exogenous and fixed for the duration of each simulation run, without
    detracting from the simulation’s usefulness (see e.g. Sorenson, 2002).

    Representing technology and its performance in the NK model
    Formally, a technology is represented in the NK model by a string R of N components (r1, r2,
    … rN), where each ri represents a choice of {0, 1}. These realized choices contribute to the
    overall fitness, or performance, W of the technology so that each possible choice
    configuration Ri has an individual Wi. The complexity of the technology is modeled with a
    variable K, which determines the “interconnectedness” of the components. Thus, the
    contribution wi of each resource ri depends on K other components. For each of 2K possible
    combinations, a value is drawn from a uniform distribution over the unit interval [0, 1]. The
    overall performance W of each individual technology string is the average over N value
    contributions, and each individual technology string has a specific performance W.
                       N

                       ∑ w(r ;r ,...,r
                             1   i1   iK   )
                       i=1
    W (r1,...,rN ) =
                                 N                                                     (1)


€   In the equation, rij j = (1, … , K) are the combinations of the K components that are
    interconnected with the component ri. As is the norm in the literature, in absence of specific
    knowledge, we assume that interdependencies are determined randomly.

    Search strategies: incremental (local) and radical (long jumps)
    In short, the model represents a possibility space where individual firms search for the best
    possible technology among 2N possible resource configurations. In practice, the search
    proceeds by the firms varying the configuration of one resource at a time. There are various
    search strategies the firms could possibly use in this landscape, but we assume that firms
    look at the alternatives that are one step away from their current position, and then select
    the first alternative that increases the technology’s performance. If the firm cannot alter any


                                                                                                 7  
configuration without decreasing the performance, the search will stop. This local search is
the simplest search heuristic that captures the idea that firms cannot know in advance which
combinations of features would eventually provide the best overall performance. Although
most literature assumes that firms look at all the alternatives and select the best one (so-
called “greedy search;” see e.g. Frenken, 2006), we feel that our assumption captures slightly
better the incremental, somewhat unplanned and uncertain nature of technological
development and technological path dependency (e.g. Dosi, 1982; in addition, Ward, 1994
proposed a “path of least resistance” model of creativity which leads to the same
conclusion). Because this local search stops once there is no more room for improvement, it
is prone to get trapped into local maxima when the mapping is complex. This represents the
effects of path dependency and the difficulties firms have in “switching the horse” due to
financial and psychological reasons. As an example drawn from the case study, several
authors (e.g. Särkikoski, 1999; Biswas and Davenport, 1976) have noted that copper smelters
have historically been reluctant to radically alter their operations before the need becomes
compelling.

We have also modeled an alternative to local search, called “long jumps.” These represent
radical innovations, and are initiated if a firm finds its technology’s performance to be less
than a predetermined percentage of industry average. As usual in the literature, radical
innovations are represented by the firm randomly drawing a new string r + R. The length of
new string r is varied in different simulations so that 1 ≤ r ≤ R, i.e. r components are changed
simultaneously and (R – r) components are retained. This variable length of the new string
represents different “search distances,” and can be conceptualized as the breadth of ideas
designers can use when trying to design around the constraint. If the new string’s
performance is an improvement to old string, it is adopted.

Modifications to the basic NK model: competition and constraints
We have added two modifications to this general NK framework to model the dynamics of
firms competing in the same marketplace and effects of constraints. First, to model the
competitive dynamics affecting the development of technologies, we allow better-
performing technologies to be imitated. The imitation is initiated similarly to long jumps. If
a firm’s technology lags sufficiently behind the industry average in performance, it chooses
randomly between long jump and imitation. As is customary in the literature (e.g. Kauffman
et al., 2000; Ethiraj and Levinthal, 2004; Almirall and Casadesus-Masanell, 2010), the
imitating firm chooses a better-performing technology at random, with the likelihood of a
particular technology being chosen being proportional to its performance. In other words,
better technologies have a better chance to be copied and thus they spread in the
marketplace. It is worth noting that our model is equivalent to a model where firms whose
performance is sufficiently poor exit the market and are replaced by new entrants either
adopting a “best available” technology or developing new technologies.

Second, the effect of constraint is modeled by forcing the firms to set the configuration of
one (or more) component to “1” for the variable duration of the constraint. This represents a
sudden lack of some critical component, introduced by some exogenous supply shock such
as material shortage, war, or changing regulation. As long as the constraint is in force,
imitation and long jumps are limited to strings that comply with the constraint. Otherwise,
firms are free to long jump and copy any string that fits the criteria outlined above.

This simple model corresponds to an absolute resource constraint, where a particular
component (i.e. configuration “0”) is no longer available at any price. Although many real-
life constraints are not absolute, and instead only increase the price of a component, we
believe our abstraction captures the essence of constraint’s impact - that a firm needs to


                                                                                              8  
develop an alternative - in a simple yet effective way. In the view of example case presented
above, we think this simplification is defensible.

Finally, we are especially interested in the performance of novel technologies once the
original constraint has been lifted. To this end, the constraints last only a variable number of
turns, after which the firms are free to change the constrained component’s configuration.

Simulation mechanics
For this paper, we have set N = 16. We completed multiple series of simulation sequences
with varying parameters for imitation propensity, long jump search length, and complexity
K of the technology. Each simulation sequence contains 50 individual simulation runs for
each K = 0…15. The performance landscape and starting technologies for 100 individual
firms are determined randomly for each run. During runs, firms search the landscape for the
technology that offers the highest performance (local maxima), measured by fitness W. The
constraint is introduced at turn 15, when all firms have already found their local maxima.
The constraint forces all the firms to alter the state of one predetermined component to “1.”
In these simulations, the constraint lasted five turns and was lifted at turn 20. All the
simulation runs had found a new, stable local maximum by turn 30.

Each simulation sequence therefore includes 800 simulation runs, 50 for each K value.
Simulation series consist of multiple sequences, where other parameters are altered. The
main parameters altered between simulation series are represented in Table 1. We also
explored the simulation’s robustness to parameter changes and possible hidden
nonlinearities. These robustness checks included testing with variable constraint durations,
variable number of organizations (10, 50, 100, 150 and 200), and with more than one
component’s configuration constrained. We also tested the simulation’s behavior when the
search dynamic was replaced with random mutations. In addition, the simulation’s behavior
at close to extreme values of imitation/long jump threshold (1% and 99%) was tested. The
simulation’s behavior appears linear and the results are broadly robust to these changes. The
exception is that random mutation search produced a slightly different performance bias.
This difference will be discussed below.


Table 1. Simulation parameters.

Simulation series                        1. Varying imitation         2. Long     jumps
                                         threshold                    allowed
Imitation/long jump threshold*           0-100%, 5% increments        75%
Long jumps enabled                       No                           Yes
Long jump search distance                -                            1-16
Simulations sequences                    21                           16

* = Imitation/long jump threshold is the percentage of average performance that triggers either
imitation of more successful technology or a long jump. If long jumps are enabled, the firm has an
equal probability either to imitate or long jump.


The simulation was build by extending a freely available Sendero NK model (Padget et al.,
2009) in RePast/J environment. Source code and the data can be obtained from the authors.


                                                                                                9  
Simulation results
As the core interest of this paper is to examine how unexpected constraints affect the
evolution of technology, we begin by comparing the effects of constraint on average
performance achieved over multiple simulation runs. We then describe how changes in
parameters affect the odds of positive or negative change as a result of a constraint. We also
study the role of constraints in the emergence of novel technologies. Finally, using entropy
statistics, we analyze the effects constraints have on the variety of technologies in use. Due
to large number of individual simulation sequences and relative robustness of the results,
this paper concentrates on six representative simulations. The simulations and their
parameters are described on Table 2 below.

Table 2. Summary of parameters of representative simulations.

Simulation name                                   Imitation     Long       Long    jump
                                                  threshold     jumps      length
a) No imitation allowed                           -             No         -
b) Imitation threshold at 75 %                    0.75          No         -
c) Always imitate                                 1.00          No         -
d) Radical innovation, short search               0.75          Yes        N/8 (2)
e) Radical innovation, medium search              0.75          Yes        N/2 (8)
f) Radical innovation, distant search             0.75          Yes        N (16)


The effects of constraints on average performance
For all individual simulated firms in each run, we calculated the difference AFT – BEF,
where AFT denotes the firm’s technology’s average performance after the constraint (at turn
30) and BEF the average performance before the constraint (at turn 14). This results to a
dataset of 5000 observations per K value for each simulation setting.

To determine whether constraints generally are beneficial or harmful, we calculated the
average and standard error of these observations for each K value. The results for six
representative simulation sequences are plotted in Figure 3. The left-hand vertical axis
marks the change in average performance AFT – BEF as a percentage of average
performance before constraint. The horizontal axis represents the K value. Error bars
indicate standard errors of the mean, black dotted lines indicate one standard deviation
from the mean, and the red horizontal lines mark the level of zero change. Finally, thick red
solid line and right-hand vertical axis measure average performance after constraint.

As can be seen, on average, constraints have a very slight but positive effect to the
performance of simulated technologies. However, the changes are only rarely statistically
significant. In addition, variability – as indicated by the dotted line marking one standard
deviation from the mean – is relatively high for all but the simplest technologies (low K
values). The interpretation is that constraints have a nearly equal likelihood of either helping
or hindering technological progress, but they come with a slight positive bias. The finding is
consistent with the dichotomous nature of previous literature on the effects of constraints
(e.g. Hoegl et al., 2008; Gibbert et al., 2007; Välikangas and Gibbert, 2005; Weiss et al., 2011).

The results are very robust over a wide range of simulation parameters. Changing the search
dynamics to random search produces essentially the same result, although the bias then
becomes slightly negative and variance increases. The only notable anomaly observable in
the results is that both the largest losses and greatest gains in average performance were
seen in the simulations where competition was most intense (imitation threshold near or at
100%). Three factors account for this difference: first, more homogenous industries have less


                                                                                               10  
variety to start with. When a constraint is imposed, lack of variety means lack of options that
could act as platforms for further development. Second, more intense competition does not
give time for technologies to fully develop. Even a promising technology path is likely to be
abandoned, if it doesn’t provide clear and immediate benefits. As a result, breaking the path
dependency and developing truly novel alternatives becomes difficult. Thirdly, however,
intense competition also ensures that if the constraint leads to a performance breakthrough,
it is speedily adopted throughout the industry.

                                                 a) No imitation allowed                                                                       d) Radical innovation, short search


                                                                                                       1.0


                                                                                                                                                                                                         1.0
                        4


                                                                                                                          4
                        2


                                                                                                                          2
     Change (percent)


                                                                                                       Change (percent)
                                                                                                            0.8


                                                                                                                                                                                                         0.8
                        0


                                                                                                                          0
                        -2


                                                                                                                          -2
                        -4


                                                                                                                          -4
                                                                                                       0.6


                                                                                                                                                                                                         0.6
                             0   1   2   3   4   5    6    7   8    9    10   11   12   13   14   15                           0   1   2   3     4   5   6   7    8    9   10   11   12   13   14   15

                                                          K value                                                                                            K value


                                             b) Imitation threshold at 75%                                                                 e) Radical innovation, medium search
                                                                                                       1.0


                                                                                                                                                                                                         1.0
                        4


                                                                                                                          4
                        2


                                                                                                                          2
     Change (percent)


                                                                                                       Change (percent)
                                                                                                            0.8


                                                                                                                                                                                                         0.8
                        0


                                                                                                                          0
                        -2


                                                                                                                          -2
                        -4


                                                                                                                          -4
                                                                                                       0.6


                                                                                                                                                                                                         0.6
                             0   1   2   3   4   5    6    7   8    9    10   11   12   13   14   15                           0   1   2   3     4   5   6   7    8    9   10   11   12   13   14   15

                                                          K value                                                                                            K value


                                                     c) Always imitate                                                                     f) Radical innovation, distant search
                                                                                                       1.0


                                                                                                                                                                                                         1.0
                        4


                                                                                                                          4
                        2


                                                                                                                          2
     Change (percent)


                                                                                                       Change (percent)
                                                                                                            0.8


                                                                                                                                                                                                         0.8
                        0


                                                                                                                          0
                        -2


                                                                                                                          -2
                        -4


                                                                                                                          -4
                                                                                                       0.6


                                                                                                                                                                                                         0.6


                             0   1   2   3   4   5    6    7   8    9    10   11   12   13   14   15                           0   1   2   3     4   5   6   7    8    9   10   11   12   13   14   15

                                                          K value                                                                                            K value


Figure 3. Mean change (thin line with error bars) and average performance (thick line)
after constraint. Error bars indicate standard error, dotted line one standard deviation.

Odds of change: how likely are the improvements?
To gain more detail about the effects of constraints, we plotted the likelihood a constraint
would spur an individual firm to improve its technology. The odds of change were
determined by calculating the number of observations exhibiting positive, negative or no
change when comparing performance before and after the constraint. The results,
cumulatively plotted to two tables, are presented in Figure 4 below.


                                                                                                                                                                                                               11  
In each plot, the area below lower lines represents the percentage chance of constraint to
result to performance decreases. The area above upper lines represents the chance for the
constraint to increase performance. The area between two sets of lines represents the chance
that constraint has no effect in performance. The dashed horizontal line denotes 50% chance.

The plots reveal that the probability for both positive and negative change increases as
complexity K increases. Increasing the imitation intensity parameter above 80% (imitation
threshold) produces results that differ most from the overall trend. In all cases, the most
probable outcome is no performance change.

Allowing firms to search farther for radical innovations does not have an appreciable impact
on the probabilities. As can be seen from the near-identical plots, the odds are largely
determined by imitation threshold (set to 75% in radical innovation simulations). In short,
more options may not translate to better odds, and as Figure 3 above shows, there is little to
no direct performance benefit either.


Figure 4. Odds of change. Left panel with varying imitation thresholds, right with varying
radical innovation search lengths. Variance on left panel is exclusively from high
imitation threshold (>70%) simulations.

The influence of constraints on the emergence of novel technologies
In many simulations, the technologies that were ultimately used to “go around” the
constraint were not developed as a response to the constraint: often, simulated firms had
used them even before the constraint was introduced. To determine the extent to which pre-
existing designs were used and the likelihood of novel technologies emerging as a result of
constraint breaking the technological path dependency, we compared the technologies in
use before the constraint to technologies being used at the end of the simulation. The results
of this comparison, along with average performance achieved, are plotted on Figure 5
below. In the plots, black line represents the percentage of pre-existing technologies out of
all technologies in use at the end of the simulation (i.e. 100% indicates that all technologies
in use at the end were in existence before the constraint). Error bars indicate standard errors
of the mean, and dotted black line marks one standard deviation.


                                                                                            12  
a) No imitation allowed                                                                                   d) Radical innovation, short search
                                   100


                                                                                                                                                 100
                                   80


                                                                                                                                                 80
     % pre-existing technologies


                                                                                                                   % pre-existing technologies
                                   60


                                                                                                                                                 60
                                   40


                                                                                                                                                 40
                                   20


                                                                                                                                                 20
                                   0


                                                                                                                                                 0
                                         0   1   2   3   4   5    6    7   8    9    10   11   12   13   14   15                                       0   1   2   3     4   5   6   7    8    9   10   11   12   13   14   15

                                                                      K value                                                                                                        K value


                                                         b) Imitation threshold at 75%                                                                             e) Radical innovation, medium search
                                   100


                                                                                                                                                 100
                                   80


                                                                                                                                                 80
     % pre-existing technologies


                                                                                                                   % pre-existing technologies
                                   60


                                                                                                                                                 60
                                   40


                                                                                                                                                 40
                                   20


                                                                                                                                                 20
                                   0


                                                                                                                                                 0


                                         0   1   2   3   4   5    6    7   8    9    10   11   12   13   14   15                                       0   1   2   3     4   5   6   7    8    9   10   11   12   13   14   15

                                                                      K value                                                                                                        K value


                                                                 c) Always imitate                                                                                 f) Radical innovation, distant search
                                   100


                                                                                                                                                 100
                                   80


                                                                                                                                                 80
     % pre-existing technologies


                                                                                                                   % pre-existing technologies
                                   60


                                                                                                                                                 60
                                   40


                                                                                                                                                 40
                                   20


                                                                                                                                                 20
                                   0


                                                                                                                                                 0


                                         0   1   2   3   4   5    6    7   8    9    10   11   12   13   14   15                                       0   1   2   3     4   5   6   7    8    9   10   11   12   13   14   15

                                                                      K value                                                                                                        K value


Figure 5. Share of pre-existing technologies out of all technologies in use after a constraint.
Error bars indicate standard error, dotted line one standard deviation.


The results indicate that in general, well over half of the technologies used at the end of the
simulation existed before the constraint. In environments where imitation is intense, over
80% of technologies may be pre-existing, although variability tends to be very high: cases
where no technologies were in use before constraint are relatively common, as well. As
explained previously, the dynamics of intense competition can produce both results, and
thus help explain the dichotomous nature of previous explorations.

As was the case with performance, allowing radical innovation does not greatly influence
the results. It is also worth noting that the results are statistically more robust than the
results on average performance. Interestingly, the results are robust to the number of
organizations (i.e. initial starting positions).

The figures only include technologies that were identical to those existing before the
constraint. This further underestimates the importance of pre-existing technologies, as
observations of individual simulations suggest that firms may copy an existing “constraint
immune” technology at the beginning of the constraint, and then develop it into a novel


                                                                                                                                                                                                                                 13  
technology. However, measuring this effect and differentiating between imitation and
independent but convergent development was not feasible with the current data set.

These findings suggest that constraints are more likely to cause firms to adopt existing
technologies than to spur them to develop radically new technologies.

The effect of constraints on technological variety
A positive change in average technological performance can result from either firms
developing new, superior technologies, or from imitating existing (or recently developed)
technologies from other firms. The intensity of imitation can be analyzed by calculating the
entropy statistics for the technologies in use before and after the introduction of constraint
(Frenken, 2001).

Entropy statistics applied to frequency distributions of individual “designs” (16-bit strings)
can describe the evolution of a technology in terms of the changes in the degree and nature
of product variety (Frenken, 2001:138). The entropy of the distribution of designs indicates
the extent to which the designs within an “industry” (individual simulation) are
characterized by “dominant designs.” Maximum entropy corresponds to the case in which
all designs occur at the same frequency, and minimum entropy (zero) to the case in which
there is only a single design that is used by all firms in the simulation. We calculate the
entropy H of an N-dimensional distribution (Theil, 1972: 116, 155) as follows:


where ij…w are individual components and pij…w is the frequency at which a design with
components ij…w occurs. The entropy H is measured in bits.

The results for representative simulations are displayed in Figure 6 below. The figures plot
mean entropy during simulation runs for five component interdependency settings (K = 0, 4,
8, 12 and 15). Hatched area indicates the period during which constraint is applied (turns 15-
20). Standard errors of the mean are too small to be visible.

The plots show that no-interdependence technologies (K = 0) reach quickly the global
optima, i.e. single optimum configuration, where entropy is zero. As interdependence K
between components increases from zero, the variety of feasible designs increases as well.
Applying the constraint reduces the variety of feasible designs. In simulations where
imitation is allowed, constraints also create an incentive to copy better-performing
technologies, further reducing variety. Panel c) in Figure 6 illustrates what happens when
competition is extremely intense: only a few designs, at most, survive even before the
constraint, and fewer still after. In short, constraints lead to a marked decrease in the
technological variety, especially when competition is intense (high imitation trigger value).


                                                                                           14  
Figure 6. Mean entropy (average variety of technologies in use) in representative
simulations. Hatched rectangles indicate turns when constraint is in force.


Robustness and limitations: comparison with the case study
The robustness, validity and generalizability of simulation studies should always be
assessed carefully. We believe that the basic assumptions (technological development as a
myopic process, path dependency, the role of constraints, and competition) made in this
study hold relatively well for many real-life contexts. In the following, we first compare the
assumptions made in the simulations to observed historical dynamics. We then compare the
results of the simulations to observed realities.


                                                                                           15  
Comparison of simulation assumptions to historical dynamics
The comparison of assumptions made in the simulation model with the dynamics observed
in reality shows that the assumptions seem to match reality relatively well. Based on
technical literature (Biswas and Davenport, 1976; Davenport et al., 2002; Kojo and Storch,
2006; Kojo et al., 1999; Queneau and Marcuson, 1996; Saddington et al., 1966) and interviews
with copper metallurgists, copper furnaces can be conceptualized as a technology with
approximately 16 important design dimensions, or components (N), with 2-3 alternatives
and roughly 3-5 important interdependencies (K) between components. The dimensions on
Table 3 below can define all the copper smelting technologies used between 1930 and 1990.

For the most part, technological search in the copper industry was “local” and concentrated
on incremental improvements of existing technologies. Investments in existing technologies
and high capital costs meant that firms had to have considerable incentive before changing
their technologies. The performance of competing solutions was relatively straightforward
to measure, for example as tons of processed concentrate per day or as cost of copper
produced. Firms whose technologies were not performing did license or copy better
technologies. Although the imitation threshold level that corresponds to the historical case is
impossible to quantify exactly, we feel that a plausible case can be made for a realistic
threshold level being in the 75-95% range for the most of the time period under study.
Finally, real-life constraints clearly had uneven effects on technologies used.

Table 3. Copper furnace design dimensions. Approximate N ≈ 16, K ≈ 4.

Design dimension                            Primary alternatives
Furnace direction                           Horizontal, vertical
Furnace shape                               Rectangular, round
Smelting reaction type                      Bath reactions, suspension reactions
Energy source                               Fossil fuels, electricity, autogenous
Gas blow                                    Not used, burners/tuyeres/lances
Blast preheat                               Not used, used
Oxygen injection                            None, enrichment, significant
Ore granularity requirements                None, fine ore required
Ore moisture requirements                   None, dry ore required
Waste heat recovery                         Not used, used
Sulfur dioxide (SO2) recovery               No concern, necessary
Offgas SO2 concentration                    Dilute, concentrated
SO2 leaks                                   No concern, should be minimized
Dust evolution                              No concern, should be minimized
Cooling                                     Convection, watercooled
Time between refurbishments                 Less than 1 year, up to 2 years, longer


                                                                                            16  
Comparison to simulation results
The case briefly outlined above can be thought to represent three consecutive resource
constraints – post-war energy scarcity, introduction of emission control regime, and the 1973
energy crisis. The dynamics represent one relatively typical outcome observed in
simulations where imitation threshold is moderate to high (over 70%). In these simulations,
it is common for one or two “superior” technologies to emerge before the constraint.
However, most firms lack an incentive to adopt these immediately. Only firms unable to
cope with their existing technology, like the Ashio smelter in the case study, adopt it.

Constraints can often change the situation. In simulations where a superior technology
exists and remains unaffected by the constraint, there is a high likelihood that firms will try
to imitate it. In these cases, it is typical for average performance to increase. Furthermore,
this new technology may offer new opportunities for further development, which increase
the performance even further. The parallels to the case study above are obvious.

The validity of the simulation seems to be enhanced by the fact that parallels to all three
consecutive real-life constraints and their dynamics can be found from the simulations. For
just one example, see Figure 7 below. It details a simulation run where resource constraint
resulted to the abandonment of old technologies, and to the emergence of improved
technology. The parallel to the Outokumpu case would be even more evident if simulated
firms had not been able to “license” technology 2, and had instead turned to technology 1.


Figure 7. Example of simulation dynamics: constraint eliminates one technology, damages
another, which then improves to become the best-performing technology.

Limitations of the study
Based on the above comparisons, we feel that our simulation captures the essential
dynamics of many process industries (e.g. mining, metals manufacturing and energy
generation), where the performance of a technology is relatively straightforward to measure
(e.g. processing capacity) and high capital costs hinder technological experimentation.
However, the results may not be generalizable to industries where experimentation is easier
and/or performance measurements are more ambiguous. In addition, the simulations
assume that the “need” must be fulfilled by some technology. It is entirely conceivable that a
resource constraint causes a broader realignment and a reconsideration of what is “needed”
and how the need can be alternatively satisfied. In those cases, the dynamics might differ.


                                                                                            17  
Discussion, conclusions, and implications for future research
The motivation driving this research was the paucity of empirical studies on the effects non-
financial constraints have on the development of technology and technological change. As
e.g. Gibbert and Scranton (2009) and Hoegl et al. (2010) have already proposed, the
simulations suggest that constraints themselves are largely a neutral force: they are nearly
equally likely to lead to the development and adoption of superior or inferior technologies.
They are not very likely to lead to adoption of completely new technologies; in most cases,
adopted technologies had existed prior to the constraint. The outcome is surprisingly
resistant to changes in parameter values, remaining even if radical innovation is allowed to
break the path dependency. These results are in line with research by e.g. Schoenmakers and
Duysters (2010), who concluded that radical innovations re-used existing technologies to a
large extent.

Nevertheless, the study also shows that constraints can lead to development and adoption of
superior technologies. The dichotomous nature of previous work on resource slack on the
one hand (e.g. Amabile, 1996; Ancona, 1990; Camison-Zornoza et al. 2004; Damanpour, 1991;
Gassman and von Zedtwitz, 2003; Nohria and Gulati, 1996) and the “breaking the barriers”
on the other (e.g. Arthur, 2009; Gibbert and Scranton, 2009; Gibbert and Välikangas, 2004;
Hoegl et al., 2008, 2010; Katila and Shane, 2005; Mone et al., 1998; Nonaka and Kenney, 1991;
Srinivas and Sutz, 2005; Välikangas and Gibbert, 2005; Weiss et al., 2011) on the nature of
constraints could thus be explained: both views – that constraints impoverish and that they
facilitate – seem to be correct and can be justified.

However, the case may be that constraints do not tend – as a rule – to produce significant
technological breakthroughs, and research based on “success stories” may be somewhat
biased. If the simplified dynamics used in these simulations hold even approximately, this
paper could explain why there are only a few success stories whose origin can be traced to a
constraint. All other things being equal, instead of spurring new technological advances,
constraints seem to play a more limited role by forcing companies to adopt new
technologies. Previous research (e.g. Popp, 2006; Popp et al., 2011) has concluded that
regulatory constraints are the primary driver of innovation. A more nuanced reading might
be that constraints are an important driver for adoption of innovations, not so much for
developing them. A sudden need that makes existing technologies perform poorly at the
task – a constraint – directs the search more towards existing instead of novel solutions.

In particular, firms operating in intensely competitive environments may be faced with a
need to quickly find a satisfactory technology, by copying or otherwise, or exit the market.
The end result for this intense competition may be that variety of technologies used will
decrease, better technologies cannot be developed, and industries become more vulnerable
to future constraints, as a “monoculture” of dominant designs takes over the industry1.

These results are of interest to the evolution of technology research stream. Previous
research (e.g. Dosi, 1982; Kaplan and Tripsas, 2008) does not usually distinguish between
different kinds of discontinuities. The results presented suggest that the effects of different
exogenous discontinuities may not be symmetrical, and further research towards prying
open the impact different discontinuities have might be worthwhile.


1 Although constraints were introduced only once for each simulation, the difference between
“before” and “after” states in simulations with high imitation intensity is only that the variety of
technologies in use has decreased even further. Should such an “industry” suffer another constraint,
it is very likely that its performance would decline even more.


                                                                                                                   18  
Overall, the research adds to the literature on innovation and technology adoption by
providing a plausible explanation for the conflicting views on the role of constraints in the
evolution of technology, and point towards further, empirical research to validate the
patterns detected in the simulations. For example, are technological advances discontinuities
that explicitly improve the performance of technologies, or are the dynamics more complex
than that? Future research might also try to establish whether a success bias exists in
previous research on constrained innovation, and to what extent constraints act as drivers
for adoption of previously developed technologies. Further research would also be
beneficial to verify the conclusions of this study and to identify factors that influence
whether constraint impoverish or facilitate.

In addition to theoretical interest, the results presented here have at least two implications
for public policy. First, as Popp et al. (2011) point out, innovation and efficiency are not the
same things. As this paper illustrates, although constraints such as changes in regulatory
regime may very well drive development and adoption of new technologies, there is no
guarantee that they will also drive improvements in technology. Policy-makers and interest
groups in many countries have claimed that tightening regulation – for example, CO2
emission standards – will drive innovation, and hence increase prosperity while decreasing
harmful side effects. While this is a possibility, our findings warn against overreliance on the
number of innovations or patents as a measure of efficacy for such schemes. Tightening
regulations will probably spur the development and, in particular, adoption of new
technologies, but the net impact cannot be quantified simply as a number of patents or with
some similar measure. A need for further research on better indicators is obvious.

Second, this paper highlights the prevalence of adopting existing technologies as a response
to constraints; as argued above, many “constraint-induced innovations” can in reality be
adaptations of already existing technologies. The role of constraint would then be to
actualize the need for these technologies or provide a stimulus for actually funding them.
Once investments are made and the industry has converged on a single dominant design,
breaking the path dependence will be difficult. An important implication would be that
constraints such as energy and material shortages or regulatory changes will be “come as
you are” crises: there will be little opportunity to wait for developing technologies, as
individual users will adopt (and be locked into) best available existing technologies –
whatever those may be. If true, the likely effects of such shortages could be largely assessed
in advance. Or, as science fiction author William Gibson put it succinctly, “the future is
already here – it’s just not very evenly distributed.”


Acknowledgements
This research was supported in part by generous grants from the Foundation for Economic
Education and Jenny and Antti Wihuri Foundation. The authors would like to thank
professor Liisa Välikangas, professor Jaakko Aspara, Matthias Weiss and Matthew R.
Karlsen for their valuable comments and suggestions.


                                                                                             19  
References
Abernathy, W. J. (1978). The Productivity Dilemma: Roadblock to Innovation in the Automobile
     Industry. Baltimore: Johns Hopkins University Press.
Almirall, E., & Casadesus-Masanell, R. (2010). OPEN VERSUS CLOSED INNOVATION  :
     Academy of Management Review, 35(1), 27-47.
Amabile, T. M. (1996). Creativity in Context. Boulder, Colorado: Westview Press.
Amabile, T. M., Conti, R., Coon, H., Lazenby, J., & Herron, M. (1996). Assessing the work
     environment for creativity. Academy of Management Journal, 39(5), 1154–1184.
Ancona, D. G. (1990). Outward bound: strategies for team survival in an organization.
     Academy of Management Journal, 33(2), 334-365.
Anderson, P. W. (1983). Suggested mode for prebiotic evolution: The use of chaos.
     Proceedings of the National Academy of Sciences of the United States of America, 80, 3386.
Anderson, P. W. (1985). Spin glass Hamiltonians: A bridge between biology, statistical
     mechanics and computer science. In D. Pines (Ed.), Emerging synthesis in science:
     Proceedings of the Founding Workshops of the Santa Fe Institute (pp. 95-112). Santa Fe: Santa
     Fe Institute.
Arthur, B. W. (2009). The Nature of Technology: What it is and how it evolves. Free Press.
Arthur, W. B., & Polak, W. (2004, May). The evolution of technology within a simple
     computer model. Complexity. doi:10.1002/cplx.20130
Basalla, G. (1989). The Evolution of Technology. Cambridge, UK: Cambridge University Press.
Biswas, A. K., & Davenport, W. G. (1976). Extractive Metallurgy of Copper (1st ed., p. 438).
     Oxford, New York: Pergamon.
Bradshaw, G. (1992). The airplane and the logic of invention. In R. Giere (Ed.), Cognitive
     Models of Science (pp. 239-250). Minneapolis: University of Minnesota Press.
Brundenius, C. (2003). Technological change and the environmental imperative: challenges to the
     copper industry. (C. Brundenius, Ed.) (p. 182). Northampton, MA: Edward Elgar.
Bryk, P., Ryselin, J., Honkasalo, J., & Malmström, R. (1958). Flash Smelting Copper
     Concentrates. Journal of Metals, (June), 395-400.
Camison-Zornoza, C., Lapiedra-Alcami, R., Segarra-Cipres, M., & Boronat-Navarro, M.
     (2004). A meta-analysis of innovation and organizational size. Organization Studies,
     25(3), 331-361.
Damanpour, F. (1991). Organizational innovation: a meta-analysis of effects of determinants
     and moderators. Academy of Management Journal, 34(3), 555-574.
Davenport, W. G., King, M., Schlesinger, M., & Biswas, A. K. (2002). Extractive Metallurgy of
     Copper (4th ed., p. 432). Oxford: Pergamon.
Davis, J. P., Eisenhardt, K. M., & Bingham, C. B. (2007). DEVELOPING THEORY
     THROUGH SIMULATION METHODS. Academy of Management Review, 32(2), 480-499.
Dosi, G. (1982). Technological paradigms and technological trajectories. Research Policy, 11,
     147-162.
Dosi, G. (1984). Technical Change and Industrial Transformation. New York: St. Martin’s Press.
Ethiraj, S. K., & Levinthal, D.A. (2004). Modularity and innovation in complex systems.
     Management Science, 50(2), 159-173.
Finke, R A, Ward, T. B., & Smith, S. M. (1992). Creative Cognition. Cambridge, MA: MIT
     Press.
Finke, R.A. (1990). Creative Imagery: Discoveries and Inventions in Visualization. Hillsdale, NJ:
     Lawrence Erlbaum Associates.
Frenken, K. (2001). Understanding product innovation using complex systems theory. University
     of Amsterdam, Amsterdam.
Frenken, K., Saviotti, P. P., & Trommetter, M. (1999). Variety and niche creation in aircraft,
     helicopters, motorcycles and microcomputers. Research Policy, 28, 469-488.


                                                                                               20  
Frenken, Koen. (2006). Innovation , Evolution and Complexity Theory. Cheltenham and
     Northampton: Edward Elgar.
Garud, R, & Karnoe, P. (2003). Bricolage versus breakthrough: distributed and embedded
     agency in technology entrepreneurship. Research Policy, 32, 277-300.
Gassmann, O., & von Zedtwitz, M. (2003). Trends and determinants of managing virtual
     R&D teams. R&D Management, 33(3), 243-262.
Gibbert, M., & Scranton, P. (2009). Constraints as sources of radical innovation?: Insights
     from jet propulsion development. Management /& Organizational History, 4(4), 01-15.
     doi:10.1177/1744935909341781
Gibbert, M., & Välikangas, L. (2004). Boundaries and Innovation: Special Issue Introduction
     by the Guest Editors. Long Range Planning, 37(6), 495-504.
Gibbert, M., & Välikangas, L. (2004). Boundaries and Innovation: Special Issue Introduction
     by the Guest Editors. Long Range Planning, 37, 495-504. doi:10.1016/j.lrp.2004.09.004
Gibbert, M., Hoegl, M., & Välikangas, L. (2007). In Praise of Resource Constraints. MIT Sloan
     Management Review, 48(3), 14-17.
Giddens, A. (1984). The constitution of society. Cambridge: Polity Press.
Goldenberg, J., Lehmann, D. R., & Mazursky, D. (2001). The idea itself and the circumstances
     of its emergence as predictors of new product success. Management Science, 47(1), 69-84.
Herneryd, O., Sundström, O. A., & Norra, A. (1954). Copper Smelting in Boliden’s Rönnskär
     Works Described. Journal of Metals, (March), 330-337.
Hoegl, M., Gibbert, M., & Mazursky, D. (2008). Financial constraints in innovation projects:
     When is less more? Research Policy, 37, 1382-1391. doi:10.1016/j.respol.2008.04.018
Hoegl, M., Weiss, M., & Gibbert, M. (2010). The influence of material resources on
     innovation project outcomes. 2010 IEEE International Conference on Management of
     Innovation and Technology (ICMIT) (pp. 450-454). Singapore.
Hughes, T. P. (1983). Networks of Power: Electrification in Western Society, 1880-1930. Johns
     Hopkins University Press.
Inco, staff of. (1955). Oxygen Flash Smelting Swings Into Commercial Operation. Journal of
     Metals, (June), 742-750.
Kaplan, S., & Tripsas, M. (2008). Thinking about technology  : Applying a cognitive lens to
     technical change. Research Policy, 37, 790-805. doi:10.1016/j.respol.2008.02.002
Katila, R., & Shane, S. (2005). When does lack of resources make new firms innovative?
     Academy of Management Journal, 48(5), 814-829.
Kauffman, S. A. (1993). The Origins of Order. Self-Organization and Selection in Evolution. New
     York and Oxford: Oxford University Press.
Kojo, I. V., & Storch, H. (2006). Copper production with Outokumpu Flash Smelting: An
     Update. In F. Kongoli & R. G. Reddy (Eds.), Sohn International Symposium: Advanced
     Processing of Metals and Materials Volume 8 - International Symposium on Sulfide Smelting
     (pp. 225-238). The Minerals, Metals & Materials Society.
Kojo, I. V., Jokilaakso, A., & Hanniala, P. (2000). Flash Smelting and Converting Furnaces  : A
     50 Year Retrospect. Journal of Metals, (February), 57-61.
Korhonen, J. M. (n.d.). Resource constraints and the evolution of technology in post-war
     copper industry: a descriptive case study. Helsinki.
Levinthal, Daniel A. (1997). Adaptation on Rugged Landscapes. Management Science, 43(7),
     934-950.
Levinthal, Daniel A, & Warglien, M. (1999). Landscape Design  : Designing for Local Action
     in Complex Worlds. Organization Science, 10(3), 342-357.
Mishina, Y., Pollock, T. G., & Porac, J. F. (2004). Are more resources always better for
     growth? Resource stickiness in market and product expansion. Strategic Management
     Journal, 25, 1179-1197.
Mone, M. A., McKinley, W., & Barker III, V. L. (1998). Organizational decline and
     innovation: a contingency framework. Academy of Management Review, 23(1), 115-132.


                                                                                            21  
Moreau, C. P., & Dahl, D. W. (2005). Designing the solution: the impact of constraints on
     consumers’ creativity. Journal of Consumer Research, 32(1), 13-22.
Nelson, R. R., & Winter, S. G. (1982). An Evolutionary Theory of Economic Change. Cambridge,
     MA: Belknap Press of Harvard University Press.
Newton, J., & Wilson, C. L. (1942). Metallurgy of Copper. New York: Wiley.
Nohria, N., & Gulati, R. (1996). Is slack good or bad for innovation? Academy of Management
     Journal, 39, 1245-1264.
Nonaka, I., & Kenney, M. (1991). Towards a new theory of innovation management: A case
     study comparing Canon, Inc. and Apple Computer, Inc. Journal of Engineering and
     Technology Management, 8, 67-83.
Padget, J., Vidgen, R., Mitchell, J., Marshall, A., & Mellor, R. (2009). Sendero  : an extended ,
     agent-based implementation of Kauffman ’ s NKCS model. Bath.
Peck, D., Bakker, C., & Diederen, A. (2010). Innovation and complex governance at times of
     scarcity of resources – a lesson from history. ERSCP-EMSU Conference on Knowledge
     Collaboration & Learning for Sustainable Innovation (pp. 1-28). Delft.
Popp, D. (2006). International innovation and diffusion of air pollution control technologies:
     the effects of NOX and SO2 regulation in the U.S., Japan, and Germany. Journal of
     Environmental Economics and Management, 51(1), 46-71.
Popp, D., Hafner, T., & Johnstone, N. (2011). Environmental policy vs. public pressure:
     Innovation and diffusion of alternative bleaching technologies in the pulp industry.
     Research Policy. Elsevier B.V. doi:10.1016/j.respol.2011.05.018
Queneau, P. E., & Marcuson, S. W. (1996). Oxygen Pyrometallurgy at Copper Cliff - A Half
     Century of Progress. Journal of Metals, 48(1), 14-21.
Rivkin, J. W. (2000). Imitation of complex strategies. Management Science, 46, 824-844.
Rivkin, J. W., & Siggelkow, N. (2002). Organizational sticking points on NK landscapes.
     Complexity, 7(5), 31-43.
Rosenberg, N. (1976). Perspectives on Technology. Cambridge, UK: Cambridge University
     Press.
Saddington, R., Curlook, W., & Queneau, P. E. (1966). Tonnage Oxygen for Nickel and
     Copper Smelting at Copper Cliff. Journal of Metals, (April), 440-452.
Sahal, D. (1981). Patterns of Technological Innovation. London: Addison-Wesley.
Schoenmakers, W., & Duysters, G. (2010). The technological origins of radical inventions.
     Research Policy, 39(8), 1051-1059. Elsevier B.V. doi:10.1016/j.respol.2010.05.013
Sharfman, M. P., Wolf, G., Chase, R. B., & Tansik, D. A. (1988). Antecedents of
     organizational slack. Academy of Management Review, 13(601-614).
Simon, H. A. (1996). The Sciences of the Artificial (3rd ed.). Cambridge, MA: MIT Press.
Sorenson, O. (2002). Interorganizational complexity and computation. In J. A. C. Baum (Ed.),
     Companion to Organizations (pp. 664-685). Oxford: Blackwell Publishing.
Srinivas, S., & Sutz, J. (2005). Economic Development and Innovation: Problem-solving in
     Scarcity Conditions. DRUID Tenth Anniversary Summer Conference on Dynamics of
     Industry and Innovation.
Starr, J. A., & MacMillan, I. C. (1990). Resource cooptation via social contracting: resource
     acquisition strategies for new ventures. Strategic Management Journal, 11, 79-92.
Särkikoski, T. (1999). A Flash of Knowledge. How an Outokumpu innovation became a culture. (p.
     304). Espoo and Helsinki: Outokumpu and Finnish Society for History of Technology.
Tan, J., & Peng, M. W. (2003). Organizational slack and firm performance during economic
     transitions: Two studies from an emerging economy. Strategic Management Journal, 24,
     1249-1263.
Theil, H. (1972). Statistical Decomposition Analysis. Amsterdam: North-Holland.
Valente, M. (2008, November). Pseudo-NK: an Enhanced Model of Complexity.
     doi:10.1111/j.1467-629X.1980.tb00220.x


                                                                                              22  
Van de Ven, A. H., & Garud, Raghu. (1993). Innovation and industry emergence: the case of
     cochlear implants. In R. S. Rosenbloom & R. A. Burgelman (Eds.), Research on
     Technological Innovation, Management, and Policy, vol. 5 (pp. 1-46). Greenwich, CT: JAI
     Press.
Välikangas, L., & Gibbert, M. (2005). Constraint-setting strategies for escaping innovation
     traps. MIT Sloan Management Review, 46(3), 58-66.
Ward, T. B. (1994). Structured imagination: the role of category structure in exemplar
     generation. Cognitive Psychology, 27(1), 1-40.
Weiss, M., Hoegl, M., & Gibbert, M. (2011). Making Virtue of Necessity: The Role of Team
     Climate for Innovation in Resource-Constrained Innovation Projects. Journal of Product
     Innovation Management, 28(s1), 196-207.


                                                                                          23  

Mais conteúdo relacionado

Semelhante a Korhonen and Takada 2012: Modeling the role of non-financial constraints in the development and adoption of new technologies

Wp57 csr in_the_uk_nanotechnology_industry
Wp57 csr in_the_uk_nanotechnology_industryWp57 csr in_the_uk_nanotechnology_industry
Wp57 csr in_the_uk_nanotechnology_industryrehaal
 
Standardization efforts:The relationship between knowledge dimensions, search...
Standardization efforts:The relationship between knowledge dimensions, search...Standardization efforts:The relationship between knowledge dimensions, search...
Standardization efforts:The relationship between knowledge dimensions, search...Ian McCarthy
 
Attitudinal, situational and personal characteristics as predictors of future...
Attitudinal, situational and personal characteristics as predictors of future...Attitudinal, situational and personal characteristics as predictors of future...
Attitudinal, situational and personal characteristics as predictors of future...Antonio Dottore
 
Exploring the Influence of Absorptive Capacity on Innovation: An Empirical St...
Exploring the Influence of Absorptive Capacity on Innovation: An Empirical St...Exploring the Influence of Absorptive Capacity on Innovation: An Empirical St...
Exploring the Influence of Absorptive Capacity on Innovation: An Empirical St...AI Publications
 
A Tool For Enhancing Innovation In Construction Organizations
A Tool For Enhancing Innovation In Construction OrganizationsA Tool For Enhancing Innovation In Construction Organizations
A Tool For Enhancing Innovation In Construction OrganizationsKristen Flores
 
Carroll-2019--Large-ScaleAgileTransformations.pdf
Carroll-2019--Large-ScaleAgileTransformations.pdfCarroll-2019--Large-ScaleAgileTransformations.pdf
Carroll-2019--Large-ScaleAgileTransformations.pdfZehraKoker
 
Trentin, Forza and Perin, 2015
Trentin, Forza and Perin, 2015Trentin, Forza and Perin, 2015
Trentin, Forza and Perin, 2015Alessio Trentin
 
Sustainable Technology
Sustainable Technology Sustainable Technology
Sustainable Technology sarthakgarg91
 
A Structured Systematic Review Of The Emerging And Disruptive Technology Lite...
A Structured Systematic Review Of The Emerging And Disruptive Technology Lite...A Structured Systematic Review Of The Emerging And Disruptive Technology Lite...
A Structured Systematic Review Of The Emerging And Disruptive Technology Lite...Monica Waters
 
Why and how does the regulation of emerging technologies occur
Why and how does the regulation of emerging technologies occurWhy and how does the regulation of emerging technologies occur
Why and how does the regulation of emerging technologies occurAraz Taeihagh
 
King lakhani the-contingent-effect-of-absorptive-capacity-an-open-innovation-...
King lakhani the-contingent-effect-of-absorptive-capacity-an-open-innovation-...King lakhani the-contingent-effect-of-absorptive-capacity-an-open-innovation-...
King lakhani the-contingent-effect-of-absorptive-capacity-an-open-innovation-...Joseph Glowitz, PE, PEng, PMP
 
Term Paper: How Will Firms React to Limits on Bio-Physical Flows - An Explora...
Term Paper: How Will Firms React to Limits on Bio-Physical Flows - An Explora...Term Paper: How Will Firms React to Limits on Bio-Physical Flows - An Explora...
Term Paper: How Will Firms React to Limits on Bio-Physical Flows - An Explora...Antony Upward
 
Innovation in manufacturing as an evolutionary complex system
Innovation in manufacturing as an evolutionary complex systemInnovation in manufacturing as an evolutionary complex system
Innovation in manufacturing as an evolutionary complex systemIan McCarthy
 
Opportunities for learning fromcrises in projectsMarkus .docx
Opportunities for learning fromcrises in projectsMarkus .docxOpportunities for learning fromcrises in projectsMarkus .docx
Opportunities for learning fromcrises in projectsMarkus .docxcherishwinsland
 
Perspectives on Innovation and Technology Transfer
Perspectives on Innovation and Technology TransferPerspectives on Innovation and Technology Transfer
Perspectives on Innovation and Technology TransferMikus Dubickis
 
Ballard_et_al_JITP_Distribution to colleagues_100118
Ballard_et_al_JITP_Distribution to colleagues_100118Ballard_et_al_JITP_Distribution to colleagues_100118
Ballard_et_al_JITP_Distribution to colleagues_100118David Ballard
 
O R I G I N A L P A P E RAn Engineering Dilemma Sustainab.docx
O R I G I N A L P A P E RAn Engineering Dilemma Sustainab.docxO R I G I N A L P A P E RAn Engineering Dilemma Sustainab.docx
O R I G I N A L P A P E RAn Engineering Dilemma Sustainab.docxhopeaustin33688
 

Semelhante a Korhonen and Takada 2012: Modeling the role of non-financial constraints in the development and adoption of new technologies (20)

Wp57 csr in_the_uk_nanotechnology_industry
Wp57 csr in_the_uk_nanotechnology_industryWp57 csr in_the_uk_nanotechnology_industry
Wp57 csr in_the_uk_nanotechnology_industry
 
Standardization efforts:The relationship between knowledge dimensions, search...
Standardization efforts:The relationship between knowledge dimensions, search...Standardization efforts:The relationship between knowledge dimensions, search...
Standardization efforts:The relationship between knowledge dimensions, search...
 
Watson jom evolution of toc
Watson   jom evolution of tocWatson   jom evolution of toc
Watson jom evolution of toc
 
Attitudinal, situational and personal characteristics as predictors of future...
Attitudinal, situational and personal characteristics as predictors of future...Attitudinal, situational and personal characteristics as predictors of future...
Attitudinal, situational and personal characteristics as predictors of future...
 
Exploring the Influence of Absorptive Capacity on Innovation: An Empirical St...
Exploring the Influence of Absorptive Capacity on Innovation: An Empirical St...Exploring the Influence of Absorptive Capacity on Innovation: An Empirical St...
Exploring the Influence of Absorptive Capacity on Innovation: An Empirical St...
 
A Tool For Enhancing Innovation In Construction Organizations
A Tool For Enhancing Innovation In Construction OrganizationsA Tool For Enhancing Innovation In Construction Organizations
A Tool For Enhancing Innovation In Construction Organizations
 
Carroll-2019--Large-ScaleAgileTransformations.pdf
Carroll-2019--Large-ScaleAgileTransformations.pdfCarroll-2019--Large-ScaleAgileTransformations.pdf
Carroll-2019--Large-ScaleAgileTransformations.pdf
 
ECAM-01-2013-0009
ECAM-01-2013-0009ECAM-01-2013-0009
ECAM-01-2013-0009
 
Trentin, Forza and Perin, 2015
Trentin, Forza and Perin, 2015Trentin, Forza and Perin, 2015
Trentin, Forza and Perin, 2015
 
Sustainable Technology
Sustainable Technology Sustainable Technology
Sustainable Technology
 
A Structured Systematic Review Of The Emerging And Disruptive Technology Lite...
A Structured Systematic Review Of The Emerging And Disruptive Technology Lite...A Structured Systematic Review Of The Emerging And Disruptive Technology Lite...
A Structured Systematic Review Of The Emerging And Disruptive Technology Lite...
 
Why and how does the regulation of emerging technologies occur
Why and how does the regulation of emerging technologies occurWhy and how does the regulation of emerging technologies occur
Why and how does the regulation of emerging technologies occur
 
King lakhani the-contingent-effect-of-absorptive-capacity-an-open-innovation-...
King lakhani the-contingent-effect-of-absorptive-capacity-an-open-innovation-...King lakhani the-contingent-effect-of-absorptive-capacity-an-open-innovation-...
King lakhani the-contingent-effect-of-absorptive-capacity-an-open-innovation-...
 
Term Paper: How Will Firms React to Limits on Bio-Physical Flows - An Explora...
Term Paper: How Will Firms React to Limits on Bio-Physical Flows - An Explora...Term Paper: How Will Firms React to Limits on Bio-Physical Flows - An Explora...
Term Paper: How Will Firms React to Limits on Bio-Physical Flows - An Explora...
 
Innovation in manufacturing as an evolutionary complex system
Innovation in manufacturing as an evolutionary complex systemInnovation in manufacturing as an evolutionary complex system
Innovation in manufacturing as an evolutionary complex system
 
Opportunities for learning fromcrises in projectsMarkus .docx
Opportunities for learning fromcrises in projectsMarkus .docxOpportunities for learning fromcrises in projectsMarkus .docx
Opportunities for learning fromcrises in projectsMarkus .docx
 
29789426.pdf
29789426.pdf29789426.pdf
29789426.pdf
 
Perspectives on Innovation and Technology Transfer
Perspectives on Innovation and Technology TransferPerspectives on Innovation and Technology Transfer
Perspectives on Innovation and Technology Transfer
 
Ballard_et_al_JITP_Distribution to colleagues_100118
Ballard_et_al_JITP_Distribution to colleagues_100118Ballard_et_al_JITP_Distribution to colleagues_100118
Ballard_et_al_JITP_Distribution to colleagues_100118
 
O R I G I N A L P A P E RAn Engineering Dilemma Sustainab.docx
O R I G I N A L P A P E RAn Engineering Dilemma Sustainab.docxO R I G I N A L P A P E RAn Engineering Dilemma Sustainab.docx
O R I G I N A L P A P E RAn Engineering Dilemma Sustainab.docx
 

Mais de J. M. Korhonen

ADDER: A new model for simulating the evolution of technology
ADDER: A new model for simulating the evolution of technologyADDER: A new model for simulating the evolution of technology
ADDER: A new model for simulating the evolution of technologyJ. M. Korhonen
 
Is shock treatment good for you?
Is shock treatment good for you?Is shock treatment good for you?
Is shock treatment good for you?J. M. Korhonen
 
Ympäristöystävällinen tuotekehitys, Dipoli
Ympäristöystävällinen tuotekehitys, DipoliYmpäristöystävällinen tuotekehitys, Dipoli
Ympäristöystävällinen tuotekehitys, DipoliJ. M. Korhonen
 
Explaining the evolution of technologies, firms, and industries: how complexi...
Explaining the evolution of technologies, firms, and industries: how complexi...Explaining the evolution of technologies, firms, and industries: how complexi...
Explaining the evolution of technologies, firms, and industries: how complexi...J. M. Korhonen
 
Corporate Social Responsibility - ecodesigners' viewpoint
Corporate Social Responsibility - ecodesigners' viewpointCorporate Social Responsibility - ecodesigners' viewpoint
Corporate Social Responsibility - ecodesigners' viewpointJ. M. Korhonen
 
Corporate Social Responsibility - Eco-designers viewpoint and what we should do
Corporate Social Responsibility - Eco-designers viewpoint and what we should doCorporate Social Responsibility - Eco-designers viewpoint and what we should do
Corporate Social Responsibility - Eco-designers viewpoint and what we should doJ. M. Korhonen
 
Vastuullinen tuotekehitys: luentokalvot Lahden Muotoiluinstituutissa 27.9.2010
Vastuullinen tuotekehitys: luentokalvot Lahden Muotoiluinstituutissa 27.9.2010Vastuullinen tuotekehitys: luentokalvot Lahden Muotoiluinstituutissa 27.9.2010
Vastuullinen tuotekehitys: luentokalvot Lahden Muotoiluinstituutissa 27.9.2010J. M. Korhonen
 
Corporate Social Responsibility: Ecodesigners Viewpoint Presentation
Corporate Social Responsibility: Ecodesigners Viewpoint PresentationCorporate Social Responsibility: Ecodesigners Viewpoint Presentation
Corporate Social Responsibility: Ecodesigners Viewpoint PresentationJ. M. Korhonen
 
Vastuullinen tuotesuunnittelu: Lahden Muotoiluinstituutti, päivä 2, 29.1.2010
Vastuullinen tuotesuunnittelu: Lahden Muotoiluinstituutti, päivä 2, 29.1.2010Vastuullinen tuotesuunnittelu: Lahden Muotoiluinstituutti, päivä 2, 29.1.2010
Vastuullinen tuotesuunnittelu: Lahden Muotoiluinstituutti, päivä 2, 29.1.2010J. M. Korhonen
 
Vastuullinen tuotesuunnittelu: Lahden Muotoiluinstituutti, päivä 1, 22.1.2010
Vastuullinen tuotesuunnittelu: Lahden Muotoiluinstituutti, päivä 1, 22.1.2010Vastuullinen tuotesuunnittelu: Lahden Muotoiluinstituutti, päivä 1, 22.1.2010
Vastuullinen tuotesuunnittelu: Lahden Muotoiluinstituutti, päivä 1, 22.1.2010J. M. Korhonen
 
Taito-kestävä käsityömuotoilu: Seoksen esitys
Taito-kestävä käsityömuotoilu: Seoksen esitysTaito-kestävä käsityömuotoilu: Seoksen esitys
Taito-kestävä käsityömuotoilu: Seoksen esitysJ. M. Korhonen
 
CSR-Driven Innovation: Seoksen esitys
CSR-Driven Innovation: Seoksen esitysCSR-Driven Innovation: Seoksen esitys
CSR-Driven Innovation: Seoksen esitysJ. M. Korhonen
 
Lecture Notes for Eco-design principles lecture
Lecture Notes for Eco-design principles lectureLecture Notes for Eco-design principles lecture
Lecture Notes for Eco-design principles lectureJ. M. Korhonen
 
A practical decision framework for sourcing product development services
A practical decision framework for sourcing product development servicesA practical decision framework for sourcing product development services
A practical decision framework for sourcing product development servicesJ. M. Korhonen
 
Nordic CSR Conference presentation
Nordic CSR Conference presentationNordic CSR Conference presentation
Nordic CSR Conference presentationJ. M. Korhonen
 
Design thinking unpacked: an evolutionary algorithm?
Design thinking unpacked: an evolutionary algorithm?Design thinking unpacked: an evolutionary algorithm?
Design thinking unpacked: an evolutionary algorithm?J. M. Korhonen
 
How Design Thinking works, or: Design Thinking Unpacked: an evolutionary algo...
How Design Thinking works, or: Design Thinking Unpacked: an evolutionary algo...How Design Thinking works, or: Design Thinking Unpacked: an evolutionary algo...
How Design Thinking works, or: Design Thinking Unpacked: an evolutionary algo...J. M. Korhonen
 
7.3.09 YAMK-koulutus by Seos Design
7.3.09 YAMK-koulutus by Seos Design7.3.09 YAMK-koulutus by Seos Design
7.3.09 YAMK-koulutus by Seos DesignJ. M. Korhonen
 
Seos-luento Teollinen muotoilu tuotekehityksessä-kurssilla
Seos-luento Teollinen muotoilu tuotekehityksessä-kurssillaSeos-luento Teollinen muotoilu tuotekehityksessä-kurssilla
Seos-luento Teollinen muotoilu tuotekehityksessä-kurssillaJ. M. Korhonen
 
Luovikko seminar in Turku, 23.10.2008
Luovikko seminar in Turku, 23.10.2008Luovikko seminar in Turku, 23.10.2008
Luovikko seminar in Turku, 23.10.2008J. M. Korhonen
 

Mais de J. M. Korhonen (20)

ADDER: A new model for simulating the evolution of technology
ADDER: A new model for simulating the evolution of technologyADDER: A new model for simulating the evolution of technology
ADDER: A new model for simulating the evolution of technology
 
Is shock treatment good for you?
Is shock treatment good for you?Is shock treatment good for you?
Is shock treatment good for you?
 
Ympäristöystävällinen tuotekehitys, Dipoli
Ympäristöystävällinen tuotekehitys, DipoliYmpäristöystävällinen tuotekehitys, Dipoli
Ympäristöystävällinen tuotekehitys, Dipoli
 
Explaining the evolution of technologies, firms, and industries: how complexi...
Explaining the evolution of technologies, firms, and industries: how complexi...Explaining the evolution of technologies, firms, and industries: how complexi...
Explaining the evolution of technologies, firms, and industries: how complexi...
 
Corporate Social Responsibility - ecodesigners' viewpoint
Corporate Social Responsibility - ecodesigners' viewpointCorporate Social Responsibility - ecodesigners' viewpoint
Corporate Social Responsibility - ecodesigners' viewpoint
 
Corporate Social Responsibility - Eco-designers viewpoint and what we should do
Corporate Social Responsibility - Eco-designers viewpoint and what we should doCorporate Social Responsibility - Eco-designers viewpoint and what we should do
Corporate Social Responsibility - Eco-designers viewpoint and what we should do
 
Vastuullinen tuotekehitys: luentokalvot Lahden Muotoiluinstituutissa 27.9.2010
Vastuullinen tuotekehitys: luentokalvot Lahden Muotoiluinstituutissa 27.9.2010Vastuullinen tuotekehitys: luentokalvot Lahden Muotoiluinstituutissa 27.9.2010
Vastuullinen tuotekehitys: luentokalvot Lahden Muotoiluinstituutissa 27.9.2010
 
Corporate Social Responsibility: Ecodesigners Viewpoint Presentation
Corporate Social Responsibility: Ecodesigners Viewpoint PresentationCorporate Social Responsibility: Ecodesigners Viewpoint Presentation
Corporate Social Responsibility: Ecodesigners Viewpoint Presentation
 
Vastuullinen tuotesuunnittelu: Lahden Muotoiluinstituutti, päivä 2, 29.1.2010
Vastuullinen tuotesuunnittelu: Lahden Muotoiluinstituutti, päivä 2, 29.1.2010Vastuullinen tuotesuunnittelu: Lahden Muotoiluinstituutti, päivä 2, 29.1.2010
Vastuullinen tuotesuunnittelu: Lahden Muotoiluinstituutti, päivä 2, 29.1.2010
 
Vastuullinen tuotesuunnittelu: Lahden Muotoiluinstituutti, päivä 1, 22.1.2010
Vastuullinen tuotesuunnittelu: Lahden Muotoiluinstituutti, päivä 1, 22.1.2010Vastuullinen tuotesuunnittelu: Lahden Muotoiluinstituutti, päivä 1, 22.1.2010
Vastuullinen tuotesuunnittelu: Lahden Muotoiluinstituutti, päivä 1, 22.1.2010
 
Taito-kestävä käsityömuotoilu: Seoksen esitys
Taito-kestävä käsityömuotoilu: Seoksen esitysTaito-kestävä käsityömuotoilu: Seoksen esitys
Taito-kestävä käsityömuotoilu: Seoksen esitys
 
CSR-Driven Innovation: Seoksen esitys
CSR-Driven Innovation: Seoksen esitysCSR-Driven Innovation: Seoksen esitys
CSR-Driven Innovation: Seoksen esitys
 
Lecture Notes for Eco-design principles lecture
Lecture Notes for Eco-design principles lectureLecture Notes for Eco-design principles lecture
Lecture Notes for Eco-design principles lecture
 
A practical decision framework for sourcing product development services
A practical decision framework for sourcing product development servicesA practical decision framework for sourcing product development services
A practical decision framework for sourcing product development services
 
Nordic CSR Conference presentation
Nordic CSR Conference presentationNordic CSR Conference presentation
Nordic CSR Conference presentation
 
Design thinking unpacked: an evolutionary algorithm?
Design thinking unpacked: an evolutionary algorithm?Design thinking unpacked: an evolutionary algorithm?
Design thinking unpacked: an evolutionary algorithm?
 
How Design Thinking works, or: Design Thinking Unpacked: an evolutionary algo...
How Design Thinking works, or: Design Thinking Unpacked: an evolutionary algo...How Design Thinking works, or: Design Thinking Unpacked: an evolutionary algo...
How Design Thinking works, or: Design Thinking Unpacked: an evolutionary algo...
 
7.3.09 YAMK-koulutus by Seos Design
7.3.09 YAMK-koulutus by Seos Design7.3.09 YAMK-koulutus by Seos Design
7.3.09 YAMK-koulutus by Seos Design
 
Seos-luento Teollinen muotoilu tuotekehityksessä-kurssilla
Seos-luento Teollinen muotoilu tuotekehityksessä-kurssillaSeos-luento Teollinen muotoilu tuotekehityksessä-kurssilla
Seos-luento Teollinen muotoilu tuotekehityksessä-kurssilla
 
Luovikko seminar in Turku, 23.10.2008
Luovikko seminar in Turku, 23.10.2008Luovikko seminar in Turku, 23.10.2008
Luovikko seminar in Turku, 23.10.2008
 

Último

My Hashitalk Indonesia April 2024 Presentation
My Hashitalk Indonesia April 2024 PresentationMy Hashitalk Indonesia April 2024 Presentation
My Hashitalk Indonesia April 2024 PresentationRidwan Fadjar
 
Enhancing Worker Digital Experience: A Hands-on Workshop for Partners
Enhancing Worker Digital Experience: A Hands-on Workshop for PartnersEnhancing Worker Digital Experience: A Hands-on Workshop for Partners
Enhancing Worker Digital Experience: A Hands-on Workshop for PartnersThousandEyes
 
🐬 The future of MySQL is Postgres 🐘
🐬  The future of MySQL is Postgres   🐘🐬  The future of MySQL is Postgres   🐘
🐬 The future of MySQL is Postgres 🐘RTylerCroy
 
Strategies for Unlocking Knowledge Management in Microsoft 365 in the Copilot...
Strategies for Unlocking Knowledge Management in Microsoft 365 in the Copilot...Strategies for Unlocking Knowledge Management in Microsoft 365 in the Copilot...
Strategies for Unlocking Knowledge Management in Microsoft 365 in the Copilot...Drew Madelung
 
Handwritten Text Recognition for manuscripts and early printed texts
Handwritten Text Recognition for manuscripts and early printed textsHandwritten Text Recognition for manuscripts and early printed texts
Handwritten Text Recognition for manuscripts and early printed textsMaria Levchenko
 
Breaking the Kubernetes Kill Chain: Host Path Mount
Breaking the Kubernetes Kill Chain: Host Path MountBreaking the Kubernetes Kill Chain: Host Path Mount
Breaking the Kubernetes Kill Chain: Host Path MountPuma Security, LLC
 
08448380779 Call Girls In Civil Lines Women Seeking Men
08448380779 Call Girls In Civil Lines Women Seeking Men08448380779 Call Girls In Civil Lines Women Seeking Men
08448380779 Call Girls In Civil Lines Women Seeking MenDelhi Call girls
 
Mastering MySQL Database Architecture: Deep Dive into MySQL Shell and MySQL R...
Mastering MySQL Database Architecture: Deep Dive into MySQL Shell and MySQL R...Mastering MySQL Database Architecture: Deep Dive into MySQL Shell and MySQL R...
Mastering MySQL Database Architecture: Deep Dive into MySQL Shell and MySQL R...Miguel Araújo
 
[2024]Digital Global Overview Report 2024 Meltwater.pdf
[2024]Digital Global Overview Report 2024 Meltwater.pdf[2024]Digital Global Overview Report 2024 Meltwater.pdf
[2024]Digital Global Overview Report 2024 Meltwater.pdfhans926745
 
Swan(sea) Song – personal research during my six years at Swansea ... and bey...
Swan(sea) Song – personal research during my six years at Swansea ... and bey...Swan(sea) Song – personal research during my six years at Swansea ... and bey...
Swan(sea) Song – personal research during my six years at Swansea ... and bey...Alan Dix
 
CNv6 Instructor Chapter 6 Quality of Service
CNv6 Instructor Chapter 6 Quality of ServiceCNv6 Instructor Chapter 6 Quality of Service
CNv6 Instructor Chapter 6 Quality of Servicegiselly40
 
Neo4j - How KGs are shaping the future of Generative AI at AWS Summit London ...
Neo4j - How KGs are shaping the future of Generative AI at AWS Summit London ...Neo4j - How KGs are shaping the future of Generative AI at AWS Summit London ...
Neo4j - How KGs are shaping the future of Generative AI at AWS Summit London ...Neo4j
 
Histor y of HAM Radio presentation slide
Histor y of HAM Radio presentation slideHistor y of HAM Radio presentation slide
Histor y of HAM Radio presentation slidevu2urc
 
08448380779 Call Girls In Friends Colony Women Seeking Men
08448380779 Call Girls In Friends Colony Women Seeking Men08448380779 Call Girls In Friends Colony Women Seeking Men
08448380779 Call Girls In Friends Colony Women Seeking MenDelhi Call girls
 
04-2024-HHUG-Sales-and-Marketing-Alignment.pptx
04-2024-HHUG-Sales-and-Marketing-Alignment.pptx04-2024-HHUG-Sales-and-Marketing-Alignment.pptx
04-2024-HHUG-Sales-and-Marketing-Alignment.pptxHampshireHUG
 
How to Troubleshoot Apps for the Modern Connected Worker
How to Troubleshoot Apps for the Modern Connected WorkerHow to Troubleshoot Apps for the Modern Connected Worker
How to Troubleshoot Apps for the Modern Connected WorkerThousandEyes
 
WhatsApp 9892124323 ✓Call Girls In Kalyan ( Mumbai ) secure service
WhatsApp 9892124323 ✓Call Girls In Kalyan ( Mumbai ) secure serviceWhatsApp 9892124323 ✓Call Girls In Kalyan ( Mumbai ) secure service
WhatsApp 9892124323 ✓Call Girls In Kalyan ( Mumbai ) secure servicePooja Nehwal
 
Boost PC performance: How more available memory can improve productivity
Boost PC performance: How more available memory can improve productivityBoost PC performance: How more available memory can improve productivity
Boost PC performance: How more available memory can improve productivityPrincipled Technologies
 
Raspberry Pi 5: Challenges and Solutions in Bringing up an OpenGL/Vulkan Driv...
Raspberry Pi 5: Challenges and Solutions in Bringing up an OpenGL/Vulkan Driv...Raspberry Pi 5: Challenges and Solutions in Bringing up an OpenGL/Vulkan Driv...
Raspberry Pi 5: Challenges and Solutions in Bringing up an OpenGL/Vulkan Driv...Igalia
 
Data Cloud, More than a CDP by Matt Robison
Data Cloud, More than a CDP by Matt RobisonData Cloud, More than a CDP by Matt Robison
Data Cloud, More than a CDP by Matt RobisonAnna Loughnan Colquhoun
 

Último (20)

My Hashitalk Indonesia April 2024 Presentation
My Hashitalk Indonesia April 2024 PresentationMy Hashitalk Indonesia April 2024 Presentation
My Hashitalk Indonesia April 2024 Presentation
 
Enhancing Worker Digital Experience: A Hands-on Workshop for Partners
Enhancing Worker Digital Experience: A Hands-on Workshop for PartnersEnhancing Worker Digital Experience: A Hands-on Workshop for Partners
Enhancing Worker Digital Experience: A Hands-on Workshop for Partners
 
🐬 The future of MySQL is Postgres 🐘
🐬  The future of MySQL is Postgres   🐘🐬  The future of MySQL is Postgres   🐘
🐬 The future of MySQL is Postgres 🐘
 
Strategies for Unlocking Knowledge Management in Microsoft 365 in the Copilot...
Strategies for Unlocking Knowledge Management in Microsoft 365 in the Copilot...Strategies for Unlocking Knowledge Management in Microsoft 365 in the Copilot...
Strategies for Unlocking Knowledge Management in Microsoft 365 in the Copilot...
 
Handwritten Text Recognition for manuscripts and early printed texts
Handwritten Text Recognition for manuscripts and early printed textsHandwritten Text Recognition for manuscripts and early printed texts
Handwritten Text Recognition for manuscripts and early printed texts
 
Breaking the Kubernetes Kill Chain: Host Path Mount
Breaking the Kubernetes Kill Chain: Host Path MountBreaking the Kubernetes Kill Chain: Host Path Mount
Breaking the Kubernetes Kill Chain: Host Path Mount
 
08448380779 Call Girls In Civil Lines Women Seeking Men
08448380779 Call Girls In Civil Lines Women Seeking Men08448380779 Call Girls In Civil Lines Women Seeking Men
08448380779 Call Girls In Civil Lines Women Seeking Men
 
Mastering MySQL Database Architecture: Deep Dive into MySQL Shell and MySQL R...
Mastering MySQL Database Architecture: Deep Dive into MySQL Shell and MySQL R...Mastering MySQL Database Architecture: Deep Dive into MySQL Shell and MySQL R...
Mastering MySQL Database Architecture: Deep Dive into MySQL Shell and MySQL R...
 
[2024]Digital Global Overview Report 2024 Meltwater.pdf
[2024]Digital Global Overview Report 2024 Meltwater.pdf[2024]Digital Global Overview Report 2024 Meltwater.pdf
[2024]Digital Global Overview Report 2024 Meltwater.pdf
 
Swan(sea) Song – personal research during my six years at Swansea ... and bey...
Swan(sea) Song – personal research during my six years at Swansea ... and bey...Swan(sea) Song – personal research during my six years at Swansea ... and bey...
Swan(sea) Song – personal research during my six years at Swansea ... and bey...
 
CNv6 Instructor Chapter 6 Quality of Service
CNv6 Instructor Chapter 6 Quality of ServiceCNv6 Instructor Chapter 6 Quality of Service
CNv6 Instructor Chapter 6 Quality of Service
 
Neo4j - How KGs are shaping the future of Generative AI at AWS Summit London ...
Neo4j - How KGs are shaping the future of Generative AI at AWS Summit London ...Neo4j - How KGs are shaping the future of Generative AI at AWS Summit London ...
Neo4j - How KGs are shaping the future of Generative AI at AWS Summit London ...
 
Histor y of HAM Radio presentation slide
Histor y of HAM Radio presentation slideHistor y of HAM Radio presentation slide
Histor y of HAM Radio presentation slide
 
08448380779 Call Girls In Friends Colony Women Seeking Men
08448380779 Call Girls In Friends Colony Women Seeking Men08448380779 Call Girls In Friends Colony Women Seeking Men
08448380779 Call Girls In Friends Colony Women Seeking Men
 
04-2024-HHUG-Sales-and-Marketing-Alignment.pptx
04-2024-HHUG-Sales-and-Marketing-Alignment.pptx04-2024-HHUG-Sales-and-Marketing-Alignment.pptx
04-2024-HHUG-Sales-and-Marketing-Alignment.pptx
 
How to Troubleshoot Apps for the Modern Connected Worker
How to Troubleshoot Apps for the Modern Connected WorkerHow to Troubleshoot Apps for the Modern Connected Worker
How to Troubleshoot Apps for the Modern Connected Worker
 
WhatsApp 9892124323 ✓Call Girls In Kalyan ( Mumbai ) secure service
WhatsApp 9892124323 ✓Call Girls In Kalyan ( Mumbai ) secure serviceWhatsApp 9892124323 ✓Call Girls In Kalyan ( Mumbai ) secure service
WhatsApp 9892124323 ✓Call Girls In Kalyan ( Mumbai ) secure service
 
Boost PC performance: How more available memory can improve productivity
Boost PC performance: How more available memory can improve productivityBoost PC performance: How more available memory can improve productivity
Boost PC performance: How more available memory can improve productivity
 
Raspberry Pi 5: Challenges and Solutions in Bringing up an OpenGL/Vulkan Driv...
Raspberry Pi 5: Challenges and Solutions in Bringing up an OpenGL/Vulkan Driv...Raspberry Pi 5: Challenges and Solutions in Bringing up an OpenGL/Vulkan Driv...
Raspberry Pi 5: Challenges and Solutions in Bringing up an OpenGL/Vulkan Driv...
 
Data Cloud, More than a CDP by Matt Robison
Data Cloud, More than a CDP by Matt RobisonData Cloud, More than a CDP by Matt Robison
Data Cloud, More than a CDP by Matt Robison
 

Korhonen and Takada 2012: Modeling the role of non-financial constraints in the development and adoption of new technologies

  • 1. Modeling the role of non-financial constraints in the development and adoption of new technologies Janne M. Korhonen (primary and corresponding author, responsible for background, theory, analyzing the results of simulations and writing the article) janne.m.korhonen@aalto.fi Mikito Takada (responsible for coding the simulations) mikito.takada@aalto.fi Suggested key words: Technology adoption; Innovation; Constraints; Environmental innovation; Agent-based models; NK models; Copper mining Earlier versions of this paper have been presented at PREBEM 2011 conference in Rotterdam and accepted for presentation at Organization Science Winter Conference 2012 pre- conference event in Colorado Springs. Abstract This paper studies the effects of non-financial constraints (e.g. resource scarcities) on the development and adoption of technologies. We build a simulation model of technology development and adoption under constraints, and compare it to a case study from copper mining industry. Rather than focusing on “jury-rigged” temporary solutions, we are interested in innovations that remain in use even after the constraint has been lifted. The results suggest that unexpected constraints only rarely lead to lasting innovations as such, but they drive firms to adopt previously developed, more efficient technologies and accelerate convergence to a dominant design. The effects are moderated mostly by competitive intensity and the complexity of technologies. The results help to reconcile two opposing viewpoints on the role of constraints and have public policy implications in e.g. the success measures of “green growth” initiatives. Introduction Does necessity give birth to new, improved technologies? A burst of recent research suggests that under certain circumstances, innovations (defined in this paper as the implementation of ideas, procedures and structures that are novel to the organization; e.g. Amabile et al., 1996) can be facilitated by introduction of constraints (Garud and Karnoe, 2003; Gibbert and Scranton, 2009; Gibbert and Välikangas, 2004; Gibbert et al. 2007; Goldenberg et al., 2001; Hoegl et al. 2008, 2010; Moreau and Dahl, 2005; Peck et al. 2010; Popp et al., 2011; Srinivas and Sutz, 2005; Starr and MacMillan, 1990; Välikangas and Gibbert, 2005, Weiss et al., 2011). The conclusions of these studies broadly agree that constraints (discontinuities that force firms to unexpectedly change its accustomed working practices, e.g. tightening regulation, pollution limits, and resource shortages) may facilitate innovation in some but not all conditions. For example, economic historians Rosenberg (1976) and Hughes (1983) have argued that innovations tend to be made in response to “bottlenecks” or technological “reverse salients,” and research on environmental innovation has found that regulatory constraints are the primary driver of innovation (Popp, 2006; Popp et al., 2011). Although meeting tightening regulatory and other challenges will clearly require firms to adopt new technologies, the question whether constraints, as a rule, either   1  
  • 2. benefit or hinder technological development remains open. If we define technological development as a process towards increasingly efficient-for-purpose solutions to a given problem, do constraints lead to less or more efficient solutions? In addition, studies on the role of constraints potentially suffer from a selection bias, as only successful developments tend to survive to be studied. In fact, examples of innovation that have been clearly motivated by constraints but have remained in use afterwards remain relatively scarce. In many cases where an invention seems to have originated from a specific constraint, an argument can be made that (a) its origins may be in development work done prior to constraint, even if the constraint was unexpected (see e.g. Arthur, 2009; Schoenmakers and Duysters, 2010) and (b) its continuous use may have been dependent on subsequent improvements and modifications that would have not been possible under conditions of original constraints. Arguably, some constraints can open previously blocked development paths and lead to overall higher performance. Equally arguably, other constraints may result to paths that lead to lower performance. This paper is positioned to extend the existing research on the role of constraints in innovation (e.g. Hoegl et al., 2008, 2010; Gibbert and Scranton, 2009; Gibbert and Välikangas, 2004; Gibbert et al. 2007; Weiss et al., 2011), on the origins of radical innovations (e.g. Schoenmakers and Duysters, 2010), and on regulation-driven innovation (e.g. Popp, 2006; Popp et al., 2011). The main contribution of this paper is in developing a model for assessing whether constraints – as a rule – tend to have positive or negative influences on the development and adoption of novel technologies. The focus of this paper is on the most interesting cases of constrained innovation: those where the innovation remains in use even after the constraint is removed. A linked contribution is the assessment of the role of constraints in the emergence of new technological paradigms (Dosi, 1982). In addition, the micro-level dynamics of technology development and adoption as a result of constraints are not clear. If constraints spur innovation, the effect of constraints should be to increase the variety of technologies in use, at least temporarily. The evolutionary model of technical change (e.g. Dosi, 1984; Nelson and Winter, 1982; Sahal, 1981) suggests that as old path dependencies are loosened and dominant designs suffer from discontinuities, the resulting “era of ferment” should bring about a period of technological experimentation (e.g. Van de Ven and Garud, 1993; Abernathy, 1978; Basalla, 1989). Research so far has attributed this variety creation either to exogenous stochastic technological advances that “extend” the space of possible solutions (Dosi, 1982; see also Kaplan and Tripsas, 2008) or to differences in cognition guiding actor’s framing and interpretation of the technology (Kaplan and Tripsas, 2008). The role of exogenous “limiting” discontinuities, i.e. constraints, is less studied. On the other hand, the extent of technological experimentation should be moderated by the companies’ need to quickly adopt workable solutions to their pressing problems. Therefore, this paper attempts to model the interaction of these effects and determine which of the two opposing forces - the variety-increasing fermentation or the variety-decreasing competitive pressure – tend to be dominant in a discontinuity caused by the introduction of constraints. The paper is structured as follows: first, we discuss prior research into the nature of constraints and innovation. Second, we introduce a case study from copper manufacturing industry. This study serves as a context and as an example for a simulation model of the effects of constraints on innovation. We then compare the assumptions and the results in the simulation to empirical observations. Finally, a discussion and conclusions is provided.   2  
  • 3. The Nature of Constraints: some prior explorations The role of constraints in innovation has been acknowledged for long in maxims such as “necessity is the mother of innovation,” but research remains surprisingly rare. Constraints are usually lumped together with other exogenous events that alter the environment where firms operate. Explicit research on constraints has divided to two streams of research. The “resource slack” research, focusing mostly on financial constraints, tends to either see constraints as negative, limiting factors that bound individual and organizational performance and limit exploration (e.g. Amabile, 1996; Ancona, 1990; Camison-Zornoza et al. 2004; Damanpour, 1991; Gassman and von Zedtwitz, 2003; Nohria and Gulati, 1996). This research stream makes an argument that innovators’ access to financial resources – resource slack - is a key determinant of its performance. The “breaking the barriers” research stream, on the other hand, sees constraints as “focusing devices” (Bradshaw, 1992; Frenken, 2006) that help individuals and organizations focus their attention and cognitive resources to overcome technological “bottlenecks” (Rosenberg, 1976) or “reverse salients” (Hughes, 1983) that hold up technological progress. According to this view, constraints force otherwise complacent firms to rethink traditional practices and adopt new ways of working (Arthur, 2009; Gibbert and Scranton, 2009; Gibbert and Välikangas, 2004; Hoegl et al., 2008, 2010; Katila and Shane, 2005; Mone et al., 1998; Nonaka and Kenney, 1991; Srinivas and Sutz, 2005; Välikangas and Gibbert, 2005; Weiss et al., 2011). In support of this view, research on environmental innovation has noted that regulatory constraints are the key drivers of innovation in many industries (Popp, 2006; Popp et al., 2011). However, the research findings are far from conclusive: for example, empirical evidence suggests that abundant financial resources can also lead to unhealthy complacency and favor incremental adaptation and exploitation instead of exploration (Mishina et al., 2004; Tan and Peng, 2003). Similarly, the beneficial effect is tempered by e.g. increased complexities introduced by additional design requirements (Arthur, 2009). The diverging views have caused commentators to explain that innovations can happen because of or despite constraints (Gibbert and Scranton, 2009; see also Weiss et al., 2011 and Hoegl et al., 2010). A careful reading of literature suggests that these two, superficially incompatible views can be reconciled. Constraints come in different forms, and while exogenous non-financial constraints may very well cause eras of ferment that spur innovation, financial constraints may make exploitation of these explorations difficult. Much of the rest of this paper will explore the assumption, focusing on the non-financial constraints and competitive dynamics. Historical case study: resource constraints and the development of autogenous copper smelting In the first half of the 1900s, copper smelters used energy from coal, oil, gas or electricity to smelt the ore. To improve the efficiency of the process, experiments in utilizing the latent energy of sulfurous metal ores had been carried out since the 1870s, with first patents being awarded in 1897 (Inco, 1955). In theory, by burning sulfur one might dispense with external energy altogether. Some pilot plants with simple sulfur-burning or “autogenous” furnaces were in fact built in the early 1900s (Newton and Wilson, 1942; Särkikoski, 1999; Inco, 1955) but the technology’s limitations, uncertainties over recouping high fixed costs inherent in industrial-scale trials, and a general lack of concern for energy efficiency prevented the technology from taking root in the industry. Largely for these reasons, technological progress within copper smelters was limited to minor improvements on existing furnaces.   3  
  • 4. Birth of flash smelting When research resumed after the interruption of the Second World War, autogenous smelting was “discovered” again. In Canada, mining giant Inco pursued increased productivity for its huge smelters (Saddington et al., 1966). Building on its pre-war research, it quickly homed on newly available oxygen generators. Inco’s solution was essentially an incremental improvement to its existing “reverberatory” furnaces: instead of fossil fuels, tonnage oxygen was injected to ignite sulfur in pulverized ore concentrate. This almost completely eliminated the need for fossil fuels, increased productivity, and reduced emissions (Queneau and Marcuson, 1996). The resulting “Inco flash furnace” was demonstrated on commercial scale in January 1952 (Queneau and Marcuson, 1996). As one of the largest mining companies in the world, having essentially inexhaustible resources and operating in a country untouched by bombings, Inco faced few to no constraints in R&D. In contrast, a small, state-owned Finnish copper company Outokumpu was in dire straits. Just before the war, Outokumpu had invested heavily in electric furnaces, completing the world’s largest electric copper smelter in 1936. Unfortunately, one of the demands of the 1945 peace treaty stipulated that two large hydropower plants had to be ceded to the Soviet Union. The resulting electricity shortage was an existential threat to Outokumpu (Särkikoski, 1999; Habashi, 1993), The crisis gave precious little time to conduct extensive research; furthermore, Outokumpu’s access to advanced technology was severely curtailed by post-war disruptions and currency limitations. These effectively precluded foreign technology purchases (Särkikoski, 1999; Habashi, 1993; Bryk et al., 1958). Fortunately, familiarity with pre-war research and practice provided them with components necessary for a “novel” innovation. Developed in just about three months in late 1945, Outokumpu flash furnace integrated a pre-existing idea - burning pulverized ore concentrate - with components and know-how from coal power plants and sulfur-extracting roasting furnaces (Särkikoski, 1999). Instead of unavailable, electricity-dependent oxygen generators, Outokumpu’s furnace design used waste heat from outgoing flue gases to preheat incoming air. Sulfurous ore could then be injected to the hot air and ignited. Outokumpu’s flash furnace was demonstrated in commercial scale in February 1947. Ironically, the electricity rationing that had inspired Outokumpu’s development efforts was lifted just three months before the first flash furnace went operational. Spread of flash smelting: emission controls and the 1973 energy crisis The first licensee for Outokumpu was the modernized Ashio smelter in Japan, which contracted for a complete turnkey delivery in 1954. After this initial reference, two major constraints facilitated the spread of Outokumpu’s technology. The first constraint became apparent in the early 1960s, as copper industry was increasingly put to account for its harmful emissions. Starting from Japan, many copper producers concluded that modifying their existing furnaces to comply with tightening emission controls would be uneconomical. Outokumpu’s solution provided easier emission control, and as a bonus, would increase energy efficiency as well. This resulted to sales to nine smelters (see Figure 1). The second major constraint was the 1973 energy crisis. While environmental regulations were tightening as well, this time the key driver was energy efficiency. Combined, these two reasons caused ten additional smelters to adopt Outokumpu furnaces between 1973 and 1990 (Särkikoski, 1999). At the same time, the old mainstays (reverberatory, blast and electric furnaces) became uneconomical for energy and environmental reasons. This led to a consolidation of industry and left Outokumpu’s furnace the dominant design in newer, larger copper smelters.   4  
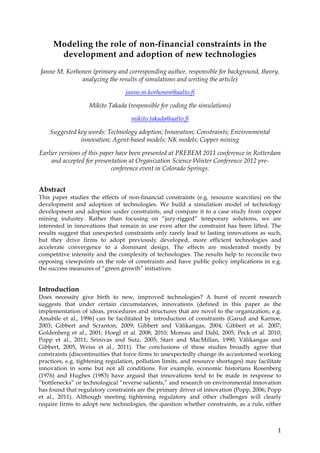
  • 5. Figure 1. Technologies used at major copper smelters, 1930-1990. Data from Biswas and Davenport (1976), Davenport et al. (2002), and U.S. Bureau of Mines Minerals Yearbooks, 1933-1990. (Note: As furnace sizes vary and a smelter may operate more than one furnace, the graph shows smelters using particular furnace technology, rather of the total number of furnaces.) In contrast, Inco was never particularly interested in technology sales. In fact, for the first 25 years Inco did not license its technology to anyone. This was largely due to a potential threat for Inco’s mainstay nickel business, as the furnace type was particularly economical for nickel smelting as well (Brundenius, 2003). Another likely factor was that income from technology sales would have been barely visible on giant Inco’s balance sheet; for example, the contract with Ashio smelter was worth only $156 000, or around $1.3 million in 2011 money (Särkikoski, 1999). It is worth noting, though, that Inco’s method did remain technically superior up until to the 1970s, with lower overall energy consumption and higher productivity (Biswas and Davenport, 1976). However, when Outokumpu introduced oxygen injection in the 1970s, the technological gap nearly disappeared (Figure 2).   5  
  • 6. Figure 2. Efficiency and productivity developments in copper furnaces (Biswas and Davenport, 1976; Bryk et al., 1958; Davenport et al., 2002; Saddington et al., 1966). Why, then, other manufacturers failed to develop flash technologies? Based on the evidence, the most probable reason seems to be that they lacked a compelling reason to do so. In a commodity business where investment costs are high and competition intense, developing or adopting untested processes represents a substantial risk for the operator. As previous research (e.g. Popp, 2006; Popp et al., 2011) has shown, regulatory or other constraints were usually needed to persuade producers to develop or adopt new technologies. It is very likely that Outokumpu itself wouldn’t have taken the gamble without the constraint imposed by the post-war energy shortage. In fact, it is uncertain whether it would have even adopted the technology, had the electricity rationing simply been lifted before the first flash furnace was completed. A comparison can be made to Boliden, in many ways a similar copper company in neighboring Sweden. When Boliden redesigned its Rönnskär smelter in 1948, it simply adopted tried and tested electric furnaces supplied with abundant electricity from Swedish hydropower plants (Herneryd et al., 1954). Modeling constraints with an NK framework Although the case study strongly suggests that constraints can advance technological change, the evidence on the overall effects of constraints is inconclusive. Developing proper case studies is hampered by the lack of reliable accounts describing the birth of constraint- induced innovations. What studies there are tend to focus on “success stories,” raising a question of selection bias. Furthermore, when studying the effects of constraints on the evolution of technology, the theoretical focus is on longitudinal and nonlinear dynamics. These conditions make simulations an attractive methodology (Davis et al., 2007, p. 481) To experiment with history, we have created a simplified model of innovation and disruptions caused by introduction of constraints. The model is based on NK fitness landscapes, originally introduced by Anderson (1983; 1985) and famously adapted by Kauffman (1993) to the study of evolutionary biology. The NK model has been previously used in important work in strategy and organizational literature (Levinthal, 1997; Levinthal and Warglien, 1999; Rivkin, 2000; Rivkin and Siggelkow, 2002). The model has also been   6  
  • 7. previously used to study innovations in a manner very similar to this present work (e.g. Almirall and Casadesus-Masanell, 2010; Ethiraj and Levinthal, 2004; Frenken et al., 1999; Frenken, 2006). Although simulation studies of innovation are becoming more common, we do not know of prior efforts to simulate explicitly the effects constraints have on innovation. Modeling the effects of constraints In order to study the effects of disruptions due to constraints in as simple model as possible, we consider technologies that utilize N components. These components represent the decisions and trade-offs that the designer needs to take account when designing a technology, e.g. different materials, differing energy sources, different subsystems, different requirements, or different ways of organizing a group of people. Although a more general model (e.g. Valente, 2008) would allow for more than two states per component, the common binary (0/1) assumption results to the simplest and most tractable model without undue loss of generality. Therefore, in our model, the simulated organizations have to make decisions concerning N components, with each decision having two options. Each combination of N options is assumed to lead to a different performance of the technology. In other words, there is a mapping between the “design” of a technology and its performance. We consider “performance” to be an abstract value that denotes the “goodness” or “fitness” of the technology, for example, its productivity. As is the convention in the literature utilizing NK models, for reasons of simplicity most parameters can be considered exogenous and fixed for the duration of each simulation run, without detracting from the simulation’s usefulness (see e.g. Sorenson, 2002). Representing technology and its performance in the NK model Formally, a technology is represented in the NK model by a string R of N components (r1, r2, … rN), where each ri represents a choice of {0, 1}. These realized choices contribute to the overall fitness, or performance, W of the technology so that each possible choice configuration Ri has an individual Wi. The complexity of the technology is modeled with a variable K, which determines the “interconnectedness” of the components. Thus, the contribution wi of each resource ri depends on K other components. For each of 2K possible combinations, a value is drawn from a uniform distribution over the unit interval [0, 1]. The overall performance W of each individual technology string is the average over N value contributions, and each individual technology string has a specific performance W. N ∑ w(r ;r ,...,r 1 i1 iK ) i=1 W (r1,...,rN ) = N (1) € In the equation, rij j = (1, … , K) are the combinations of the K components that are interconnected with the component ri. As is the norm in the literature, in absence of specific knowledge, we assume that interdependencies are determined randomly. Search strategies: incremental (local) and radical (long jumps) In short, the model represents a possibility space where individual firms search for the best possible technology among 2N possible resource configurations. In practice, the search proceeds by the firms varying the configuration of one resource at a time. There are various search strategies the firms could possibly use in this landscape, but we assume that firms look at the alternatives that are one step away from their current position, and then select the first alternative that increases the technology’s performance. If the firm cannot alter any   7  
  • 8. configuration without decreasing the performance, the search will stop. This local search is the simplest search heuristic that captures the idea that firms cannot know in advance which combinations of features would eventually provide the best overall performance. Although most literature assumes that firms look at all the alternatives and select the best one (so- called “greedy search;” see e.g. Frenken, 2006), we feel that our assumption captures slightly better the incremental, somewhat unplanned and uncertain nature of technological development and technological path dependency (e.g. Dosi, 1982; in addition, Ward, 1994 proposed a “path of least resistance” model of creativity which leads to the same conclusion). Because this local search stops once there is no more room for improvement, it is prone to get trapped into local maxima when the mapping is complex. This represents the effects of path dependency and the difficulties firms have in “switching the horse” due to financial and psychological reasons. As an example drawn from the case study, several authors (e.g. Särkikoski, 1999; Biswas and Davenport, 1976) have noted that copper smelters have historically been reluctant to radically alter their operations before the need becomes compelling. We have also modeled an alternative to local search, called “long jumps.” These represent radical innovations, and are initiated if a firm finds its technology’s performance to be less than a predetermined percentage of industry average. As usual in the literature, radical innovations are represented by the firm randomly drawing a new string r + R. The length of new string r is varied in different simulations so that 1 ≤ r ≤ R, i.e. r components are changed simultaneously and (R – r) components are retained. This variable length of the new string represents different “search distances,” and can be conceptualized as the breadth of ideas designers can use when trying to design around the constraint. If the new string’s performance is an improvement to old string, it is adopted. Modifications to the basic NK model: competition and constraints We have added two modifications to this general NK framework to model the dynamics of firms competing in the same marketplace and effects of constraints. First, to model the competitive dynamics affecting the development of technologies, we allow better- performing technologies to be imitated. The imitation is initiated similarly to long jumps. If a firm’s technology lags sufficiently behind the industry average in performance, it chooses randomly between long jump and imitation. As is customary in the literature (e.g. Kauffman et al., 2000; Ethiraj and Levinthal, 2004; Almirall and Casadesus-Masanell, 2010), the imitating firm chooses a better-performing technology at random, with the likelihood of a particular technology being chosen being proportional to its performance. In other words, better technologies have a better chance to be copied and thus they spread in the marketplace. It is worth noting that our model is equivalent to a model where firms whose performance is sufficiently poor exit the market and are replaced by new entrants either adopting a “best available” technology or developing new technologies. Second, the effect of constraint is modeled by forcing the firms to set the configuration of one (or more) component to “1” for the variable duration of the constraint. This represents a sudden lack of some critical component, introduced by some exogenous supply shock such as material shortage, war, or changing regulation. As long as the constraint is in force, imitation and long jumps are limited to strings that comply with the constraint. Otherwise, firms are free to long jump and copy any string that fits the criteria outlined above. This simple model corresponds to an absolute resource constraint, where a particular component (i.e. configuration “0”) is no longer available at any price. Although many real- life constraints are not absolute, and instead only increase the price of a component, we believe our abstraction captures the essence of constraint’s impact - that a firm needs to   8  
  • 9. develop an alternative - in a simple yet effective way. In the view of example case presented above, we think this simplification is defensible. Finally, we are especially interested in the performance of novel technologies once the original constraint has been lifted. To this end, the constraints last only a variable number of turns, after which the firms are free to change the constrained component’s configuration. Simulation mechanics For this paper, we have set N = 16. We completed multiple series of simulation sequences with varying parameters for imitation propensity, long jump search length, and complexity K of the technology. Each simulation sequence contains 50 individual simulation runs for each K = 0…15. The performance landscape and starting technologies for 100 individual firms are determined randomly for each run. During runs, firms search the landscape for the technology that offers the highest performance (local maxima), measured by fitness W. The constraint is introduced at turn 15, when all firms have already found their local maxima. The constraint forces all the firms to alter the state of one predetermined component to “1.” In these simulations, the constraint lasted five turns and was lifted at turn 20. All the simulation runs had found a new, stable local maximum by turn 30. Each simulation sequence therefore includes 800 simulation runs, 50 for each K value. Simulation series consist of multiple sequences, where other parameters are altered. The main parameters altered between simulation series are represented in Table 1. We also explored the simulation’s robustness to parameter changes and possible hidden nonlinearities. These robustness checks included testing with variable constraint durations, variable number of organizations (10, 50, 100, 150 and 200), and with more than one component’s configuration constrained. We also tested the simulation’s behavior when the search dynamic was replaced with random mutations. In addition, the simulation’s behavior at close to extreme values of imitation/long jump threshold (1% and 99%) was tested. The simulation’s behavior appears linear and the results are broadly robust to these changes. The exception is that random mutation search produced a slightly different performance bias. This difference will be discussed below. Table 1. Simulation parameters. Simulation series 1. Varying imitation 2. Long jumps threshold allowed Imitation/long jump threshold* 0-100%, 5% increments 75% Long jumps enabled No Yes Long jump search distance - 1-16 Simulations sequences 21 16 * = Imitation/long jump threshold is the percentage of average performance that triggers either imitation of more successful technology or a long jump. If long jumps are enabled, the firm has an equal probability either to imitate or long jump. The simulation was build by extending a freely available Sendero NK model (Padget et al., 2009) in RePast/J environment. Source code and the data can be obtained from the authors.   9  
  • 10. Simulation results As the core interest of this paper is to examine how unexpected constraints affect the evolution of technology, we begin by comparing the effects of constraint on average performance achieved over multiple simulation runs. We then describe how changes in parameters affect the odds of positive or negative change as a result of a constraint. We also study the role of constraints in the emergence of novel technologies. Finally, using entropy statistics, we analyze the effects constraints have on the variety of technologies in use. Due to large number of individual simulation sequences and relative robustness of the results, this paper concentrates on six representative simulations. The simulations and their parameters are described on Table 2 below. Table 2. Summary of parameters of representative simulations. Simulation name Imitation Long Long jump threshold jumps length a) No imitation allowed - No - b) Imitation threshold at 75 % 0.75 No - c) Always imitate 1.00 No - d) Radical innovation, short search 0.75 Yes N/8 (2) e) Radical innovation, medium search 0.75 Yes N/2 (8) f) Radical innovation, distant search 0.75 Yes N (16) The effects of constraints on average performance For all individual simulated firms in each run, we calculated the difference AFT – BEF, where AFT denotes the firm’s technology’s average performance after the constraint (at turn 30) and BEF the average performance before the constraint (at turn 14). This results to a dataset of 5000 observations per K value for each simulation setting. To determine whether constraints generally are beneficial or harmful, we calculated the average and standard error of these observations for each K value. The results for six representative simulation sequences are plotted in Figure 3. The left-hand vertical axis marks the change in average performance AFT – BEF as a percentage of average performance before constraint. The horizontal axis represents the K value. Error bars indicate standard errors of the mean, black dotted lines indicate one standard deviation from the mean, and the red horizontal lines mark the level of zero change. Finally, thick red solid line and right-hand vertical axis measure average performance after constraint. As can be seen, on average, constraints have a very slight but positive effect to the performance of simulated technologies. However, the changes are only rarely statistically significant. In addition, variability – as indicated by the dotted line marking one standard deviation from the mean – is relatively high for all but the simplest technologies (low K values). The interpretation is that constraints have a nearly equal likelihood of either helping or hindering technological progress, but they come with a slight positive bias. The finding is consistent with the dichotomous nature of previous literature on the effects of constraints (e.g. Hoegl et al., 2008; Gibbert et al., 2007; Välikangas and Gibbert, 2005; Weiss et al., 2011). The results are very robust over a wide range of simulation parameters. Changing the search dynamics to random search produces essentially the same result, although the bias then becomes slightly negative and variance increases. The only notable anomaly observable in the results is that both the largest losses and greatest gains in average performance were seen in the simulations where competition was most intense (imitation threshold near or at 100%). Three factors account for this difference: first, more homogenous industries have less   10  
  • 11. variety to start with. When a constraint is imposed, lack of variety means lack of options that could act as platforms for further development. Second, more intense competition does not give time for technologies to fully develop. Even a promising technology path is likely to be abandoned, if it doesn’t provide clear and immediate benefits. As a result, breaking the path dependency and developing truly novel alternatives becomes difficult. Thirdly, however, intense competition also ensures that if the constraint leads to a performance breakthrough, it is speedily adopted throughout the industry. a) No imitation allowed d) Radical innovation, short search 1.0 1.0 4 4 2 2 Change (percent) Change (percent) 0.8 0.8 0 0 -2 -2 -4 -4 0.6 0.6 0 1 2 3 4 5 6 7 8 9 10 11 12 13 14 15 0 1 2 3 4 5 6 7 8 9 10 11 12 13 14 15 K value K value b) Imitation threshold at 75% e) Radical innovation, medium search 1.0 1.0 4 4 2 2 Change (percent) Change (percent) 0.8 0.8 0 0 -2 -2 -4 -4 0.6 0.6 0 1 2 3 4 5 6 7 8 9 10 11 12 13 14 15 0 1 2 3 4 5 6 7 8 9 10 11 12 13 14 15 K value K value c) Always imitate f) Radical innovation, distant search 1.0 1.0 4 4 2 2 Change (percent) Change (percent) 0.8 0.8 0 0 -2 -2 -4 -4 0.6 0.6 0 1 2 3 4 5 6 7 8 9 10 11 12 13 14 15 0 1 2 3 4 5 6 7 8 9 10 11 12 13 14 15 K value K value Figure 3. Mean change (thin line with error bars) and average performance (thick line) after constraint. Error bars indicate standard error, dotted line one standard deviation. Odds of change: how likely are the improvements? To gain more detail about the effects of constraints, we plotted the likelihood a constraint would spur an individual firm to improve its technology. The odds of change were determined by calculating the number of observations exhibiting positive, negative or no change when comparing performance before and after the constraint. The results, cumulatively plotted to two tables, are presented in Figure 4 below.   11  
  • 12. In each plot, the area below lower lines represents the percentage chance of constraint to result to performance decreases. The area above upper lines represents the chance for the constraint to increase performance. The area between two sets of lines represents the chance that constraint has no effect in performance. The dashed horizontal line denotes 50% chance. The plots reveal that the probability for both positive and negative change increases as complexity K increases. Increasing the imitation intensity parameter above 80% (imitation threshold) produces results that differ most from the overall trend. In all cases, the most probable outcome is no performance change. Allowing firms to search farther for radical innovations does not have an appreciable impact on the probabilities. As can be seen from the near-identical plots, the odds are largely determined by imitation threshold (set to 75% in radical innovation simulations). In short, more options may not translate to better odds, and as Figure 3 above shows, there is little to no direct performance benefit either. Figure 4. Odds of change. Left panel with varying imitation thresholds, right with varying radical innovation search lengths. Variance on left panel is exclusively from high imitation threshold (>70%) simulations. The influence of constraints on the emergence of novel technologies In many simulations, the technologies that were ultimately used to “go around” the constraint were not developed as a response to the constraint: often, simulated firms had used them even before the constraint was introduced. To determine the extent to which pre- existing designs were used and the likelihood of novel technologies emerging as a result of constraint breaking the technological path dependency, we compared the technologies in use before the constraint to technologies being used at the end of the simulation. The results of this comparison, along with average performance achieved, are plotted on Figure 5 below. In the plots, black line represents the percentage of pre-existing technologies out of all technologies in use at the end of the simulation (i.e. 100% indicates that all technologies in use at the end were in existence before the constraint). Error bars indicate standard errors of the mean, and dotted black line marks one standard deviation.   12  
  • 13. a) No imitation allowed d) Radical innovation, short search 100 100 80 80 % pre-existing technologies % pre-existing technologies 60 60 40 40 20 20 0 0 0 1 2 3 4 5 6 7 8 9 10 11 12 13 14 15 0 1 2 3 4 5 6 7 8 9 10 11 12 13 14 15 K value K value b) Imitation threshold at 75% e) Radical innovation, medium search 100 100 80 80 % pre-existing technologies % pre-existing technologies 60 60 40 40 20 20 0 0 0 1 2 3 4 5 6 7 8 9 10 11 12 13 14 15 0 1 2 3 4 5 6 7 8 9 10 11 12 13 14 15 K value K value c) Always imitate f) Radical innovation, distant search 100 100 80 80 % pre-existing technologies % pre-existing technologies 60 60 40 40 20 20 0 0 0 1 2 3 4 5 6 7 8 9 10 11 12 13 14 15 0 1 2 3 4 5 6 7 8 9 10 11 12 13 14 15 K value K value Figure 5. Share of pre-existing technologies out of all technologies in use after a constraint. Error bars indicate standard error, dotted line one standard deviation. The results indicate that in general, well over half of the technologies used at the end of the simulation existed before the constraint. In environments where imitation is intense, over 80% of technologies may be pre-existing, although variability tends to be very high: cases where no technologies were in use before constraint are relatively common, as well. As explained previously, the dynamics of intense competition can produce both results, and thus help explain the dichotomous nature of previous explorations. As was the case with performance, allowing radical innovation does not greatly influence the results. It is also worth noting that the results are statistically more robust than the results on average performance. Interestingly, the results are robust to the number of organizations (i.e. initial starting positions). The figures only include technologies that were identical to those existing before the constraint. This further underestimates the importance of pre-existing technologies, as observations of individual simulations suggest that firms may copy an existing “constraint immune” technology at the beginning of the constraint, and then develop it into a novel   13  
  • 14. technology. However, measuring this effect and differentiating between imitation and independent but convergent development was not feasible with the current data set. These findings suggest that constraints are more likely to cause firms to adopt existing technologies than to spur them to develop radically new technologies. The effect of constraints on technological variety A positive change in average technological performance can result from either firms developing new, superior technologies, or from imitating existing (or recently developed) technologies from other firms. The intensity of imitation can be analyzed by calculating the entropy statistics for the technologies in use before and after the introduction of constraint (Frenken, 2001). Entropy statistics applied to frequency distributions of individual “designs” (16-bit strings) can describe the evolution of a technology in terms of the changes in the degree and nature of product variety (Frenken, 2001:138). The entropy of the distribution of designs indicates the extent to which the designs within an “industry” (individual simulation) are characterized by “dominant designs.” Maximum entropy corresponds to the case in which all designs occur at the same frequency, and minimum entropy (zero) to the case in which there is only a single design that is used by all firms in the simulation. We calculate the entropy H of an N-dimensional distribution (Theil, 1972: 116, 155) as follows: where ij…w are individual components and pij…w is the frequency at which a design with components ij…w occurs. The entropy H is measured in bits. The results for representative simulations are displayed in Figure 6 below. The figures plot mean entropy during simulation runs for five component interdependency settings (K = 0, 4, 8, 12 and 15). Hatched area indicates the period during which constraint is applied (turns 15- 20). Standard errors of the mean are too small to be visible. The plots show that no-interdependence technologies (K = 0) reach quickly the global optima, i.e. single optimum configuration, where entropy is zero. As interdependence K between components increases from zero, the variety of feasible designs increases as well. Applying the constraint reduces the variety of feasible designs. In simulations where imitation is allowed, constraints also create an incentive to copy better-performing technologies, further reducing variety. Panel c) in Figure 6 illustrates what happens when competition is extremely intense: only a few designs, at most, survive even before the constraint, and fewer still after. In short, constraints lead to a marked decrease in the technological variety, especially when competition is intense (high imitation trigger value).   14  
  • 15. Figure 6. Mean entropy (average variety of technologies in use) in representative simulations. Hatched rectangles indicate turns when constraint is in force. Robustness and limitations: comparison with the case study The robustness, validity and generalizability of simulation studies should always be assessed carefully. We believe that the basic assumptions (technological development as a myopic process, path dependency, the role of constraints, and competition) made in this study hold relatively well for many real-life contexts. In the following, we first compare the assumptions made in the simulations to observed historical dynamics. We then compare the results of the simulations to observed realities.   15  
  • 16. Comparison of simulation assumptions to historical dynamics The comparison of assumptions made in the simulation model with the dynamics observed in reality shows that the assumptions seem to match reality relatively well. Based on technical literature (Biswas and Davenport, 1976; Davenport et al., 2002; Kojo and Storch, 2006; Kojo et al., 1999; Queneau and Marcuson, 1996; Saddington et al., 1966) and interviews with copper metallurgists, copper furnaces can be conceptualized as a technology with approximately 16 important design dimensions, or components (N), with 2-3 alternatives and roughly 3-5 important interdependencies (K) between components. The dimensions on Table 3 below can define all the copper smelting technologies used between 1930 and 1990. For the most part, technological search in the copper industry was “local” and concentrated on incremental improvements of existing technologies. Investments in existing technologies and high capital costs meant that firms had to have considerable incentive before changing their technologies. The performance of competing solutions was relatively straightforward to measure, for example as tons of processed concentrate per day or as cost of copper produced. Firms whose technologies were not performing did license or copy better technologies. Although the imitation threshold level that corresponds to the historical case is impossible to quantify exactly, we feel that a plausible case can be made for a realistic threshold level being in the 75-95% range for the most of the time period under study. Finally, real-life constraints clearly had uneven effects on technologies used. Table 3. Copper furnace design dimensions. Approximate N ≈ 16, K ≈ 4. Design dimension Primary alternatives Furnace direction Horizontal, vertical Furnace shape Rectangular, round Smelting reaction type Bath reactions, suspension reactions Energy source Fossil fuels, electricity, autogenous Gas blow Not used, burners/tuyeres/lances Blast preheat Not used, used Oxygen injection None, enrichment, significant Ore granularity requirements None, fine ore required Ore moisture requirements None, dry ore required Waste heat recovery Not used, used Sulfur dioxide (SO2) recovery No concern, necessary Offgas SO2 concentration Dilute, concentrated SO2 leaks No concern, should be minimized Dust evolution No concern, should be minimized Cooling Convection, watercooled Time between refurbishments Less than 1 year, up to 2 years, longer   16  
  • 17. Comparison to simulation results The case briefly outlined above can be thought to represent three consecutive resource constraints – post-war energy scarcity, introduction of emission control regime, and the 1973 energy crisis. The dynamics represent one relatively typical outcome observed in simulations where imitation threshold is moderate to high (over 70%). In these simulations, it is common for one or two “superior” technologies to emerge before the constraint. However, most firms lack an incentive to adopt these immediately. Only firms unable to cope with their existing technology, like the Ashio smelter in the case study, adopt it. Constraints can often change the situation. In simulations where a superior technology exists and remains unaffected by the constraint, there is a high likelihood that firms will try to imitate it. In these cases, it is typical for average performance to increase. Furthermore, this new technology may offer new opportunities for further development, which increase the performance even further. The parallels to the case study above are obvious. The validity of the simulation seems to be enhanced by the fact that parallels to all three consecutive real-life constraints and their dynamics can be found from the simulations. For just one example, see Figure 7 below. It details a simulation run where resource constraint resulted to the abandonment of old technologies, and to the emergence of improved technology. The parallel to the Outokumpu case would be even more evident if simulated firms had not been able to “license” technology 2, and had instead turned to technology 1. Figure 7. Example of simulation dynamics: constraint eliminates one technology, damages another, which then improves to become the best-performing technology. Limitations of the study Based on the above comparisons, we feel that our simulation captures the essential dynamics of many process industries (e.g. mining, metals manufacturing and energy generation), where the performance of a technology is relatively straightforward to measure (e.g. processing capacity) and high capital costs hinder technological experimentation. However, the results may not be generalizable to industries where experimentation is easier and/or performance measurements are more ambiguous. In addition, the simulations assume that the “need” must be fulfilled by some technology. It is entirely conceivable that a resource constraint causes a broader realignment and a reconsideration of what is “needed” and how the need can be alternatively satisfied. In those cases, the dynamics might differ.   17  
  • 18. Discussion, conclusions, and implications for future research The motivation driving this research was the paucity of empirical studies on the effects non- financial constraints have on the development of technology and technological change. As e.g. Gibbert and Scranton (2009) and Hoegl et al. (2010) have already proposed, the simulations suggest that constraints themselves are largely a neutral force: they are nearly equally likely to lead to the development and adoption of superior or inferior technologies. They are not very likely to lead to adoption of completely new technologies; in most cases, adopted technologies had existed prior to the constraint. The outcome is surprisingly resistant to changes in parameter values, remaining even if radical innovation is allowed to break the path dependency. These results are in line with research by e.g. Schoenmakers and Duysters (2010), who concluded that radical innovations re-used existing technologies to a large extent. Nevertheless, the study also shows that constraints can lead to development and adoption of superior technologies. The dichotomous nature of previous work on resource slack on the one hand (e.g. Amabile, 1996; Ancona, 1990; Camison-Zornoza et al. 2004; Damanpour, 1991; Gassman and von Zedtwitz, 2003; Nohria and Gulati, 1996) and the “breaking the barriers” on the other (e.g. Arthur, 2009; Gibbert and Scranton, 2009; Gibbert and Välikangas, 2004; Hoegl et al., 2008, 2010; Katila and Shane, 2005; Mone et al., 1998; Nonaka and Kenney, 1991; Srinivas and Sutz, 2005; Välikangas and Gibbert, 2005; Weiss et al., 2011) on the nature of constraints could thus be explained: both views – that constraints impoverish and that they facilitate – seem to be correct and can be justified. However, the case may be that constraints do not tend – as a rule – to produce significant technological breakthroughs, and research based on “success stories” may be somewhat biased. If the simplified dynamics used in these simulations hold even approximately, this paper could explain why there are only a few success stories whose origin can be traced to a constraint. All other things being equal, instead of spurring new technological advances, constraints seem to play a more limited role by forcing companies to adopt new technologies. Previous research (e.g. Popp, 2006; Popp et al., 2011) has concluded that regulatory constraints are the primary driver of innovation. A more nuanced reading might be that constraints are an important driver for adoption of innovations, not so much for developing them. A sudden need that makes existing technologies perform poorly at the task – a constraint – directs the search more towards existing instead of novel solutions. In particular, firms operating in intensely competitive environments may be faced with a need to quickly find a satisfactory technology, by copying or otherwise, or exit the market. The end result for this intense competition may be that variety of technologies used will decrease, better technologies cannot be developed, and industries become more vulnerable to future constraints, as a “monoculture” of dominant designs takes over the industry1. These results are of interest to the evolution of technology research stream. Previous research (e.g. Dosi, 1982; Kaplan and Tripsas, 2008) does not usually distinguish between different kinds of discontinuities. The results presented suggest that the effects of different exogenous discontinuities may not be symmetrical, and further research towards prying open the impact different discontinuities have might be worthwhile.                                                                                                                 1 Although constraints were introduced only once for each simulation, the difference between “before” and “after” states in simulations with high imitation intensity is only that the variety of technologies in use has decreased even further. Should such an “industry” suffer another constraint, it is very likely that its performance would decline even more.   18  
  • 19. Overall, the research adds to the literature on innovation and technology adoption by providing a plausible explanation for the conflicting views on the role of constraints in the evolution of technology, and point towards further, empirical research to validate the patterns detected in the simulations. For example, are technological advances discontinuities that explicitly improve the performance of technologies, or are the dynamics more complex than that? Future research might also try to establish whether a success bias exists in previous research on constrained innovation, and to what extent constraints act as drivers for adoption of previously developed technologies. Further research would also be beneficial to verify the conclusions of this study and to identify factors that influence whether constraint impoverish or facilitate. In addition to theoretical interest, the results presented here have at least two implications for public policy. First, as Popp et al. (2011) point out, innovation and efficiency are not the same things. As this paper illustrates, although constraints such as changes in regulatory regime may very well drive development and adoption of new technologies, there is no guarantee that they will also drive improvements in technology. Policy-makers and interest groups in many countries have claimed that tightening regulation – for example, CO2 emission standards – will drive innovation, and hence increase prosperity while decreasing harmful side effects. While this is a possibility, our findings warn against overreliance on the number of innovations or patents as a measure of efficacy for such schemes. Tightening regulations will probably spur the development and, in particular, adoption of new technologies, but the net impact cannot be quantified simply as a number of patents or with some similar measure. A need for further research on better indicators is obvious. Second, this paper highlights the prevalence of adopting existing technologies as a response to constraints; as argued above, many “constraint-induced innovations” can in reality be adaptations of already existing technologies. The role of constraint would then be to actualize the need for these technologies or provide a stimulus for actually funding them. Once investments are made and the industry has converged on a single dominant design, breaking the path dependence will be difficult. An important implication would be that constraints such as energy and material shortages or regulatory changes will be “come as you are” crises: there will be little opportunity to wait for developing technologies, as individual users will adopt (and be locked into) best available existing technologies – whatever those may be. If true, the likely effects of such shortages could be largely assessed in advance. Or, as science fiction author William Gibson put it succinctly, “the future is already here – it’s just not very evenly distributed.” Acknowledgements This research was supported in part by generous grants from the Foundation for Economic Education and Jenny and Antti Wihuri Foundation. The authors would like to thank professor Liisa Välikangas, professor Jaakko Aspara, Matthias Weiss and Matthew R. Karlsen for their valuable comments and suggestions.   19  
  • 20. References Abernathy, W. J. (1978). The Productivity Dilemma: Roadblock to Innovation in the Automobile Industry. Baltimore: Johns Hopkins University Press. Almirall, E., & Casadesus-Masanell, R. (2010). OPEN VERSUS CLOSED INNOVATION  : Academy of Management Review, 35(1), 27-47. Amabile, T. M. (1996). Creativity in Context. Boulder, Colorado: Westview Press. Amabile, T. M., Conti, R., Coon, H., Lazenby, J., & Herron, M. (1996). Assessing the work environment for creativity. Academy of Management Journal, 39(5), 1154–1184. Ancona, D. G. (1990). Outward bound: strategies for team survival in an organization. Academy of Management Journal, 33(2), 334-365. Anderson, P. W. (1983). Suggested mode for prebiotic evolution: The use of chaos. Proceedings of the National Academy of Sciences of the United States of America, 80, 3386. Anderson, P. W. (1985). Spin glass Hamiltonians: A bridge between biology, statistical mechanics and computer science. In D. Pines (Ed.), Emerging synthesis in science: Proceedings of the Founding Workshops of the Santa Fe Institute (pp. 95-112). Santa Fe: Santa Fe Institute. Arthur, B. W. (2009). The Nature of Technology: What it is and how it evolves. Free Press. Arthur, W. B., & Polak, W. (2004, May). The evolution of technology within a simple computer model. Complexity. doi:10.1002/cplx.20130 Basalla, G. (1989). The Evolution of Technology. Cambridge, UK: Cambridge University Press. Biswas, A. K., & Davenport, W. G. (1976). Extractive Metallurgy of Copper (1st ed., p. 438). Oxford, New York: Pergamon. Bradshaw, G. (1992). The airplane and the logic of invention. In R. Giere (Ed.), Cognitive Models of Science (pp. 239-250). Minneapolis: University of Minnesota Press. Brundenius, C. (2003). Technological change and the environmental imperative: challenges to the copper industry. (C. Brundenius, Ed.) (p. 182). Northampton, MA: Edward Elgar. Bryk, P., Ryselin, J., Honkasalo, J., & Malmström, R. (1958). Flash Smelting Copper Concentrates. Journal of Metals, (June), 395-400. Camison-Zornoza, C., Lapiedra-Alcami, R., Segarra-Cipres, M., & Boronat-Navarro, M. (2004). A meta-analysis of innovation and organizational size. Organization Studies, 25(3), 331-361. Damanpour, F. (1991). Organizational innovation: a meta-analysis of effects of determinants and moderators. Academy of Management Journal, 34(3), 555-574. Davenport, W. G., King, M., Schlesinger, M., & Biswas, A. K. (2002). Extractive Metallurgy of Copper (4th ed., p. 432). Oxford: Pergamon. Davis, J. P., Eisenhardt, K. M., & Bingham, C. B. (2007). DEVELOPING THEORY THROUGH SIMULATION METHODS. Academy of Management Review, 32(2), 480-499. Dosi, G. (1982). Technological paradigms and technological trajectories. Research Policy, 11, 147-162. Dosi, G. (1984). Technical Change and Industrial Transformation. New York: St. Martin’s Press. Ethiraj, S. K., & Levinthal, D.A. (2004). Modularity and innovation in complex systems. Management Science, 50(2), 159-173. Finke, R A, Ward, T. B., & Smith, S. M. (1992). Creative Cognition. Cambridge, MA: MIT Press. Finke, R.A. (1990). Creative Imagery: Discoveries and Inventions in Visualization. Hillsdale, NJ: Lawrence Erlbaum Associates. Frenken, K. (2001). Understanding product innovation using complex systems theory. University of Amsterdam, Amsterdam. Frenken, K., Saviotti, P. P., & Trommetter, M. (1999). Variety and niche creation in aircraft, helicopters, motorcycles and microcomputers. Research Policy, 28, 469-488.   20  
  • 21. Frenken, Koen. (2006). Innovation , Evolution and Complexity Theory. Cheltenham and Northampton: Edward Elgar. Garud, R, & Karnoe, P. (2003). Bricolage versus breakthrough: distributed and embedded agency in technology entrepreneurship. Research Policy, 32, 277-300. Gassmann, O., & von Zedtwitz, M. (2003). Trends and determinants of managing virtual R&D teams. R&D Management, 33(3), 243-262. Gibbert, M., & Scranton, P. (2009). Constraints as sources of radical innovation?: Insights from jet propulsion development. Management /& Organizational History, 4(4), 01-15. doi:10.1177/1744935909341781 Gibbert, M., & Välikangas, L. (2004). Boundaries and Innovation: Special Issue Introduction by the Guest Editors. Long Range Planning, 37(6), 495-504. Gibbert, M., & Välikangas, L. (2004). Boundaries and Innovation: Special Issue Introduction by the Guest Editors. Long Range Planning, 37, 495-504. doi:10.1016/j.lrp.2004.09.004 Gibbert, M., Hoegl, M., & Välikangas, L. (2007). In Praise of Resource Constraints. MIT Sloan Management Review, 48(3), 14-17. Giddens, A. (1984). The constitution of society. Cambridge: Polity Press. Goldenberg, J., Lehmann, D. R., & Mazursky, D. (2001). The idea itself and the circumstances of its emergence as predictors of new product success. Management Science, 47(1), 69-84. Herneryd, O., Sundström, O. A., & Norra, A. (1954). Copper Smelting in Boliden’s Rönnskär Works Described. Journal of Metals, (March), 330-337. Hoegl, M., Gibbert, M., & Mazursky, D. (2008). Financial constraints in innovation projects: When is less more? Research Policy, 37, 1382-1391. doi:10.1016/j.respol.2008.04.018 Hoegl, M., Weiss, M., & Gibbert, M. (2010). The influence of material resources on innovation project outcomes. 2010 IEEE International Conference on Management of Innovation and Technology (ICMIT) (pp. 450-454). Singapore. Hughes, T. P. (1983). Networks of Power: Electrification in Western Society, 1880-1930. Johns Hopkins University Press. Inco, staff of. (1955). Oxygen Flash Smelting Swings Into Commercial Operation. Journal of Metals, (June), 742-750. Kaplan, S., & Tripsas, M. (2008). Thinking about technology  : Applying a cognitive lens to technical change. Research Policy, 37, 790-805. doi:10.1016/j.respol.2008.02.002 Katila, R., & Shane, S. (2005). When does lack of resources make new firms innovative? Academy of Management Journal, 48(5), 814-829. Kauffman, S. A. (1993). The Origins of Order. Self-Organization and Selection in Evolution. New York and Oxford: Oxford University Press. Kojo, I. V., & Storch, H. (2006). Copper production with Outokumpu Flash Smelting: An Update. In F. Kongoli & R. G. Reddy (Eds.), Sohn International Symposium: Advanced Processing of Metals and Materials Volume 8 - International Symposium on Sulfide Smelting (pp. 225-238). The Minerals, Metals & Materials Society. Kojo, I. V., Jokilaakso, A., & Hanniala, P. (2000). Flash Smelting and Converting Furnaces  : A 50 Year Retrospect. Journal of Metals, (February), 57-61. Korhonen, J. M. (n.d.). Resource constraints and the evolution of technology in post-war copper industry: a descriptive case study. Helsinki. Levinthal, Daniel A. (1997). Adaptation on Rugged Landscapes. Management Science, 43(7), 934-950. Levinthal, Daniel A, & Warglien, M. (1999). Landscape Design  : Designing for Local Action in Complex Worlds. Organization Science, 10(3), 342-357. Mishina, Y., Pollock, T. G., & Porac, J. F. (2004). Are more resources always better for growth? Resource stickiness in market and product expansion. Strategic Management Journal, 25, 1179-1197. Mone, M. A., McKinley, W., & Barker III, V. L. (1998). Organizational decline and innovation: a contingency framework. Academy of Management Review, 23(1), 115-132.   21  
  • 22. Moreau, C. P., & Dahl, D. W. (2005). Designing the solution: the impact of constraints on consumers’ creativity. Journal of Consumer Research, 32(1), 13-22. Nelson, R. R., & Winter, S. G. (1982). An Evolutionary Theory of Economic Change. Cambridge, MA: Belknap Press of Harvard University Press. Newton, J., & Wilson, C. L. (1942). Metallurgy of Copper. New York: Wiley. Nohria, N., & Gulati, R. (1996). Is slack good or bad for innovation? Academy of Management Journal, 39, 1245-1264. Nonaka, I., & Kenney, M. (1991). Towards a new theory of innovation management: A case study comparing Canon, Inc. and Apple Computer, Inc. Journal of Engineering and Technology Management, 8, 67-83. Padget, J., Vidgen, R., Mitchell, J., Marshall, A., & Mellor, R. (2009). Sendero  : an extended , agent-based implementation of Kauffman ’ s NKCS model. Bath. Peck, D., Bakker, C., & Diederen, A. (2010). Innovation and complex governance at times of scarcity of resources – a lesson from history. ERSCP-EMSU Conference on Knowledge Collaboration & Learning for Sustainable Innovation (pp. 1-28). Delft. Popp, D. (2006). International innovation and diffusion of air pollution control technologies: the effects of NOX and SO2 regulation in the U.S., Japan, and Germany. Journal of Environmental Economics and Management, 51(1), 46-71. Popp, D., Hafner, T., & Johnstone, N. (2011). Environmental policy vs. public pressure: Innovation and diffusion of alternative bleaching technologies in the pulp industry. Research Policy. Elsevier B.V. doi:10.1016/j.respol.2011.05.018 Queneau, P. E., & Marcuson, S. W. (1996). Oxygen Pyrometallurgy at Copper Cliff - A Half Century of Progress. Journal of Metals, 48(1), 14-21. Rivkin, J. W. (2000). Imitation of complex strategies. Management Science, 46, 824-844. Rivkin, J. W., & Siggelkow, N. (2002). Organizational sticking points on NK landscapes. Complexity, 7(5), 31-43. Rosenberg, N. (1976). Perspectives on Technology. Cambridge, UK: Cambridge University Press. Saddington, R., Curlook, W., & Queneau, P. E. (1966). Tonnage Oxygen for Nickel and Copper Smelting at Copper Cliff. Journal of Metals, (April), 440-452. Sahal, D. (1981). Patterns of Technological Innovation. London: Addison-Wesley. Schoenmakers, W., & Duysters, G. (2010). The technological origins of radical inventions. Research Policy, 39(8), 1051-1059. Elsevier B.V. doi:10.1016/j.respol.2010.05.013 Sharfman, M. P., Wolf, G., Chase, R. B., & Tansik, D. A. (1988). Antecedents of organizational slack. Academy of Management Review, 13(601-614). Simon, H. A. (1996). The Sciences of the Artificial (3rd ed.). Cambridge, MA: MIT Press. Sorenson, O. (2002). Interorganizational complexity and computation. In J. A. C. Baum (Ed.), Companion to Organizations (pp. 664-685). Oxford: Blackwell Publishing. Srinivas, S., & Sutz, J. (2005). Economic Development and Innovation: Problem-solving in Scarcity Conditions. DRUID Tenth Anniversary Summer Conference on Dynamics of Industry and Innovation. Starr, J. A., & MacMillan, I. C. (1990). Resource cooptation via social contracting: resource acquisition strategies for new ventures. Strategic Management Journal, 11, 79-92. Särkikoski, T. (1999). A Flash of Knowledge. How an Outokumpu innovation became a culture. (p. 304). Espoo and Helsinki: Outokumpu and Finnish Society for History of Technology. Tan, J., & Peng, M. W. (2003). Organizational slack and firm performance during economic transitions: Two studies from an emerging economy. Strategic Management Journal, 24, 1249-1263. Theil, H. (1972). Statistical Decomposition Analysis. Amsterdam: North-Holland. Valente, M. (2008, November). Pseudo-NK: an Enhanced Model of Complexity. doi:10.1111/j.1467-629X.1980.tb00220.x   22  
  • 23. Van de Ven, A. H., & Garud, Raghu. (1993). Innovation and industry emergence: the case of cochlear implants. In R. S. Rosenbloom & R. A. Burgelman (Eds.), Research on Technological Innovation, Management, and Policy, vol. 5 (pp. 1-46). Greenwich, CT: JAI Press. Välikangas, L., & Gibbert, M. (2005). Constraint-setting strategies for escaping innovation traps. MIT Sloan Management Review, 46(3), 58-66. Ward, T. B. (1994). Structured imagination: the role of category structure in exemplar generation. Cognitive Psychology, 27(1), 1-40. Weiss, M., Hoegl, M., & Gibbert, M. (2011). Making Virtue of Necessity: The Role of Team Climate for Innovation in Resource-Constrained Innovation Projects. Journal of Product Innovation Management, 28(s1), 196-207.   23