SlideShare uma empresa Scribd logo
1 de 7
Baixar para ler offline
RESEARCH AND PRACTICE


From Politics to Parity: Using a Health Disparities Index to
Guide Legislative Efforts for Health Equity
 Bryant Cameron Webb, BA, Sean L. Simpson, PhD, and Kristen G. Hairston, MD, MPH


The US Congress took its first stand against
                                                               Objectives. We created an index quantifying the longitudinal burden of racial
minority health disparities with the passage of
                                                            health disparities by state and compared this index to variables to guide the
the Minority Health and Health Disparities
                                                            construction of, and validate support for, legislative efforts aimed at eliminating
Research and Education Act in October 2000.                 health disparities.
This measure commissioned the creation of                      Methods. We evaluated 5 focus areas of greatest racial disparities in health
the National Center for Minority Health and                 from 1999 to 2005 and compiled state health disparities index (HDI) scores. We
Health Disparities and mandated health dis-                 compared these scores with variables representing the purported social de-
parities research and reporting.1 The goal was to           terminants of health.
conscientiously move the discourse from identi-                Results. Massachusetts (0.35), Oklahoma (0.35), and Washington (0.39) aver-
fying health disparities to eliminating them.               aged the fewest disparities. Michigan (1.22), Wisconsin (1.32), and Illinois (1.50)
   The years that followed brought progress in              averaged the greatest disparities. The statistical reference point for nationwide
                                                            average racial disparities was 1.00. The longitudinal mixed model procedure
researching causation, positing solutions, and
                                                            yielded statistically significant correlations between HDI scores and Black state
supporting promising models for the elimination
                                                            population percentage as well as with the racial gap in uninsured percentages.
of these disparities. The congressionally man-
                                                            We noted a trend for HDI correlations with median household income ratios.
dated Institutes of Medicine report Unequal                    Conclusions. On the basis of the HDI-established trends in the extent and
Treatment grouped factors of causation into 3               distribution of racial health disparities, and their correlated social determinants
basic areas: health system–level factors, care              of health, policymakers should consider incorporating this tool to advise future
process variables, and patient-level variables.2            efforts in minority health legislation. (Am J Public Health. 2011;101:554–560. doi:
In addition, its authors proffered strategies               10.2105/AJPH.2009.171157)
for achieving health equity with recommen-
dations that included legal, regulatory, and
policy interventions.2                                      When considered in sum, these state and           METHODS
   With increasing research and dialogue, legis-         federal legislative efforts have ushered in a new
lators began considering the next appropriate            age of health disparities discourse. Champions          Six of the most glaring indicators of racial
intervention. Congress has continued to debate           of comprehensive health equity legislation           and ethnic health disparities, as referenced by
solutions to the health care issues facing minority      argue that it is a necessary adjunct to existing     the Department of Health and Human Services,
communities, introducing 6 comprehensive mi-             efforts to eliminate racial and ethnic health        were the foundation for this HDI. These focus
nority health equity bills since 2000. In 2007,          disparities. Skeptics assert that the disparities    areas are: cancer screening and management,
the 110th Congress saw the introduction of an            can be largely addressed through generally           cardiovascular disease (CVD), diabetes, HIV/
unprecedented 16 health disparities–focused              improving access to quality care for all Amer-       AIDS, immunizations, and infant mortality.6
bills.3 Despite the increasing legislative interest in   icans. Most, however, appreciate the utility in      Mortality was selected as the primary outcome
improving minority health, no comprehensive              bringing the discussion into the legislative         for each condition as a proxy for disease severity,
minority health measure has become public law            arena as this issue continues to gain momen-         because of its value as a more precise endpoint
since the Minority Health and Health Disparities         tum.                                                 than morbidity and its compelling significance
Research and Education Act of 2000.                         In this context, we recognized a need to          to legislators. We omitted immunization statistics,
   The proposition of legislative remedies for           create tools to guide legislative efforts for        as immunization is unique among the 6 focus
health disparities has not been unique to                achieving minority health equity. The goals          areas as it is a preventive measure rather than
Congress. Since 1999, a majority of state                of our analysis were 3-fold: (1) to establish an     a distinct cause of mortality.
legislatures have passed minority health legis-          index depicting variations in US racial health          We obtained mortality statistics from the
lation.4 These laws have addressed cultural              disparities; (2) to evaluate the association be-     National Center for Health Statistics Com-
competency, health professional recruitment and          tween this health disparities index (HDI) and        pressed Mortality File from 1999 to 20057 for
retention, and disease burden or risk factor             known social determinants of health; and (3) to      each of the 5 disease processes. We specifically
management. Furthermore, 40 states created               use statistical correlations to help guide mi-       calculated crude mortality rates per 100 000 for
offices of minority health, and 4 states designated       nority health legislative interventions at the       Black and White populations aged 20 to 64
official minority health contacts.5                       state and federal levels.                            years in all 50 states. For each disease process,


554 | Research and Practice | Peer Reviewed | Webb et al.                                         American Journal of Public Health | March 2011, Vol 101, No. 3
RESEARCH AND PRACTICE


we calculated a state disparity value (SDV).          social determinants of health.8 These inclu-         because of missing values. Additionally, 10
For example, we calculated the SDV for CVD            ded income and social status, education and          observations were removed from this latter
in Maryland during 2003 by using the for-             literacy, health services, culture, and social       analysis because of missing values for the gap
mula:                                                 environments.                                        in uninsured percentages. We omitted from the
                                                          To evaluate income and social status, we         analysis states with unreliable mortality data, as
ð1Þ SDVCVD in 2003 ¼                                  calculated income disparities as a ratio of          defined in the Compressed Mortality File as
    ðBlack mortalityfrom CVD in MD during 2003        White-to-Black median household incomes              values fewer than 20 deaths per annum in any
     À White mortalityfrom CVD in MD during 2003 Þ    by using the 2000–2005 Annual Social and             HDI subcategory.14
     =White mortalityfrom CVD in MD during 2003       Economic Supplements of the US Census
                                                      Bureau’s Current Population Survey.9 Next,           RESULTS
                                                      as our variable for education and literacy, we
   This value is representative of the ratio of
                                                      calculated the ratio of Black-to-White high             Thirty-three states had sufficient data for
excess Black mortality to the White mortality
                                                      school dropout rates as reported by the National     the calculation of HDI scores from 1999 to
per 100 000 individuals for a single disease
                                                      Center for Educational Statistics between 2000       2005, with 17 states omitted.1 Among the
process in a specific state. Additionally, we
                                                      and 2005.10 As a proxy for culture and social        states for which scores were compiled, Massa-
calculated a cumulative US disparity value
                                                      environment, we used 2 indicators: geographical      chusetts (0.35), Oklahoma (0.35), Washington
(USDV) for each disease process during a par-
                                                      region, as divided by the US Census Bureau,11        (0.39), Nevada (0.53), and Kentucky (0.57)
ticular year. We calculated the HDI value per
                                                      and the percentage of each state’s population that   had the lowest 7-year average HDI scores, in-
year, per disease process, per state with the
                                                      is Black. These variables were meant to loosely      dicative of the least racial health disparity.
formula:
                                                      model the cultural and social environment in         California (1.17), North Carolina (1.20), Michigan
                                                      each state.                                          (1.22), Wisconsin (1.32), and Illinois (1.50) had
ð2Þ HDICVD in ðyearÞ ¼
                                                          We depicted health services through 3            the highest 7-year average HDI scores, making
      SDVCVD in ðyearÞ =USDVCVD in ðyearÞ
                                                      separate variables. First, differences in access     them the states averaging the most racial health
                                                      to health services were represented by the           disparity between 1999 and 2005 (Table 1).
   We calculated a comprehensive HDICOMP              difference between Black and White unin-                When we used Pearson’s correlation coeffi-
score for each year by using the following            sured rates as reported in Behavior Risk             cients, the HDI was positively correlated to
formula, for example:                                 Factor Surveillance System questionnaire             racial disparities in median household income
                                                      responses. In addition, state Medicaid pro-          (P < .001), state Black population (P < .001),
ð3Þ HDI2003 ¼                                         gram eligibility was selected as a proxy for         and Medicaid eligibility scores (P < .01). We
             ½HDICancer in 2003 1 HDICVD              the size of the state’s safety net for its most      found a negative correlation between HDI
            1 HDIDiabetes 1 HDIHIV                    vulnerable populations. This value was               scores and state health spending (P < .001).
            1 HDIinfant mortility Š=5                 extracted from Public Citizen Health Re-                The longitudinal mixed model analysis in-
                                                      search Group’s analysis of state Medicaid            cluded 5 years of data (2000–2004) for each
   We calculated these HDI scores for the 7           programs, which evaluated each state Med-            state rather than the entire 7-year data set.
years in the analysis for all 50 states as suffi-      icaid program for its coverage of optional           The 1999 and 2005 data were eliminated
cient data allowed.                                   eligibility groups.12 Finally, to capture the in-    from the analysis because of the missing
   A state HDI score of 1.00 represents racial        creased spending that would be associated with       values for median household income and
health disparities equivalent to those existing       health disparities, we evaluated state health        state health spending for those years. In the
among the entire US population. An HDI score          spending, calculated as a percentage of the gross    final analysis, 32 states were included (Ten-
of 0.00 would represent racial health parity,         state product.13                                     nessee was ultimately omitted because of
and states with HDI scores of 0.01 to 0.99                                                                 a lack of a state Medicaid eligibility score),
experience less racial health disparity in mor-       Statistical Analysis                                 and a total of 150 observations. The longi-
tality than the inequalities among the US                We first employed Pearson’s correlation co-        tudinal mixed model analysis yielded a cor-
population at large. Lastly, states with HDI          efficients to assess the association between          relation between HDI scores and both
scores exceeding 1.00 exhibit more racial             state HDI scores and variables representing the      racial disparities in uninsured percentages
health disparity than US averages, indicating         social determinants of health. We completed          (P < .01) and state Black population (P < .01).
larger differences in Black and White mortality       a second, more sophisticated longitudinal            We found a trend toward significance be-
for the selected conditions.                          mixed model analysis to reassess correlations        tween HDI scores and racial disparities in
                                                      in the data from 2000 to 2004. In the mixed          median household income (P = .074). Table
Selection of Variables                                model we used yearly data for disparities in         2 details the outcomes of the statistical
   To test the validity of the HDI as a tool          uninsured percentages, state health spending,        analysis both for Pearson’s correlation co-
to measure health disparities, we first evalu-         and disparities in median household income,          efficients and the longitudinal mixed model
ated its correlation to several of the known          but averaged data for high school dropout rate       analysis.


March 2011, Vol 101, No. 3 | American Journal of Public Health                                      Webb et al. | Peer Reviewed | Research and Practice | 555
RESEARCH AND PRACTICE


                                                                                                                                         Tracking Progress in Reducing
    TABLE 1—Health Disparities Index Scores by Rank, 1999–2005                                                                           Disparities
         Statea          1999        2000        2001        2002        2003        2004        2005        Average        Rankb            According to HDI scores, most states failed
                                                                                                                                         to significantly reduce the extent of health
    Massachusetts         0.27        0.44        0.32        0.33        0.52        0.22        0.31         0.35            1         disparities between 1999 and 2005, an ob-
    Oklahoma              0.46        0.35        0.28        0.36        0.26        0.29        0.44         0.35            2         servation consistent with the findings of the
    Washington            0.63        0.18        0.15        0.36        0.48        0.34        0.61         0.39            3         National Healthcare Disparities Reports issued
    Nevada                0.44        0.38        0.57        0.51        0.51        0.67        0.64         0.53            4         during the study period.15–17 The states with the
    Kentucky              0.65        0.52        0.42        0.69        0.57        0.53        0.59         0.57            5         fewest disparities in 1999 generally maintained
    New York              0.57        0.60        0.60        0.53        0.58        0.60        0.69         0.60            6         their status among the most equitable states by
    Florida               0.68        0.66        0.59        0.66        0.56        0.59        0.55         0.61            7         2005, whereas states with the greatest disparities
    Minnesota             0.85        0.65        0.59        0.29        0.36        0.64        0.91         0.61            8         largely remained among the states with the
    Colorado              0.62        0.82        0.66        0.93        0.78        0.36        0.60         0.68            9         highest HDI scores throughout the duration of
    Connecticut           0.63        0.84        1.02        0.73        0.69        0.58        0.81         0.75          10          the study. The profiles of the states at either end
    Arkansas              0.90        0.89        0.73        0.73        0.73        0.65        0.76         0.77          11          of the rankings were noticeably divergent with
    Mississippi           0.76        0.72        0.81        0.88        0.75        0.69        0.85         0.78          12          regard to the Black population percentage and
    Alabama               0.94        0.76        0.92        0.74        0.83        0.63        0.75         0.79          13          racial disparities in uninsured percentages,
    Georgia               0.86        0.82        0.78        0.78        0.78        0.82        0.78         0.80          14          whereas disparities in median household income
    Indiana               0.96        0.72        0.76        0.91        0.86        0.83        0.81         0.84          15          were not significantly different among states at
    Kansas                0.80        0.87        0.78        1.08        0.69        0.72        1.15         0.87          16          either end of the HDI rankings (Table 3).
    Delaware              1.21        0.86        0.97        0.73        0.92        0.65        0.93         0.90          17              Although few states exhibited any meaningful
    Ohio                  0.82        0.86        0.85        0.95        0.95        1.02        0.94         0.91          18          diminution of health disparities, some displayed
    Tennessee             0.96        1.03        0.93        0.95        0.85        0.85        0.84         0.91          19          steady improvement in their HDI scores over
    Missouri              1.15        0.83        0.95        1.14        0.89        0.88        0.92         0.97          20          the study duration. Maryland, for example,
    Texas                 0.92        0.94        0.98        1.04        1.06        1.00        1.07         1.00          21          began the analysis as the state exhibiting the
    Nebraska              1.12        0.91        0.92        0.88        1.21        1.01        0.98         1.01          22          third-most racial health care disparity in 1999,
    Louisiana             1.07        1.02        1.03        1.11        1.12        1.06        0.96         1.05          23          with an HDI score of 1.25. By 2005, however,
    New Jersey            1.10        1.09        1.12        1.08        1.11        1.04        1.05         1.08          24          this score had steadily decreased to a value of
    South Carolina        1.11        1.13        1.13        1.05        1.18        1.11        0.90         1.09          25          0.93, a value that was below the average for
    Maryland              1.25        1.24        1.23        1.02        1.11        0.96        0.93         1.11          26          racial health care disparity across the nation.
    Pennsylvania          1.33        1.07        1.09        1.03        1.21        1.08        1.02         1.12          27          The greatest improvement was made in the
    Virginia              1.03        1.12        1.20        1.32        0.96        1.20        1.02         1.12          28          interval between 2001 and 2002, as the HDI
    California            1.09        1.16        1.16        1.18        1.18        1.23        1.22         1.17          29          score decreased from 1.23 to 1.02. Of note,
    North Carolina        1.12        1.28        1.25        1.24        1.13        1.25        1.10         1.20          30          Maryland passed a total of 4 state laws ad-
    Michigan              1.24        1.05        1.18        1.29        1.21        1.24        1.35         1.22          31          dressing health disparities in 2002 and 2003.18
    Wisconsin             1.11        1.41        1.03        1.19        1.55        1.65        1.34         1.32          32          We are not, however, attributing Maryland’s
    Illinois              1.47        1.44        1.42        1.52        1.57        1.58        1.51         1.50          33          decreasing HDI value solely to the passage of
    Note. Health disparities index is an index depicting state variations in US racial health disparities. Values < 0.00 represent       that state legislation. Rather, the legislative
    a Black mortality rate that is better than the White mortality rate. Values of 0.00 represent parity in Black–White mortality.       commitment to the reduction of disparities in
    Values > 0.00 but < 1.00 represent state mortality disparities that are below the national average for mortality disparities.        Maryland reflects a statewide emphasis on im-
    Values of 1.00 represent state mortality disparities that equal the national average for mortality disparities. Values > 1.00
    represent state mortality disparities that exceed the national average for mortality disparities.                                    proving the health of minority communities.
    a
      Alaska, Arizona, Hawaii, Idaho, Iowa, Maine, Montana, New Hampshire, New Mexico, North Dakota, Oregon, Rhode Island,               Furthermore, this commitment was statistically
    South Dakota, Utah, Vermont, West Virginia, and Wyoming had insufficient data for the calculation of a health disparities             reflected in the reduction of health care dispar-
    index score.
    b
      State rank with respect to 33 states with sufficient data to be included in the analysis.                                           ities as depicted by the HDI values.

                                                                                                                                         Tracking Health Disparities in Minority
DISCUSSION                                                           created to depict variations in the extent and                      Health Focus Areas
                                                                     distribution of the racial disparities that are                        The HDI offers states the opportunity to
   The HDI has several strengths, including its                      known to persist. The HDI builds upon the                           track disparities in mortality among cancer,
evaluation of health disparities. Rather than                        corpus of health disparities literature to depict                   CVD, diabetes, HIV/AIDS, and infant mortal-
focusing the analysis on well described gaps                         the racial health inequalities for each state                       ity. Figure 1 illustrates the HDI disease-specific
between Black and White health statuses                              within the larger, national context of health                       scores for these 5 focus areas in the 2 states at
according to various indicators, the HDI was                         disparities discourse.                                              polar ends of the HDI rankings. This index


556 | Research and Practice | Peer Reviewed | Webb et al.                                                                    American Journal of Public Health | March 2011, Vol 101, No. 3
RESEARCH AND PRACTICE


                                                                                                                                            Application of the HDI to the
    TABLE 2—Statistical Correlations Between Health Disparities Index Scores                                                                Development of Minority Health
    and Selected Variables                                                                                                                  Legislation
                                                                               Health Disparities Index Scores                                 Through statistical correlations, the HDI
                                                                                                                                            becomes a valuable tool to evaluate health-
                                                           Pearson’s Correlation Coefficients
                                                                                                                                            inequalities in relation to variations in the
                                                              Coefficient              P           Longitudinal Mixed Analysis, P
                                                                                                                                            social determinants of health. As such, corre-
   Geographical region                                            NA                                             .243                       lations found between the HDI and the se-
   State Black population (n = 238)                              0.65               <.001                        .001                       lected variables have implications for both
   Disparities in uninsured percentages (n = 218)                0.1                 .124                        .008                       understanding racial and ethnic health dis-
   Disparities in high-school drop-out rates (n = 224)          –0.09                .203                        .466                       parities and crafting future minority health
   Disparities in median household income (n = 204)              0.78               <.001                        .074                       legislation.
   State health spending (n = 204)                              –0.38               <.001                        .958                          Blacks are 3 times more likely to live in
   State Medicaid eligibility score (n = 238)                    0.18                .006                        .779                       poverty than are Whites, a remarkable fact
                                                                                                                                            when one considers how income signifi-
                                                                                                                                            cantly influences health status, access to
constitutes another mechanism by which states                          management. By allowing states to identify                           health care, and health insurance coverage.19
can track disparities in certain disease pro-                          disease processes that contribute significantly                       The positive correlation between the HDI
cesses to identify state priorities in addressing                      to the health disparities burden in their state,                     and racial disparities in median family
disparities. Importantly, each of these condi-                         specific interventions can be crafted to assist                       income corroborates studies touting the im-
tions can be addressed through better pre-                             in addressing these inequalities in minority
                                                                                                                                            pact of disparities in income on racial health
vention, surveillance, and disease                                     communities.
                                                                                                                                            inequalities. Additionally, we found a correla-
                                                                                                                                            tion between states with the largest Black
                                                                                                                                            populations and those having the most racial
    TABLE 3—Changes Over Study Duration (1999–2005) in Health Disparities                                                                   health disparity. Notably, the income dispar-
    Index (HDI) Scores and Selected Variables Among States With the Lowest and                                                              ities and Black state population variables,
    Highest HDI Scores in 1999                                                                                                              themselves, were positively correlated, sup-
                                                                                                                                            porting claims of their interrelatedness in
        State            HDI Score       HDI Rank        Black Population, %         Health Insurance Gap, %            Income Gap          contributing to poor health outcomes.
                                                         Least disparities                                                                     We employed the longitudinal mixed
   Massachusetts                                                                                                                            model analysis because of the potential for
      1999                 0.27                 1                 5.34                          6.80                       1.76             confounding variables. Not only did it ex-
      2005                 0.31                 1                 6.51                          8.60                       1.81             plicitly model state change in HDI scores
   Nevada                                                                                                                                   over time, but it also simultaneously and
      1999                 0.44                 2                 6.50                          NA                         1.75             explicitly modeled between- and within-state
      2005                 0.64                 7                 8.02                          NA                         1.53             variation. In discerning the relationship of
   Oklahoma                                                                                                                                 variables to the HDI over the duration of the
      1999                 0.46                 3                 6.38                         –0.40                       1.82             study, this analysis afforded flexible model-
      2005                 0.44                 2                 8.11                          9.00                       1.55             ing of covariance structure of the repeated
                                                         Most disparities                                                                   measures, allowing us to determine whether
   Maryland                                                                                                                                 variables such as Black percentage of the
      1999                 1.25                 31              27.72                           5.50                       1.47             population and disparities in income were
      2005                 0.93                 20              29.52                          10.60                       1.5              confounders or independently associated
   Pennsylvania                                                                                                                             with the HDI.
      1999                 1.33                 32                9.60                          4.30                       1.66                Using the longitudinal mixed model analysis,
      2005                 1.02                 25              10.68                          10.80                       1.79             we identified correlations between the HDI
   Illinois                                                                                                                                 and both racial disparities in uninsured per-
      1999                 1.47                 33              14.50                          13.40                       1.67             centages as well as the state Black population.
      2005                 1.51                 33              15.13                          15.40                       1.82             Additionally, we noted a statistically insignifi-
    Notes. NA = not available. Of the 17 states without HDI scores, 16 have Black populations of less than 4%, and represent the            cant trend correlating the HDI and racial
    16 states with the smallest Black populations.                                                                                          disparities in median household income. The
                                                                                                                                            presence of both the correlation for state


March 2011, Vol 101, No. 3 | American Journal of Public Health                                                                       Webb et al. | Peer Reviewed | Research and Practice | 557
RESEARCH AND PRACTICE


                                                                                                                                            We found no correlation between the
                                                                                                                                         HDI and state inclusion of optional eligibility
                                                                                                                                         groups in their Medicaid programs. Greater
                                                                                                                                         access should not be confused with greater
                                                                                                                                         accessibility. For a state’s most vulnerable
                                                                                                                                         populations, increasing access without the
                                                                                                                                         infrastructural support to increase actual ac-
                                                                                                                                         cessibility to quality care will not sufficiently
                                                                                                                                         reduce racial health disparities.
                                                                                                                                            In a review of comprehensive minority
                                                                                                                                         health equity legislation that has been in-
                                                                                                                                         troduced into Congress, several trends in
                                                                                                                                         policy-based interventions recur. Each bill
                                                                                                                                         has called for health disparities research
                                                                                                                                         and improving health care quality, and most
                                                                                                                                         included provisions to increase access to care,
                                                                                                                                         health workforce diversity, and training for
                                                                                                                                         cultural competency. Several bills proposed
                                                                                                                                         grants for community programming, public
                                                                                                                                         health education, and promoting healthy
                                                                                                                                         lifestyles. Each intervention is supported by
                                                                                                                                         extensive health disparities research and
                                                                                                                                         evidence-based recommendations for health
                                                                                                                                         disparities solutions. The challenge, how-
                                                                                                                                         ever, comes in the prioritization of these
                                                                                                                                         interventions and the specification of efforts
                                                                                                                                         that constitute best practices in achieving
    Note: CVD = cardiovascular disease; HDI = health disparities index. Value of 0.00 represents racial/ethnic parity in mortality       health equity.
    rates, while a value of 1.00 represents the average Black–White mortality disparities across the United States.
                                                                                                                                            Advisory tools are needed for identifying
    FIGURE 1—Component disease processes of HDI for a) Massachusetts and b) Illinois. Y-axis                                             specific community program grants that
    values are HDI scores for each disease process or for state disparities as a whole.                                                  legislation should support, as well as the ap-
                                                                                                                                         propriate improvements to create quality, ac-
                                                                                                                                         cessible care. Using the HDI as a guide,
Black population and the trend for disparities                        our analysis, however, we found no statisti-                       minority health legislation should focus
in income support claims that these variables                         cally significant correlation between dropout                       primarily on decreasing the number of
are independently related to health disparities                       rates and the HDI, indicating that this factor                     uninsured, as well as closing the significant
and not merely a function of each other. As                           alone is not related to health disparities across                  income gaps that persist between Blacks
such, we believe that legislation to eliminate                        states.                                                            and Whites. Furthermore, the preponder-
racial health disparities must be accompanied by                         As a primary reason for escalating health                       ance of health disparities in states with
efforts to address the income disparities that                        care costs, chronic diseases, such as those                        larger Black populations indicates that the
impact health.                                                        composing the HDI, account for more than                           states with the greatest disparities are also
   Higher education levels have been linked                           75 cents of every dollar spent on health care                      the states with the largest segment of the
to the utilization of preventive services and                         in the United States.21 Additionally, minority                     population that would benefit from such
longer life. Conversely, the lower rates of                           health disparities cost $229.4 billion in direct                   targeted legislative initiatives. The percent-
educational attainment documented among                               medical care expenses between 2003 and                             age of the population affected in the states
Blacks compared with Whites and Asians are                            2006.11 In our analysis, state health spending                     with the most racial health disparity should
considered a factor in poor health status.20                          was inversely related to racial health disparities                 encourage legislators to seek to improve
With the impact of increased dropout rates                            in mortality. Although increased spending may                      minority health on behalf of these individ-
unlikely to manifest for many years, these                            be associated with less mortality, this is not                     uals, their constituents.
values function as an educational snapshot of                         a sustainable mechanism to combat disparities in                      For state legislators, the HDI would be
the community in comparison with other                                health care in light of our nation’s economic                      an effective tool to identify the need for
states, allowing us to reasonably extrapolate                         climate, and current health care trends in                         disease-specific minority health legislation, as
those values to the community as a whole. In                          spending.                                                          well as a mechanism to track the progress in


558 | Research and Practice | Peer Reviewed | Webb et al.                                                                    American Journal of Public Health | March 2011, Vol 101, No. 3
RESEARCH AND PRACTICE


decreasing mortality. Federally, the reality          national racial health disparities. We chose our             Contributors
that the Black–White mortality gap has not            point of comparison with focus on the unique                 B. C. Webb originated the study, completed the analysis,
                                                                                                                   led the writing, and supervised all aspects of its imple-
improved significantly over the past 4 decades         disparities within each state. Even still, we                mentation. K. G. Hairston assisted with study design
warrants the utilization of the HDI to better         recognize that this could understate particu-                and oversaw study implementation. S. L. Simpson pro-
define this egregious disparity and reliably           larly concerning Black mortality rates in states             vided statistical support. All authors helped to concep-
                                                                                                                   tualize ideas, interpret findings, and review drafts of the
track current and future efforts to close that        with higher mortality among Whites as well.                  article.
gap.22 Although this analysis focused on evalu-           We were unable to calculate HDI scores
ating trends in the social determinants of health,    for 17 states because of unreliable mortality                Acknowledgments
future variables could be increasingly specific to     data. Notably, of the states without HDI scores,             This research was supported financially by the Student
predict the impact that diversifying the physician    16 have Black populations of less than 4%                    National Medical Association/Pfizer David M. Satcher
                                                                                                                   Research Fellowship.
workforce, improving patient lifestyle factors,       and are the states with the smallest Black                      Ronny A. Bell, PhD, Capri G. Foy, PhD, Jaimie Hunter,
and increasing funding for community grants           populations in the nation. To better elucidate               MPH, David L. Mount, PsyD, John H. Stewart IV, MD,
would have on the elimination of health dispar-       health disparities causation and the most                    Ashley C. Augustus, MPH, and Orita McCorkle all
                                                                                                                   contributed to creative, analytical, and structural guid-
ities. With both state and federal legislation,       promising policy solutions, reporting for some               ance and support on this project.
an understanding of the correlation between           primary outcome—be it mortality, incidence, or
social determinants and the HDI can effectively       prevalence—must be sufficient to reliably evaluate            Human Participant Protection
serve as a sound basis for legislative initiatives    the health status of minority populations in                 No human participants were involved.
using pertinent positive and negative correlations    each state.
to identify targets for policy intervention up-           Finally, we realize that the index proves                References
stream of the differences in health status among      useful in assessing correlation between the                  1. Thomson GE, Mitchell F, Williams M. Examining the
racial and ethnic minorities.                         extent of health disparities and the selected                Health Disparities Research Plan of the National Institutes
                                                                                                                   of Health: Unfinished Business. Washington, DC: National
                                                      variables, although it does not assert causation.            Academies Press; 2006.
Limitations                                           Instead, this analysis can serve 2 other major
                                                                                                                   2. Smedley BD, Stith AY, Nelson AR, eds. Unequal
   We used mortality rather than incidence            purposes: (1) to track progress in eliminating               Treatment: Confronting Racial and Ethnic Disparities in
data to construct the HDI. Although                   health disparities in each state and (2) to                  Health Care. Washington, DC: National Academies Press;
                                                                                                                   2002.
mortality was selected as a surrogate for dis-        identify areas of interest among the social
ease severity, many of the interventions to           determinants of health and subsequently guide                3. Key health disparities-focused legislation introduced
                                                                                                                   in the 110th Congress [Kaiser Family Foundation Web
eliminate health disparities would be meant to        future legislation for reducing racial health                site]. 2007. Available at: http://www.kff.org/minority
prevent disease and might be better modeled           disparities.                                                 health/7724.cfm. Accessed October 8, 2009.
by using incidence if sufficient data for these            In conclusion, the HDI serves as a novel and             4. Disparities in health 2010 introduced legislation
measures existed in all states. Additionally,         useful mechanism to guide legislative efforts for            [National Conference of State Legislatures Web site].
a likely time lag exists between variations in the    improving minority health. By tracking the                   2009. Available at: http://www.ncsl.org/default.aspx?
                                                                                                                   tabid=14298. Accessed October 8, 2009.
social determinants of health and resultant           extent and distribution of racial health dispar-
                                                                                                                   5. State profiles: minority health and health equity
changes in mortality. Through this analysis,          ities, identifying correlated social factors, and
                                                                                                                   offices [National Conference of State Legislatures Web
however, we hope to discern how long it would         positing potential initiatives to reduce dispar-             site]. 2009. Available at: http://www.ncsl.org/default.
take for changes in policy to manifest in             ities, the HDI displays its great potential utility          aspx?TabId= 14299. Accessed October 8, 2009.
improvements in HDI scores.                           in such analyses. Policymakers should strongly               6. Eliminating racial and ethnic health disparities
   Another limitation was our use of crude            consider incorporating this tool to evaluate                 [Centers for Disease Control and Prevention Web site].
                                                                                                                   2009. Available at: http://www.cdc.gov/omhd/About/
mortality rates as opposed to age-adjusted            health disparities and strategically plan future             disparities.htm. Accessed October 8, 2009.
rates. As we were comparing 2 populations             legislative initiatives. j
                                                                                                                   7. Data file documentation, compressed mortality file,
with different age structures, it would follow                                                                     1999-2005. Hyattsville, MD: National Center for Health
that age-adjusted rates could be beneficial.                                                                        Statistics; 2009.
                                                      About the Authors
Because Whites have an older age distribution         Bryant Cameron Webb is an MD candidate at Wake               8. Williams DR, Jackson PB. Social sources of racial
than do Blacks, age confounds the relationship        Forest University School of Medicine, Winston-Salem, NC,     disparities in health. Health Aff (Millwood). 2005;24(2):
                                                      and a JD candidate at Loyola University Chicago School of    325–334.
between race and mortality. Future studies
                                                      Law, Chicago, IL. Kristen G. Hairston, MD, MPH, is with
should consider adjusting the mortality rates                                                                      9. US Census Bureau. Current population survey,
                                                      the Section on Endocrinology and Metabolism at Wake
                                                                                                                   2008 detailed data tables. Household income 2007.
accordingly.                                          Forest University School of Medicine. Sean L. Simpson,
                                                                                                                   Available at: https://www.census.gov. Accessed Octo-
   Next, our index compares the mortality for         PhD, is with the Department of Biostatistical Sciences at
                                                                                                                   ber 17, 2008.
                                                      Wake Forest University Health Science’s Division of Public
Blacks in each state against the mortality of         Health Sciences.                                             10. US Department of Education, Institute of Education
Whites within the same state. As such, it does           Correspondence should be sent to Bryant Cameron           Sciences, National Center for Education Statistics. Total
not compare within-state Black mortality to           Webb, 973 E 61st St, Apt 1, Chicago, IL 60637 (e-mail:       dropout rate by state and race 2000–2001 to 2004–
                                                      bwebb@wfubmc.edu). Reprints can be ordered at http://        2005 [statistics from Common Core of Data database].
a national standard for mortality rates, but          www.ajph.org by clicking the ‘‘Reprints/Eprints’’ link.      Available at: http://nces.ed.gov/ccd. Accessed October 1,
rather state racial health disparities against           This article was accepted June 21, 2010.                  2008.


March 2011, Vol 101, No. 3 | American Journal of Public Health                                              Webb et al. | Peer Reviewed | Research and Practice | 559
RESEARCH AND PRACTICE


11. US Census Bureau. Census regions and divisions of
the United States [US Census Bureau Web Site]. 2009.
Available at: http://www.census.gov/geo/www/us_reg
div.pdf. Accessed February 27, 2009.
12. Ramirez de Arellano AB, Wolfe SM, Public Citizen
Health Research Group. Unsettling scores: a ranking of
state Medicaid programs, 2007(Public Citizen Web
site). 2007. Available at: http://www.citizen.org/
publications/release.cfm?ID=7516#_ack. Accessed
October 10, 2009.
13. LaVeist TA, Gaskin DJ, Richard P. The economic
burden of health inequalities in the United States [The
Joint Center for Political and Economic Studies Web site].
2009. Available at: http://www.jointcenter.org/
publications_recent_publications/health/the_economic_
burden_of_health_inequalities_in_the_united_states.
Accessed November 6, 2009.
14. Compressed mortality file 1979-2007 [Centers for
Disease Control and Prevention Web site]. Available at:
http://wonder.cdc.gov/wonder/help/cmf.html. Accessed
December 9, 2010.
15. National Healthcare Disparities Report, 2003. Full
Report [Agency for Healthcare Research and Quality
Web site]. 2003. Available at: http://www.ahrq.gov/
qual/nhdr03/fullreport/index.html. Accessed November
9, 2009.
16. National Healthcare Disparities Report, 2004. Full
Report [Agency for Healthcare Research and Quality
Web site]. 2004. Available at http://www.ahrq.gov/
qual/nhdr04/fullreport/Index.htm. Accessed November
9, 2009.
17. National Healthcare Disparities Report, 2005. Full
Report [Agency for Healthcare Research and Quality
Web site]. 2005. Available at: http://www.ahrq.gov/
qual/nhdr05/fullreport/Index.htm. Accessed November
9, 2009.
18. Nathan-Pulliam S, Hussein CA. Addressing health
care disparities: promising practices in Maryland [Mary-
land Department of Health and Mental Hygeine Web
site]. 2004. Available at: http://www.dhmh.state.md.us/
hd/presentations/APHA.ppt. Accessed November 9,
2009.
19. Income, poverty, and health insurance coverage in
the United States: 2005 [US Census Bureau Web site].
2005. Available at: http://www.census.gov/prod/
2006pubs/p60-231.pdf. Accessed November 9, 2009.
20. Stoops NA. Half-century of learning: historical
Census statistics on educational attainment in the United
States, 1940 to 2000 [US Census Bureau Web site].
2007. Available at: http://www.census.gov/population/
www/socdemo/education/introphct41.html. Accessed
October 10, 2009.
21. Majestic E. Public health’s inconvenient truth: the
need to create partnerships with the business sector
[Centers for Disease Control and Prevention Web site].
2009. Available at: http://www.cdc.gov/pcd/issues/
2009/apr/08_0236.htm. Accessed November 6, 2009.
22. Satcher D, Fryer GE Jr, McCann J, Troutman A,
Woolf SH, Rust G. What if we were equal? A comparison
of the Black-White mortality gap in 1960 and 2000.
Health Aff (Millwood). 2005;24(2):459–464.


560 | Research and Practice | Peer Reviewed | Webb et al.                            American Journal of Public Health | March 2011, Vol 101, No. 3

Mais conteúdo relacionado

Mais procurados

Health Access Report
Health Access ReportHealth Access Report
Health Access ReportJohn Stern
 
Lilly Bloomington Illinois Dec 2009
Lilly Bloomington Illinois Dec 2009Lilly Bloomington Illinois Dec 2009
Lilly Bloomington Illinois Dec 2009Gilbert Gonzales
 
California pays a lot for health care, not so much for keeping people healthy
California pays a lot for health care, not so much for keeping people healthyCalifornia pays a lot for health care, not so much for keeping people healthy
California pays a lot for health care, not so much for keeping people healthyΔρ. Γιώργος K. Κασάπης
 
Na Co Florida Lee County Estero V4
Na Co Florida Lee County Estero V4Na Co Florida Lee County Estero V4
Na Co Florida Lee County Estero V4Gilbert Gonzales
 
Community Health Capstone Paper
Community Health Capstone PaperCommunity Health Capstone Paper
Community Health Capstone PaperKatelyn Duncan
 
Integration policy models in Europe and health inequalities by immigrant stat...
Integration policy models in Europe and health inequalities by immigrant stat...Integration policy models in Europe and health inequalities by immigrant stat...
Integration policy models in Europe and health inequalities by immigrant stat...sophieproject
 
Jerry elsie-weyrauch national-strategy-article-2002
Jerry elsie-weyrauch national-strategy-article-2002Jerry elsie-weyrauch national-strategy-article-2002
Jerry elsie-weyrauch national-strategy-article-2002Franklin Cook
 
Rider - NASMHPD Assmt 2 - Medicaid BH Flexibility for Youth (09-14)
Rider - NASMHPD Assmt 2 - Medicaid BH Flexibility for Youth (09-14)Rider - NASMHPD Assmt 2 - Medicaid BH Flexibility for Youth (09-14)
Rider - NASMHPD Assmt 2 - Medicaid BH Flexibility for Youth (09-14)Frank Rider
 
Inequality and inequity in health
Inequality and inequity in healthInequality and inequity in health
Inequality and inequity in healthprakashpathak21
 
Cap 5. socioeconomic issues in medicine
Cap 5.  socioeconomic issues in medicineCap 5.  socioeconomic issues in medicine
Cap 5. socioeconomic issues in medicinecharly-mau
 
The Link between Income Inequality and Access to Health(care)
The Link between Income Inequality and Access to Health(care)The Link between Income Inequality and Access to Health(care)
The Link between Income Inequality and Access to Health(care)Canadian Cancer Survivor Network
 
The impacts of lifestyle behavior on
The impacts of lifestyle behavior onThe impacts of lifestyle behavior on
The impacts of lifestyle behavior onhiij
 

Mais procurados (19)

Sp
SpSp
Sp
 
Health Access Report
Health Access ReportHealth Access Report
Health Access Report
 
Lilly Bloomington Illinois Dec 2009
Lilly Bloomington Illinois Dec 2009Lilly Bloomington Illinois Dec 2009
Lilly Bloomington Illinois Dec 2009
 
California pays a lot for health care, not so much for keeping people healthy
California pays a lot for health care, not so much for keeping people healthyCalifornia pays a lot for health care, not so much for keeping people healthy
California pays a lot for health care, not so much for keeping people healthy
 
Na Co Florida Lee County Estero V4
Na Co Florida Lee County Estero V4Na Co Florida Lee County Estero V4
Na Co Florida Lee County Estero V4
 
Capstone paper
Capstone paperCapstone paper
Capstone paper
 
Community Health Capstone Paper
Community Health Capstone PaperCommunity Health Capstone Paper
Community Health Capstone Paper
 
World happiness report
World happiness reportWorld happiness report
World happiness report
 
World Happiness Report 2019
World Happiness Report 2019World Happiness Report 2019
World Happiness Report 2019
 
Integration policy models in Europe and health inequalities by immigrant stat...
Integration policy models in Europe and health inequalities by immigrant stat...Integration policy models in Europe and health inequalities by immigrant stat...
Integration policy models in Europe and health inequalities by immigrant stat...
 
Jerry elsie-weyrauch national-strategy-article-2002
Jerry elsie-weyrauch national-strategy-article-2002Jerry elsie-weyrauch national-strategy-article-2002
Jerry elsie-weyrauch national-strategy-article-2002
 
Rider - NASMHPD Assmt 2 - Medicaid BH Flexibility for Youth (09-14)
Rider - NASMHPD Assmt 2 - Medicaid BH Flexibility for Youth (09-14)Rider - NASMHPD Assmt 2 - Medicaid BH Flexibility for Youth (09-14)
Rider - NASMHPD Assmt 2 - Medicaid BH Flexibility for Youth (09-14)
 
medicina
medicinamedicina
medicina
 
Inequality and inequity in health
Inequality and inequity in healthInequality and inequity in health
Inequality and inequity in health
 
Cap 5. socioeconomic issues in medicine
Cap 5.  socioeconomic issues in medicineCap 5.  socioeconomic issues in medicine
Cap 5. socioeconomic issues in medicine
 
The Link between Income Inequality and Access to Health(care)
The Link between Income Inequality and Access to Health(care)The Link between Income Inequality and Access to Health(care)
The Link between Income Inequality and Access to Health(care)
 
1 in 7 say they have trouble with health bills in U.S.
1 in 7 say they have trouble with health bills in U.S.1 in 7 say they have trouble with health bills in U.S.
1 in 7 say they have trouble with health bills in U.S.
 
HIV in USA
HIV in USAHIV in USA
HIV in USA
 
The impacts of lifestyle behavior on
The impacts of lifestyle behavior onThe impacts of lifestyle behavior on
The impacts of lifestyle behavior on
 

Destaque

Selling Subscriptions Online
Selling Subscriptions OnlineSelling Subscriptions Online
Selling Subscriptions Onlineaaric69
 
A frayed connection: joblessness among teens in Chicago
A frayed connection: joblessness among teens in ChicagoA frayed connection: joblessness among teens in Chicago
A frayed connection: joblessness among teens in ChicagoJim Bloyd, DrPH, MPH
 
Policy Development to Tackle Structural Origins of Health Inequities: Thought...
Policy Development to Tackle Structural Origins of Health Inequities: Thought...Policy Development to Tackle Structural Origins of Health Inequities: Thought...
Policy Development to Tackle Structural Origins of Health Inequities: Thought...Jim Bloyd, DrPH, MPH
 
Public Health, Place and Social Media for Organizing to Eliminate Health Ineq...
Public Health, Place and Social Media for Organizing to Eliminate Health Ineq...Public Health, Place and Social Media for Organizing to Eliminate Health Ineq...
Public Health, Place and Social Media for Organizing to Eliminate Health Ineq...Jim Bloyd, DrPH, MPH
 
Adam Maestro's music magazine evaluation presentation
Adam Maestro's music magazine evaluation presentationAdam Maestro's music magazine evaluation presentation
Adam Maestro's music magazine evaluation presentationadamaestro
 
ალ. გრიბოედოვისა და ნინო ჭავჭავაძის სიყვარულის ისტორია
ალ. გრიბოედოვისა და ნინო ჭავჭავაძის სიყვარულის ისტორიაალ. გრიბოედოვისა და ნინო ჭავჭავაძის სიყვარულის ისტორია
ალ. გრიბოედოვისა და ნინო ჭავჭავაძის სიყვარულის ისტორიაguestd12fa98
 
Labor Unions: A public health institution
Labor Unions: A public health institutionLabor Unions: A public health institution
Labor Unions: A public health institutionJim Bloyd, DrPH, MPH
 
Latin american critical ('social') epidemiology new settings for an old dream
Latin american critical ('social') epidemiology new settings for an old dreamLatin american critical ('social') epidemiology new settings for an old dream
Latin american critical ('social') epidemiology new settings for an old dreamJim Bloyd, DrPH, MPH
 
Fog Cloud Caching at Network Edge via Local Hardware Awareness Spaces
Fog Cloud Caching at Network Edge via Local Hardware Awareness SpacesFog Cloud Caching at Network Edge via Local Hardware Awareness Spaces
Fog Cloud Caching at Network Edge via Local Hardware Awareness SpacesTokyo University of Science
 
Power, Policy, and Structural Determinants of Health Inequities--Condensed Ex...
Power, Policy, and Structural Determinants of Health Inequities--Condensed Ex...Power, Policy, and Structural Determinants of Health Inequities--Condensed Ex...
Power, Policy, and Structural Determinants of Health Inequities--Condensed Ex...Jim Bloyd, DrPH, MPH
 
Bulk-n-Pick Method for One-to-Many Data Transfer in Dense Wireless Spaces
Bulk-n-Pick Method for One-to-Many Data Transfer in Dense Wireless SpacesBulk-n-Pick Method for One-to-Many Data Transfer in Dense Wireless Spaces
Bulk-n-Pick Method for One-to-Many Data Transfer in Dense Wireless SpacesTokyo University of Science
 
Racism, police violence and public health by Jasmine D. Graves, MPH Presentat...
Racism, police violence and public health by Jasmine D. Graves, MPH Presentat...Racism, police violence and public health by Jasmine D. Graves, MPH Presentat...
Racism, police violence and public health by Jasmine D. Graves, MPH Presentat...Jim Bloyd, DrPH, MPH
 
How a culture of disregard for the Public Taints the Federal LCR and Banalize...
How a culture of disregard for the Public Taints the Federal LCR and Banalize...How a culture of disregard for the Public Taints the Federal LCR and Banalize...
How a culture of disregard for the Public Taints the Federal LCR and Banalize...Jim Bloyd, DrPH, MPH
 
The Switchboard Traffic Engineering Problem for Mixed Contention/Cut-Through ...
The Switchboard Traffic Engineering Problem for Mixed Contention/Cut-Through ...The Switchboard Traffic Engineering Problem for Mixed Contention/Cut-Through ...
The Switchboard Traffic Engineering Problem for Mixed Contention/Cut-Through ...Tokyo University of Science
 

Destaque (16)

Selling Subscriptions Online
Selling Subscriptions OnlineSelling Subscriptions Online
Selling Subscriptions Online
 
A frayed connection: joblessness among teens in Chicago
A frayed connection: joblessness among teens in ChicagoA frayed connection: joblessness among teens in Chicago
A frayed connection: joblessness among teens in Chicago
 
Policy Development to Tackle Structural Origins of Health Inequities: Thought...
Policy Development to Tackle Structural Origins of Health Inequities: Thought...Policy Development to Tackle Structural Origins of Health Inequities: Thought...
Policy Development to Tackle Structural Origins of Health Inequities: Thought...
 
Public Health, Place and Social Media for Organizing to Eliminate Health Ineq...
Public Health, Place and Social Media for Organizing to Eliminate Health Ineq...Public Health, Place and Social Media for Organizing to Eliminate Health Ineq...
Public Health, Place and Social Media for Organizing to Eliminate Health Ineq...
 
Adam Maestro's music magazine evaluation presentation
Adam Maestro's music magazine evaluation presentationAdam Maestro's music magazine evaluation presentation
Adam Maestro's music magazine evaluation presentation
 
ალ. გრიბოედოვისა და ნინო ჭავჭავაძის სიყვარულის ისტორია
ალ. გრიბოედოვისა და ნინო ჭავჭავაძის სიყვარულის ისტორიაალ. გრიბოედოვისა და ნინო ჭავჭავაძის სიყვარულის ისტორია
ალ. გრიბოედოვისა და ნინო ჭავჭავაძის სიყვარულის ისტორია
 
Labor Unions: A public health institution
Labor Unions: A public health institutionLabor Unions: A public health institution
Labor Unions: A public health institution
 
Latin american critical ('social') epidemiology new settings for an old dream
Latin american critical ('social') epidemiology new settings for an old dreamLatin american critical ('social') epidemiology new settings for an old dream
Latin american critical ('social') epidemiology new settings for an old dream
 
Idaho
IdahoIdaho
Idaho
 
Fog Cloud Caching at Network Edge via Local Hardware Awareness Spaces
Fog Cloud Caching at Network Edge via Local Hardware Awareness SpacesFog Cloud Caching at Network Edge via Local Hardware Awareness Spaces
Fog Cloud Caching at Network Edge via Local Hardware Awareness Spaces
 
Power, Policy, and Structural Determinants of Health Inequities--Condensed Ex...
Power, Policy, and Structural Determinants of Health Inequities--Condensed Ex...Power, Policy, and Structural Determinants of Health Inequities--Condensed Ex...
Power, Policy, and Structural Determinants of Health Inequities--Condensed Ex...
 
Bulk-n-Pick Method for One-to-Many Data Transfer in Dense Wireless Spaces
Bulk-n-Pick Method for One-to-Many Data Transfer in Dense Wireless SpacesBulk-n-Pick Method for One-to-Many Data Transfer in Dense Wireless Spaces
Bulk-n-Pick Method for One-to-Many Data Transfer in Dense Wireless Spaces
 
Texaco and its Consultants
Texaco and its ConsultantsTexaco and its Consultants
Texaco and its Consultants
 
Racism, police violence and public health by Jasmine D. Graves, MPH Presentat...
Racism, police violence and public health by Jasmine D. Graves, MPH Presentat...Racism, police violence and public health by Jasmine D. Graves, MPH Presentat...
Racism, police violence and public health by Jasmine D. Graves, MPH Presentat...
 
How a culture of disregard for the Public Taints the Federal LCR and Banalize...
How a culture of disregard for the Public Taints the Federal LCR and Banalize...How a culture of disregard for the Public Taints the Federal LCR and Banalize...
How a culture of disregard for the Public Taints the Federal LCR and Banalize...
 
The Switchboard Traffic Engineering Problem for Mixed Contention/Cut-Through ...
The Switchboard Traffic Engineering Problem for Mixed Contention/Cut-Through ...The Switchboard Traffic Engineering Problem for Mixed Contention/Cut-Through ...
The Switchboard Traffic Engineering Problem for Mixed Contention/Cut-Through ...
 

Semelhante a From Politics to Parity: Using a Health Disparitiies Index to Guide Legislative Efforts for Health Equity

Giving everyone the health of the educated: an examination of whether social ...
Giving everyone the health of the educated: an examination of whether social ...Giving everyone the health of the educated: an examination of whether social ...
Giving everyone the health of the educated: an examination of whether social ...CookCountyPLACEMATTERS
 
Estimated Deaths Attributable to Social Factors in the United States
Estimated Deaths Attributable to Social Factors in the United StatesEstimated Deaths Attributable to Social Factors in the United States
Estimated Deaths Attributable to Social Factors in the United StatesJim Bloyd, DrPH, MPH
 
Role of informatics .
Role of informatics .Role of informatics .
Role of informatics .Bryant456
 
Health Disparities Essay
Health Disparities EssayHealth Disparities Essay
Health Disparities EssayMelissa Luster
 
Health Campaign to decrease Heart Disease
Health Campaign to decrease Heart Disease Health Campaign to decrease Heart Disease
Health Campaign to decrease Heart Disease Debbie Fernando
 
CDade-GraduateIntern-IDPH-OWHFS-MaternalMortality-FinalReport
CDade-GraduateIntern-IDPH-OWHFS-MaternalMortality-FinalReportCDade-GraduateIntern-IDPH-OWHFS-MaternalMortality-FinalReport
CDade-GraduateIntern-IDPH-OWHFS-MaternalMortality-FinalReportChelsea Dade, MS
 
Research methods final project
Research methods final projectResearch methods final project
Research methods final projectHayoung Cho
 
091310-introductionSmallestSize
091310-introductionSmallestSize091310-introductionSmallestSize
091310-introductionSmallestSizeWendell Cathcart
 
ANRV381-SO35-23 ARI 5 June 2009 934Income Inequality and.docx
ANRV381-SO35-23 ARI 5 June 2009 934Income Inequality and.docxANRV381-SO35-23 ARI 5 June 2009 934Income Inequality and.docx
ANRV381-SO35-23 ARI 5 June 2009 934Income Inequality and.docxjustine1simpson78276
 
C U L T U R E A S A M E D I A T O R O F H E A L T H D I S P A .docx
C U L T U R E A S A M E D I A T O R O F H E A L T H D I S P A .docxC U L T U R E A S A M E D I A T O R O F H E A L T H D I S P A .docx
C U L T U R E A S A M E D I A T O R O F H E A L T H D I S P A .docxhumphrieskalyn
 
COVID-19 Vaccine - Assessing Vulnerabilities
COVID-19 Vaccine - Assessing VulnerabilitiesCOVID-19 Vaccine - Assessing Vulnerabilities
COVID-19 Vaccine - Assessing VulnerabilitiesSC CTSI at USC and CHLA
 
Health Disparities Power Point FINAL
Health Disparities Power Point FINALHealth Disparities Power Point FINAL
Health Disparities Power Point FINALMirco Joseph
 
Quality Data Sources Essay Example Paper.docx
Quality Data Sources Essay Example Paper.docxQuality Data Sources Essay Example Paper.docx
Quality Data Sources Essay Example Paper.docxwrite22
 
Health and health care inequalities Name
Health and health care inequalities NameHealth and health care inequalities Name
Health and health care inequalities NameJeanmarieColbert3
 
Leveraging Assets to Improve Health and Equity in Rural Communities
Leveraging Assets to Improve Health and Equity in Rural CommunitiesLeveraging Assets to Improve Health and Equity in Rural Communities
Leveraging Assets to Improve Health and Equity in Rural Communitiesnado-web
 
Advancing Health Equity: A Data-Driven Approach Closes the Gap Between Intent...
Advancing Health Equity: A Data-Driven Approach Closes the Gap Between Intent...Advancing Health Equity: A Data-Driven Approach Closes the Gap Between Intent...
Advancing Health Equity: A Data-Driven Approach Closes the Gap Between Intent...Health Catalyst
 

Semelhante a From Politics to Parity: Using a Health Disparitiies Index to Guide Legislative Efforts for Health Equity (20)

Giving everyone the health of the educated: an examination of whether social ...
Giving everyone the health of the educated: an examination of whether social ...Giving everyone the health of the educated: an examination of whether social ...
Giving everyone the health of the educated: an examination of whether social ...
 
Estimated Deaths Attributable to Social Factors in the United States
Estimated Deaths Attributable to Social Factors in the United StatesEstimated Deaths Attributable to Social Factors in the United States
Estimated Deaths Attributable to Social Factors in the United States
 
Estimated Deaths Attributable to Social Factors in the United States
Estimated Deaths Attributable to Social Factors in the United StatesEstimated Deaths Attributable to Social Factors in the United States
Estimated Deaths Attributable to Social Factors in the United States
 
02chap ppt
02chap ppt02chap ppt
02chap ppt
 
Role of informatics .
Role of informatics .Role of informatics .
Role of informatics .
 
Vital statistics
Vital statisticsVital statistics
Vital statistics
 
Health Disparities Essay
Health Disparities EssayHealth Disparities Essay
Health Disparities Essay
 
Health Campaign to decrease Heart Disease
Health Campaign to decrease Heart Disease Health Campaign to decrease Heart Disease
Health Campaign to decrease Heart Disease
 
CDade-GraduateIntern-IDPH-OWHFS-MaternalMortality-FinalReport
CDade-GraduateIntern-IDPH-OWHFS-MaternalMortality-FinalReportCDade-GraduateIntern-IDPH-OWHFS-MaternalMortality-FinalReport
CDade-GraduateIntern-IDPH-OWHFS-MaternalMortality-FinalReport
 
Research methods final project
Research methods final projectResearch methods final project
Research methods final project
 
Putting Social Determinants in Perspective for Policymakers
Putting Social Determinants in Perspective for PolicymakersPutting Social Determinants in Perspective for Policymakers
Putting Social Determinants in Perspective for Policymakers
 
091310-introductionSmallestSize
091310-introductionSmallestSize091310-introductionSmallestSize
091310-introductionSmallestSize
 
ANRV381-SO35-23 ARI 5 June 2009 934Income Inequality and.docx
ANRV381-SO35-23 ARI 5 June 2009 934Income Inequality and.docxANRV381-SO35-23 ARI 5 June 2009 934Income Inequality and.docx
ANRV381-SO35-23 ARI 5 June 2009 934Income Inequality and.docx
 
C U L T U R E A S A M E D I A T O R O F H E A L T H D I S P A .docx
C U L T U R E A S A M E D I A T O R O F H E A L T H D I S P A .docxC U L T U R E A S A M E D I A T O R O F H E A L T H D I S P A .docx
C U L T U R E A S A M E D I A T O R O F H E A L T H D I S P A .docx
 
COVID-19 Vaccine - Assessing Vulnerabilities
COVID-19 Vaccine - Assessing VulnerabilitiesCOVID-19 Vaccine - Assessing Vulnerabilities
COVID-19 Vaccine - Assessing Vulnerabilities
 
Health Disparities Power Point FINAL
Health Disparities Power Point FINALHealth Disparities Power Point FINAL
Health Disparities Power Point FINAL
 
Quality Data Sources Essay Example Paper.docx
Quality Data Sources Essay Example Paper.docxQuality Data Sources Essay Example Paper.docx
Quality Data Sources Essay Example Paper.docx
 
Health and health care inequalities Name
Health and health care inequalities NameHealth and health care inequalities Name
Health and health care inequalities Name
 
Leveraging Assets to Improve Health and Equity in Rural Communities
Leveraging Assets to Improve Health and Equity in Rural CommunitiesLeveraging Assets to Improve Health and Equity in Rural Communities
Leveraging Assets to Improve Health and Equity in Rural Communities
 
Advancing Health Equity: A Data-Driven Approach Closes the Gap Between Intent...
Advancing Health Equity: A Data-Driven Approach Closes the Gap Between Intent...Advancing Health Equity: A Data-Driven Approach Closes the Gap Between Intent...
Advancing Health Equity: A Data-Driven Approach Closes the Gap Between Intent...
 

Mais de Jim Bloyd, DrPH, MPH

Towards a Critical Health Equity Research Stance: Why Epistemology and Method...
Towards a Critical Health Equity Research Stance: Why Epistemology and Method...Towards a Critical Health Equity Research Stance: Why Epistemology and Method...
Towards a Critical Health Equity Research Stance: Why Epistemology and Method...Jim Bloyd, DrPH, MPH
 
Links to Recommended Readings from June 4, 2020 presentation “Work With Organ...
Links to Recommended Readings from June 4, 2020 presentation “Work With Organ...Links to Recommended Readings from June 4, 2020 presentation “Work With Organ...
Links to Recommended Readings from June 4, 2020 presentation “Work With Organ...Jim Bloyd, DrPH, MPH
 
Senators call for investigation into Pulaski County jail amid COVID-19 outbreak
Senators call for investigation into Pulaski County jail amid COVID-19 outbreakSenators call for investigation into Pulaski County jail amid COVID-19 outbreak
Senators call for investigation into Pulaski County jail amid COVID-19 outbreakJim Bloyd, DrPH, MPH
 
A 5-Year Retrospective Analysis of Legal Intervention Injuries and Mortality ...
A 5-Year Retrospective Analysis of Legal Intervention Injuries and Mortality ...A 5-Year Retrospective Analysis of Legal Intervention Injuries and Mortality ...
A 5-Year Retrospective Analysis of Legal Intervention Injuries and Mortality ...Jim Bloyd, DrPH, MPH
 
Life Expectancy and Mortality Rates in the United States, 1959-2017
Life Expectancy and Mortality Rates in the United States, 1959-2017Life Expectancy and Mortality Rates in the United States, 1959-2017
Life Expectancy and Mortality Rates in the United States, 1959-2017Jim Bloyd, DrPH, MPH
 
Revisiting the Corporate and Commercial Determinants of Health
Revisiting the Corporate and Commercial Determinants of HealthRevisiting the Corporate and Commercial Determinants of Health
Revisiting the Corporate and Commercial Determinants of HealthJim Bloyd, DrPH, MPH
 
Public Health, Politics, and the Creation of Meaning: A Public Health of Cons...
Public Health, Politics, and the Creation of Meaning: A Public Health of Cons...Public Health, Politics, and the Creation of Meaning: A Public Health of Cons...
Public Health, Politics, and the Creation of Meaning: A Public Health of Cons...Jim Bloyd, DrPH, MPH
 
Cook County Department of Public Health at APHA 2019
Cook County Department of Public Health at APHA 2019Cook County Department of Public Health at APHA 2019
Cook County Department of Public Health at APHA 2019Jim Bloyd, DrPH, MPH
 
Linda Rae Murray Voices From The Field transcript
Linda Rae Murray Voices From The Field transcript Linda Rae Murray Voices From The Field transcript
Linda Rae Murray Voices From The Field transcript Jim Bloyd, DrPH, MPH
 
Exercise Linda Murray Voices of Public Health questions worksheet Used Septem...
Exercise Linda Murray Voices of Public Health questions worksheet Used Septem...Exercise Linda Murray Voices of Public Health questions worksheet Used Septem...
Exercise Linda Murray Voices of Public Health questions worksheet Used Septem...Jim Bloyd, DrPH, MPH
 
Exercise Doak Bloss slide exerpt--For IPHA September 12, 2019 presentation
Exercise Doak Bloss slide exerpt--For IPHA September 12, 2019 presentationExercise Doak Bloss slide exerpt--For IPHA September 12, 2019 presentation
Exercise Doak Bloss slide exerpt--For IPHA September 12, 2019 presentationJim Bloyd, DrPH, MPH
 
Roots of Health Inequity Dialogues: Designing Staff Development to Strengthen...
Roots of Health Inequity Dialogues: Designing Staff Development to Strengthen...Roots of Health Inequity Dialogues: Designing Staff Development to Strengthen...
Roots of Health Inequity Dialogues: Designing Staff Development to Strengthen...Jim Bloyd, DrPH, MPH
 
Selected References for Further Reading on Equity and Health
Selected References for Further Reading on Equity and HealthSelected References for Further Reading on Equity and Health
Selected References for Further Reading on Equity and HealthJim Bloyd, DrPH, MPH
 
Chicago Panels Details COOKED documentary Film July 12-25, 2019
Chicago Panels Details COOKED documentary Film July 12-25, 2019Chicago Panels Details COOKED documentary Film July 12-25, 2019
Chicago Panels Details COOKED documentary Film July 12-25, 2019Jim Bloyd, DrPH, MPH
 
Wage theft is a threat to community health and well-being. Wage theft is a pu...
Wage theft is a threat to community health and well-being. Wage theft is a pu...Wage theft is a threat to community health and well-being. Wage theft is a pu...
Wage theft is a threat to community health and well-being. Wage theft is a pu...Jim Bloyd, DrPH, MPH
 
New approaches for moving upstream how state and local health departments can...
New approaches for moving upstream how state and local health departments can...New approaches for moving upstream how state and local health departments can...
New approaches for moving upstream how state and local health departments can...Jim Bloyd, DrPH, MPH
 
Editorial: Evidence based policy or policy based evidence? by Michael Marmot
Editorial: Evidence based policy or policy based evidence? by Michael MarmotEditorial: Evidence based policy or policy based evidence? by Michael Marmot
Editorial: Evidence based policy or policy based evidence? by Michael MarmotJim Bloyd, DrPH, MPH
 
Can health equity survive epidemiology? Standards of proof and social determi...
Can health equity survive epidemiology? Standards of proof and social determi...Can health equity survive epidemiology? Standards of proof and social determi...
Can health equity survive epidemiology? Standards of proof and social determi...Jim Bloyd, DrPH, MPH
 
REDSACOL ALAMES ante la intromision imperial [REDSACOL ALAMES facing imperial...
REDSACOL ALAMES ante la intromision imperial [REDSACOL ALAMES facing imperial...REDSACOL ALAMES ante la intromision imperial [REDSACOL ALAMES facing imperial...
REDSACOL ALAMES ante la intromision imperial [REDSACOL ALAMES facing imperial...Jim Bloyd, DrPH, MPH
 

Mais de Jim Bloyd, DrPH, MPH (20)

Towards a Critical Health Equity Research Stance: Why Epistemology and Method...
Towards a Critical Health Equity Research Stance: Why Epistemology and Method...Towards a Critical Health Equity Research Stance: Why Epistemology and Method...
Towards a Critical Health Equity Research Stance: Why Epistemology and Method...
 
Links to Recommended Readings from June 4, 2020 presentation “Work With Organ...
Links to Recommended Readings from June 4, 2020 presentation “Work With Organ...Links to Recommended Readings from June 4, 2020 presentation “Work With Organ...
Links to Recommended Readings from June 4, 2020 presentation “Work With Organ...
 
Senators call for investigation into Pulaski County jail amid COVID-19 outbreak
Senators call for investigation into Pulaski County jail amid COVID-19 outbreakSenators call for investigation into Pulaski County jail amid COVID-19 outbreak
Senators call for investigation into Pulaski County jail amid COVID-19 outbreak
 
A 5-Year Retrospective Analysis of Legal Intervention Injuries and Mortality ...
A 5-Year Retrospective Analysis of Legal Intervention Injuries and Mortality ...A 5-Year Retrospective Analysis of Legal Intervention Injuries and Mortality ...
A 5-Year Retrospective Analysis of Legal Intervention Injuries and Mortality ...
 
Life Expectancy and Mortality Rates in the United States, 1959-2017
Life Expectancy and Mortality Rates in the United States, 1959-2017Life Expectancy and Mortality Rates in the United States, 1959-2017
Life Expectancy and Mortality Rates in the United States, 1959-2017
 
Revisiting the Corporate and Commercial Determinants of Health
Revisiting the Corporate and Commercial Determinants of HealthRevisiting the Corporate and Commercial Determinants of Health
Revisiting the Corporate and Commercial Determinants of Health
 
Public Health, Politics, and the Creation of Meaning: A Public Health of Cons...
Public Health, Politics, and the Creation of Meaning: A Public Health of Cons...Public Health, Politics, and the Creation of Meaning: A Public Health of Cons...
Public Health, Politics, and the Creation of Meaning: A Public Health of Cons...
 
Cook County Department of Public Health at APHA 2019
Cook County Department of Public Health at APHA 2019Cook County Department of Public Health at APHA 2019
Cook County Department of Public Health at APHA 2019
 
Linda Rae Murray Voices From The Field transcript
Linda Rae Murray Voices From The Field transcript Linda Rae Murray Voices From The Field transcript
Linda Rae Murray Voices From The Field transcript
 
Exercise Linda Murray Voices of Public Health questions worksheet Used Septem...
Exercise Linda Murray Voices of Public Health questions worksheet Used Septem...Exercise Linda Murray Voices of Public Health questions worksheet Used Septem...
Exercise Linda Murray Voices of Public Health questions worksheet Used Septem...
 
Exercise Doak Bloss slide exerpt--For IPHA September 12, 2019 presentation
Exercise Doak Bloss slide exerpt--For IPHA September 12, 2019 presentationExercise Doak Bloss slide exerpt--For IPHA September 12, 2019 presentation
Exercise Doak Bloss slide exerpt--For IPHA September 12, 2019 presentation
 
Roots of Health Inequity Dialogues: Designing Staff Development to Strengthen...
Roots of Health Inequity Dialogues: Designing Staff Development to Strengthen...Roots of Health Inequity Dialogues: Designing Staff Development to Strengthen...
Roots of Health Inequity Dialogues: Designing Staff Development to Strengthen...
 
Selected References for Further Reading on Equity and Health
Selected References for Further Reading on Equity and HealthSelected References for Further Reading on Equity and Health
Selected References for Further Reading on Equity and Health
 
Chicago Panels Details COOKED documentary Film July 12-25, 2019
Chicago Panels Details COOKED documentary Film July 12-25, 2019Chicago Panels Details COOKED documentary Film July 12-25, 2019
Chicago Panels Details COOKED documentary Film July 12-25, 2019
 
Wage theft is a threat to community health and well-being. Wage theft is a pu...
Wage theft is a threat to community health and well-being. Wage theft is a pu...Wage theft is a threat to community health and well-being. Wage theft is a pu...
Wage theft is a threat to community health and well-being. Wage theft is a pu...
 
New approaches for moving upstream how state and local health departments can...
New approaches for moving upstream how state and local health departments can...New approaches for moving upstream how state and local health departments can...
New approaches for moving upstream how state and local health departments can...
 
Editorial: Evidence based policy or policy based evidence? by Michael Marmot
Editorial: Evidence based policy or policy based evidence? by Michael MarmotEditorial: Evidence based policy or policy based evidence? by Michael Marmot
Editorial: Evidence based policy or policy based evidence? by Michael Marmot
 
Can health equity survive epidemiology? Standards of proof and social determi...
Can health equity survive epidemiology? Standards of proof and social determi...Can health equity survive epidemiology? Standards of proof and social determi...
Can health equity survive epidemiology? Standards of proof and social determi...
 
Towards a politics of health
Towards a politics of healthTowards a politics of health
Towards a politics of health
 
REDSACOL ALAMES ante la intromision imperial [REDSACOL ALAMES facing imperial...
REDSACOL ALAMES ante la intromision imperial [REDSACOL ALAMES facing imperial...REDSACOL ALAMES ante la intromision imperial [REDSACOL ALAMES facing imperial...
REDSACOL ALAMES ante la intromision imperial [REDSACOL ALAMES facing imperial...
 

Último

Call Girls Dehradun Just Call 9907093804 Top Class Call Girl Service Available
Call Girls Dehradun Just Call 9907093804 Top Class Call Girl Service AvailableCall Girls Dehradun Just Call 9907093804 Top Class Call Girl Service Available
Call Girls Dehradun Just Call 9907093804 Top Class Call Girl Service AvailableDipal Arora
 
Vip Call Girls Anna Salai Chennai 👉 8250192130 ❣️💯 Top Class Girls Available
Vip Call Girls Anna Salai Chennai 👉 8250192130 ❣️💯 Top Class Girls AvailableVip Call Girls Anna Salai Chennai 👉 8250192130 ❣️💯 Top Class Girls Available
Vip Call Girls Anna Salai Chennai 👉 8250192130 ❣️💯 Top Class Girls AvailableNehru place Escorts
 
Bangalore Call Girl Whatsapp Number 100% Complete Your Sexual Needs
Bangalore Call Girl Whatsapp Number 100% Complete Your Sexual NeedsBangalore Call Girl Whatsapp Number 100% Complete Your Sexual Needs
Bangalore Call Girl Whatsapp Number 100% Complete Your Sexual NeedsGfnyt
 
Call Girls Bareilly Just Call 9907093804 Top Class Call Girl Service Available
Call Girls Bareilly Just Call 9907093804 Top Class Call Girl Service AvailableCall Girls Bareilly Just Call 9907093804 Top Class Call Girl Service Available
Call Girls Bareilly Just Call 9907093804 Top Class Call Girl Service AvailableDipal Arora
 
♛VVIP Hyderabad Call Girls Chintalkunta🖕7001035870🖕Riya Kappor Top Call Girl ...
♛VVIP Hyderabad Call Girls Chintalkunta🖕7001035870🖕Riya Kappor Top Call Girl ...♛VVIP Hyderabad Call Girls Chintalkunta🖕7001035870🖕Riya Kappor Top Call Girl ...
♛VVIP Hyderabad Call Girls Chintalkunta🖕7001035870🖕Riya Kappor Top Call Girl ...astropune
 
Lucknow Call girls - 8800925952 - 24x7 service with hotel room
Lucknow Call girls - 8800925952 - 24x7 service with hotel roomLucknow Call girls - 8800925952 - 24x7 service with hotel room
Lucknow Call girls - 8800925952 - 24x7 service with hotel roomdiscovermytutordmt
 
VIP Call Girls Indore Kirti 💚😋 9256729539 🚀 Indore Escorts
VIP Call Girls Indore Kirti 💚😋  9256729539 🚀 Indore EscortsVIP Call Girls Indore Kirti 💚😋  9256729539 🚀 Indore Escorts
VIP Call Girls Indore Kirti 💚😋 9256729539 🚀 Indore Escortsaditipandeya
 
💎VVIP Kolkata Call Girls Parganas🩱7001035870🩱Independent Girl ( Ac Rooms Avai...
💎VVIP Kolkata Call Girls Parganas🩱7001035870🩱Independent Girl ( Ac Rooms Avai...💎VVIP Kolkata Call Girls Parganas🩱7001035870🩱Independent Girl ( Ac Rooms Avai...
💎VVIP Kolkata Call Girls Parganas🩱7001035870🩱Independent Girl ( Ac Rooms Avai...Taniya Sharma
 
Call Girls Service Surat Samaira ❤️🍑 8250192130 👄 Independent Escort Service ...
Call Girls Service Surat Samaira ❤️🍑 8250192130 👄 Independent Escort Service ...Call Girls Service Surat Samaira ❤️🍑 8250192130 👄 Independent Escort Service ...
Call Girls Service Surat Samaira ❤️🍑 8250192130 👄 Independent Escort Service ...CALL GIRLS
 
Low Rate Call Girls Kochi Anika 8250192130 Independent Escort Service Kochi
Low Rate Call Girls Kochi Anika 8250192130 Independent Escort Service KochiLow Rate Call Girls Kochi Anika 8250192130 Independent Escort Service Kochi
Low Rate Call Girls Kochi Anika 8250192130 Independent Escort Service KochiSuhani Kapoor
 
Russian Escorts Girls Nehru Place ZINATHI 🔝9711199012 ☪ 24/7 Call Girls Delhi
Russian Escorts Girls  Nehru Place ZINATHI 🔝9711199012 ☪ 24/7 Call Girls DelhiRussian Escorts Girls  Nehru Place ZINATHI 🔝9711199012 ☪ 24/7 Call Girls Delhi
Russian Escorts Girls Nehru Place ZINATHI 🔝9711199012 ☪ 24/7 Call Girls DelhiAlinaDevecerski
 
Night 7k to 12k Chennai City Center Call Girls 👉👉 7427069034⭐⭐ 100% Genuine E...
Night 7k to 12k Chennai City Center Call Girls 👉👉 7427069034⭐⭐ 100% Genuine E...Night 7k to 12k Chennai City Center Call Girls 👉👉 7427069034⭐⭐ 100% Genuine E...
Night 7k to 12k Chennai City Center Call Girls 👉👉 7427069034⭐⭐ 100% Genuine E...hotbabesbook
 
VIP Russian Call Girls in Varanasi Samaira 8250192130 Independent Escort Serv...
VIP Russian Call Girls in Varanasi Samaira 8250192130 Independent Escort Serv...VIP Russian Call Girls in Varanasi Samaira 8250192130 Independent Escort Serv...
VIP Russian Call Girls in Varanasi Samaira 8250192130 Independent Escort Serv...Neha Kaur
 
(Rocky) Jaipur Call Girl - 09521753030 Escorts Service 50% Off with Cash ON D...
(Rocky) Jaipur Call Girl - 09521753030 Escorts Service 50% Off with Cash ON D...(Rocky) Jaipur Call Girl - 09521753030 Escorts Service 50% Off with Cash ON D...
(Rocky) Jaipur Call Girl - 09521753030 Escorts Service 50% Off with Cash ON D...indiancallgirl4rent
 
VIP Service Call Girls Sindhi Colony 📳 7877925207 For 18+ VIP Call Girl At Th...
VIP Service Call Girls Sindhi Colony 📳 7877925207 For 18+ VIP Call Girl At Th...VIP Service Call Girls Sindhi Colony 📳 7877925207 For 18+ VIP Call Girl At Th...
VIP Service Call Girls Sindhi Colony 📳 7877925207 For 18+ VIP Call Girl At Th...jageshsingh5554
 
Call Girls Nagpur Just Call 9907093804 Top Class Call Girl Service Available
Call Girls Nagpur Just Call 9907093804 Top Class Call Girl Service AvailableCall Girls Nagpur Just Call 9907093804 Top Class Call Girl Service Available
Call Girls Nagpur Just Call 9907093804 Top Class Call Girl Service AvailableDipal Arora
 
VIP Mumbai Call Girls Hiranandani Gardens Just Call 9920874524 with A/C Room ...
VIP Mumbai Call Girls Hiranandani Gardens Just Call 9920874524 with A/C Room ...VIP Mumbai Call Girls Hiranandani Gardens Just Call 9920874524 with A/C Room ...
VIP Mumbai Call Girls Hiranandani Gardens Just Call 9920874524 with A/C Room ...Garima Khatri
 
Best Rate (Guwahati ) Call Girls Guwahati ⟟ 8617370543 ⟟ High Class Call Girl...
Best Rate (Guwahati ) Call Girls Guwahati ⟟ 8617370543 ⟟ High Class Call Girl...Best Rate (Guwahati ) Call Girls Guwahati ⟟ 8617370543 ⟟ High Class Call Girl...
Best Rate (Guwahati ) Call Girls Guwahati ⟟ 8617370543 ⟟ High Class Call Girl...Dipal Arora
 
Top Rated Hyderabad Call Girls Erragadda ⟟ 6297143586 ⟟ Call Me For Genuine ...
Top Rated  Hyderabad Call Girls Erragadda ⟟ 6297143586 ⟟ Call Me For Genuine ...Top Rated  Hyderabad Call Girls Erragadda ⟟ 6297143586 ⟟ Call Me For Genuine ...
Top Rated Hyderabad Call Girls Erragadda ⟟ 6297143586 ⟟ Call Me For Genuine ...chandars293
 
Call Girls Horamavu WhatsApp Number 7001035870 Meeting With Bangalore Escorts
Call Girls Horamavu WhatsApp Number 7001035870 Meeting With Bangalore EscortsCall Girls Horamavu WhatsApp Number 7001035870 Meeting With Bangalore Escorts
Call Girls Horamavu WhatsApp Number 7001035870 Meeting With Bangalore Escortsvidya singh
 

Último (20)

Call Girls Dehradun Just Call 9907093804 Top Class Call Girl Service Available
Call Girls Dehradun Just Call 9907093804 Top Class Call Girl Service AvailableCall Girls Dehradun Just Call 9907093804 Top Class Call Girl Service Available
Call Girls Dehradun Just Call 9907093804 Top Class Call Girl Service Available
 
Vip Call Girls Anna Salai Chennai 👉 8250192130 ❣️💯 Top Class Girls Available
Vip Call Girls Anna Salai Chennai 👉 8250192130 ❣️💯 Top Class Girls AvailableVip Call Girls Anna Salai Chennai 👉 8250192130 ❣️💯 Top Class Girls Available
Vip Call Girls Anna Salai Chennai 👉 8250192130 ❣️💯 Top Class Girls Available
 
Bangalore Call Girl Whatsapp Number 100% Complete Your Sexual Needs
Bangalore Call Girl Whatsapp Number 100% Complete Your Sexual NeedsBangalore Call Girl Whatsapp Number 100% Complete Your Sexual Needs
Bangalore Call Girl Whatsapp Number 100% Complete Your Sexual Needs
 
Call Girls Bareilly Just Call 9907093804 Top Class Call Girl Service Available
Call Girls Bareilly Just Call 9907093804 Top Class Call Girl Service AvailableCall Girls Bareilly Just Call 9907093804 Top Class Call Girl Service Available
Call Girls Bareilly Just Call 9907093804 Top Class Call Girl Service Available
 
♛VVIP Hyderabad Call Girls Chintalkunta🖕7001035870🖕Riya Kappor Top Call Girl ...
♛VVIP Hyderabad Call Girls Chintalkunta🖕7001035870🖕Riya Kappor Top Call Girl ...♛VVIP Hyderabad Call Girls Chintalkunta🖕7001035870🖕Riya Kappor Top Call Girl ...
♛VVIP Hyderabad Call Girls Chintalkunta🖕7001035870🖕Riya Kappor Top Call Girl ...
 
Lucknow Call girls - 8800925952 - 24x7 service with hotel room
Lucknow Call girls - 8800925952 - 24x7 service with hotel roomLucknow Call girls - 8800925952 - 24x7 service with hotel room
Lucknow Call girls - 8800925952 - 24x7 service with hotel room
 
VIP Call Girls Indore Kirti 💚😋 9256729539 🚀 Indore Escorts
VIP Call Girls Indore Kirti 💚😋  9256729539 🚀 Indore EscortsVIP Call Girls Indore Kirti 💚😋  9256729539 🚀 Indore Escorts
VIP Call Girls Indore Kirti 💚😋 9256729539 🚀 Indore Escorts
 
💎VVIP Kolkata Call Girls Parganas🩱7001035870🩱Independent Girl ( Ac Rooms Avai...
💎VVIP Kolkata Call Girls Parganas🩱7001035870🩱Independent Girl ( Ac Rooms Avai...💎VVIP Kolkata Call Girls Parganas🩱7001035870🩱Independent Girl ( Ac Rooms Avai...
💎VVIP Kolkata Call Girls Parganas🩱7001035870🩱Independent Girl ( Ac Rooms Avai...
 
Call Girls Service Surat Samaira ❤️🍑 8250192130 👄 Independent Escort Service ...
Call Girls Service Surat Samaira ❤️🍑 8250192130 👄 Independent Escort Service ...Call Girls Service Surat Samaira ❤️🍑 8250192130 👄 Independent Escort Service ...
Call Girls Service Surat Samaira ❤️🍑 8250192130 👄 Independent Escort Service ...
 
Low Rate Call Girls Kochi Anika 8250192130 Independent Escort Service Kochi
Low Rate Call Girls Kochi Anika 8250192130 Independent Escort Service KochiLow Rate Call Girls Kochi Anika 8250192130 Independent Escort Service Kochi
Low Rate Call Girls Kochi Anika 8250192130 Independent Escort Service Kochi
 
Russian Escorts Girls Nehru Place ZINATHI 🔝9711199012 ☪ 24/7 Call Girls Delhi
Russian Escorts Girls  Nehru Place ZINATHI 🔝9711199012 ☪ 24/7 Call Girls DelhiRussian Escorts Girls  Nehru Place ZINATHI 🔝9711199012 ☪ 24/7 Call Girls Delhi
Russian Escorts Girls Nehru Place ZINATHI 🔝9711199012 ☪ 24/7 Call Girls Delhi
 
Night 7k to 12k Chennai City Center Call Girls 👉👉 7427069034⭐⭐ 100% Genuine E...
Night 7k to 12k Chennai City Center Call Girls 👉👉 7427069034⭐⭐ 100% Genuine E...Night 7k to 12k Chennai City Center Call Girls 👉👉 7427069034⭐⭐ 100% Genuine E...
Night 7k to 12k Chennai City Center Call Girls 👉👉 7427069034⭐⭐ 100% Genuine E...
 
VIP Russian Call Girls in Varanasi Samaira 8250192130 Independent Escort Serv...
VIP Russian Call Girls in Varanasi Samaira 8250192130 Independent Escort Serv...VIP Russian Call Girls in Varanasi Samaira 8250192130 Independent Escort Serv...
VIP Russian Call Girls in Varanasi Samaira 8250192130 Independent Escort Serv...
 
(Rocky) Jaipur Call Girl - 09521753030 Escorts Service 50% Off with Cash ON D...
(Rocky) Jaipur Call Girl - 09521753030 Escorts Service 50% Off with Cash ON D...(Rocky) Jaipur Call Girl - 09521753030 Escorts Service 50% Off with Cash ON D...
(Rocky) Jaipur Call Girl - 09521753030 Escorts Service 50% Off with Cash ON D...
 
VIP Service Call Girls Sindhi Colony 📳 7877925207 For 18+ VIP Call Girl At Th...
VIP Service Call Girls Sindhi Colony 📳 7877925207 For 18+ VIP Call Girl At Th...VIP Service Call Girls Sindhi Colony 📳 7877925207 For 18+ VIP Call Girl At Th...
VIP Service Call Girls Sindhi Colony 📳 7877925207 For 18+ VIP Call Girl At Th...
 
Call Girls Nagpur Just Call 9907093804 Top Class Call Girl Service Available
Call Girls Nagpur Just Call 9907093804 Top Class Call Girl Service AvailableCall Girls Nagpur Just Call 9907093804 Top Class Call Girl Service Available
Call Girls Nagpur Just Call 9907093804 Top Class Call Girl Service Available
 
VIP Mumbai Call Girls Hiranandani Gardens Just Call 9920874524 with A/C Room ...
VIP Mumbai Call Girls Hiranandani Gardens Just Call 9920874524 with A/C Room ...VIP Mumbai Call Girls Hiranandani Gardens Just Call 9920874524 with A/C Room ...
VIP Mumbai Call Girls Hiranandani Gardens Just Call 9920874524 with A/C Room ...
 
Best Rate (Guwahati ) Call Girls Guwahati ⟟ 8617370543 ⟟ High Class Call Girl...
Best Rate (Guwahati ) Call Girls Guwahati ⟟ 8617370543 ⟟ High Class Call Girl...Best Rate (Guwahati ) Call Girls Guwahati ⟟ 8617370543 ⟟ High Class Call Girl...
Best Rate (Guwahati ) Call Girls Guwahati ⟟ 8617370543 ⟟ High Class Call Girl...
 
Top Rated Hyderabad Call Girls Erragadda ⟟ 6297143586 ⟟ Call Me For Genuine ...
Top Rated  Hyderabad Call Girls Erragadda ⟟ 6297143586 ⟟ Call Me For Genuine ...Top Rated  Hyderabad Call Girls Erragadda ⟟ 6297143586 ⟟ Call Me For Genuine ...
Top Rated Hyderabad Call Girls Erragadda ⟟ 6297143586 ⟟ Call Me For Genuine ...
 
Call Girls Horamavu WhatsApp Number 7001035870 Meeting With Bangalore Escorts
Call Girls Horamavu WhatsApp Number 7001035870 Meeting With Bangalore EscortsCall Girls Horamavu WhatsApp Number 7001035870 Meeting With Bangalore Escorts
Call Girls Horamavu WhatsApp Number 7001035870 Meeting With Bangalore Escorts
 

From Politics to Parity: Using a Health Disparitiies Index to Guide Legislative Efforts for Health Equity

  • 1. RESEARCH AND PRACTICE From Politics to Parity: Using a Health Disparities Index to Guide Legislative Efforts for Health Equity Bryant Cameron Webb, BA, Sean L. Simpson, PhD, and Kristen G. Hairston, MD, MPH The US Congress took its first stand against Objectives. We created an index quantifying the longitudinal burden of racial minority health disparities with the passage of health disparities by state and compared this index to variables to guide the the Minority Health and Health Disparities construction of, and validate support for, legislative efforts aimed at eliminating Research and Education Act in October 2000. health disparities. This measure commissioned the creation of Methods. We evaluated 5 focus areas of greatest racial disparities in health the National Center for Minority Health and from 1999 to 2005 and compiled state health disparities index (HDI) scores. We Health Disparities and mandated health dis- compared these scores with variables representing the purported social de- parities research and reporting.1 The goal was to terminants of health. conscientiously move the discourse from identi- Results. Massachusetts (0.35), Oklahoma (0.35), and Washington (0.39) aver- fying health disparities to eliminating them. aged the fewest disparities. Michigan (1.22), Wisconsin (1.32), and Illinois (1.50) The years that followed brought progress in averaged the greatest disparities. The statistical reference point for nationwide average racial disparities was 1.00. The longitudinal mixed model procedure researching causation, positing solutions, and yielded statistically significant correlations between HDI scores and Black state supporting promising models for the elimination population percentage as well as with the racial gap in uninsured percentages. of these disparities. The congressionally man- We noted a trend for HDI correlations with median household income ratios. dated Institutes of Medicine report Unequal Conclusions. On the basis of the HDI-established trends in the extent and Treatment grouped factors of causation into 3 distribution of racial health disparities, and their correlated social determinants basic areas: health system–level factors, care of health, policymakers should consider incorporating this tool to advise future process variables, and patient-level variables.2 efforts in minority health legislation. (Am J Public Health. 2011;101:554–560. doi: In addition, its authors proffered strategies 10.2105/AJPH.2009.171157) for achieving health equity with recommen- dations that included legal, regulatory, and policy interventions.2 When considered in sum, these state and METHODS With increasing research and dialogue, legis- federal legislative efforts have ushered in a new lators began considering the next appropriate age of health disparities discourse. Champions Six of the most glaring indicators of racial intervention. Congress has continued to debate of comprehensive health equity legislation and ethnic health disparities, as referenced by solutions to the health care issues facing minority argue that it is a necessary adjunct to existing the Department of Health and Human Services, communities, introducing 6 comprehensive mi- efforts to eliminate racial and ethnic health were the foundation for this HDI. These focus nority health equity bills since 2000. In 2007, disparities. Skeptics assert that the disparities areas are: cancer screening and management, the 110th Congress saw the introduction of an can be largely addressed through generally cardiovascular disease (CVD), diabetes, HIV/ unprecedented 16 health disparities–focused improving access to quality care for all Amer- AIDS, immunizations, and infant mortality.6 bills.3 Despite the increasing legislative interest in icans. Most, however, appreciate the utility in Mortality was selected as the primary outcome improving minority health, no comprehensive bringing the discussion into the legislative for each condition as a proxy for disease severity, minority health measure has become public law arena as this issue continues to gain momen- because of its value as a more precise endpoint since the Minority Health and Health Disparities tum. than morbidity and its compelling significance Research and Education Act of 2000. In this context, we recognized a need to to legislators. We omitted immunization statistics, The proposition of legislative remedies for create tools to guide legislative efforts for as immunization is unique among the 6 focus health disparities has not been unique to achieving minority health equity. The goals areas as it is a preventive measure rather than Congress. Since 1999, a majority of state of our analysis were 3-fold: (1) to establish an a distinct cause of mortality. legislatures have passed minority health legis- index depicting variations in US racial health We obtained mortality statistics from the lation.4 These laws have addressed cultural disparities; (2) to evaluate the association be- National Center for Health Statistics Com- competency, health professional recruitment and tween this health disparities index (HDI) and pressed Mortality File from 1999 to 20057 for retention, and disease burden or risk factor known social determinants of health; and (3) to each of the 5 disease processes. We specifically management. Furthermore, 40 states created use statistical correlations to help guide mi- calculated crude mortality rates per 100 000 for offices of minority health, and 4 states designated nority health legislative interventions at the Black and White populations aged 20 to 64 official minority health contacts.5 state and federal levels. years in all 50 states. For each disease process, 554 | Research and Practice | Peer Reviewed | Webb et al. American Journal of Public Health | March 2011, Vol 101, No. 3
  • 2. RESEARCH AND PRACTICE we calculated a state disparity value (SDV). social determinants of health.8 These inclu- because of missing values. Additionally, 10 For example, we calculated the SDV for CVD ded income and social status, education and observations were removed from this latter in Maryland during 2003 by using the for- literacy, health services, culture, and social analysis because of missing values for the gap mula: environments. in uninsured percentages. We omitted from the To evaluate income and social status, we analysis states with unreliable mortality data, as ð1Þ SDVCVD in 2003 ¼ calculated income disparities as a ratio of defined in the Compressed Mortality File as ðBlack mortalityfrom CVD in MD during 2003 White-to-Black median household incomes values fewer than 20 deaths per annum in any À White mortalityfrom CVD in MD during 2003 Þ by using the 2000–2005 Annual Social and HDI subcategory.14 =White mortalityfrom CVD in MD during 2003 Economic Supplements of the US Census Bureau’s Current Population Survey.9 Next, RESULTS as our variable for education and literacy, we This value is representative of the ratio of calculated the ratio of Black-to-White high Thirty-three states had sufficient data for excess Black mortality to the White mortality school dropout rates as reported by the National the calculation of HDI scores from 1999 to per 100 000 individuals for a single disease Center for Educational Statistics between 2000 2005, with 17 states omitted.1 Among the process in a specific state. Additionally, we and 2005.10 As a proxy for culture and social states for which scores were compiled, Massa- calculated a cumulative US disparity value environment, we used 2 indicators: geographical chusetts (0.35), Oklahoma (0.35), Washington (USDV) for each disease process during a par- region, as divided by the US Census Bureau,11 (0.39), Nevada (0.53), and Kentucky (0.57) ticular year. We calculated the HDI value per and the percentage of each state’s population that had the lowest 7-year average HDI scores, in- year, per disease process, per state with the is Black. These variables were meant to loosely dicative of the least racial health disparity. formula: model the cultural and social environment in California (1.17), North Carolina (1.20), Michigan each state. (1.22), Wisconsin (1.32), and Illinois (1.50) had ð2Þ HDICVD in ðyearÞ ¼ We depicted health services through 3 the highest 7-year average HDI scores, making SDVCVD in ðyearÞ =USDVCVD in ðyearÞ separate variables. First, differences in access them the states averaging the most racial health to health services were represented by the disparity between 1999 and 2005 (Table 1). We calculated a comprehensive HDICOMP difference between Black and White unin- When we used Pearson’s correlation coeffi- score for each year by using the following sured rates as reported in Behavior Risk cients, the HDI was positively correlated to formula, for example: Factor Surveillance System questionnaire racial disparities in median household income responses. In addition, state Medicaid pro- (P < .001), state Black population (P < .001), ð3Þ HDI2003 ¼ gram eligibility was selected as a proxy for and Medicaid eligibility scores (P < .01). We ½HDICancer in 2003 1 HDICVD the size of the state’s safety net for its most found a negative correlation between HDI 1 HDIDiabetes 1 HDIHIV vulnerable populations. This value was scores and state health spending (P < .001). 1 HDIinfant mortility Š=5 extracted from Public Citizen Health Re- The longitudinal mixed model analysis in- search Group’s analysis of state Medicaid cluded 5 years of data (2000–2004) for each We calculated these HDI scores for the 7 programs, which evaluated each state Med- state rather than the entire 7-year data set. years in the analysis for all 50 states as suffi- icaid program for its coverage of optional The 1999 and 2005 data were eliminated cient data allowed. eligibility groups.12 Finally, to capture the in- from the analysis because of the missing A state HDI score of 1.00 represents racial creased spending that would be associated with values for median household income and health disparities equivalent to those existing health disparities, we evaluated state health state health spending for those years. In the among the entire US population. An HDI score spending, calculated as a percentage of the gross final analysis, 32 states were included (Ten- of 0.00 would represent racial health parity, state product.13 nessee was ultimately omitted because of and states with HDI scores of 0.01 to 0.99 a lack of a state Medicaid eligibility score), experience less racial health disparity in mor- Statistical Analysis and a total of 150 observations. The longi- tality than the inequalities among the US We first employed Pearson’s correlation co- tudinal mixed model analysis yielded a cor- population at large. Lastly, states with HDI efficients to assess the association between relation between HDI scores and both scores exceeding 1.00 exhibit more racial state HDI scores and variables representing the racial disparities in uninsured percentages health disparity than US averages, indicating social determinants of health. We completed (P < .01) and state Black population (P < .01). larger differences in Black and White mortality a second, more sophisticated longitudinal We found a trend toward significance be- for the selected conditions. mixed model analysis to reassess correlations tween HDI scores and racial disparities in in the data from 2000 to 2004. In the mixed median household income (P = .074). Table Selection of Variables model we used yearly data for disparities in 2 details the outcomes of the statistical To test the validity of the HDI as a tool uninsured percentages, state health spending, analysis both for Pearson’s correlation co- to measure health disparities, we first evalu- and disparities in median household income, efficients and the longitudinal mixed model ated its correlation to several of the known but averaged data for high school dropout rate analysis. March 2011, Vol 101, No. 3 | American Journal of Public Health Webb et al. | Peer Reviewed | Research and Practice | 555
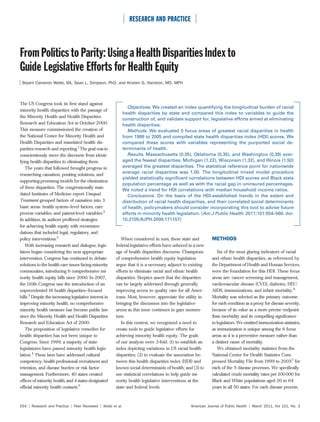
  • 3. RESEARCH AND PRACTICE Tracking Progress in Reducing TABLE 1—Health Disparities Index Scores by Rank, 1999–2005 Disparities Statea 1999 2000 2001 2002 2003 2004 2005 Average Rankb According to HDI scores, most states failed to significantly reduce the extent of health Massachusetts 0.27 0.44 0.32 0.33 0.52 0.22 0.31 0.35 1 disparities between 1999 and 2005, an ob- Oklahoma 0.46 0.35 0.28 0.36 0.26 0.29 0.44 0.35 2 servation consistent with the findings of the Washington 0.63 0.18 0.15 0.36 0.48 0.34 0.61 0.39 3 National Healthcare Disparities Reports issued Nevada 0.44 0.38 0.57 0.51 0.51 0.67 0.64 0.53 4 during the study period.15–17 The states with the Kentucky 0.65 0.52 0.42 0.69 0.57 0.53 0.59 0.57 5 fewest disparities in 1999 generally maintained New York 0.57 0.60 0.60 0.53 0.58 0.60 0.69 0.60 6 their status among the most equitable states by Florida 0.68 0.66 0.59 0.66 0.56 0.59 0.55 0.61 7 2005, whereas states with the greatest disparities Minnesota 0.85 0.65 0.59 0.29 0.36 0.64 0.91 0.61 8 largely remained among the states with the Colorado 0.62 0.82 0.66 0.93 0.78 0.36 0.60 0.68 9 highest HDI scores throughout the duration of Connecticut 0.63 0.84 1.02 0.73 0.69 0.58 0.81 0.75 10 the study. The profiles of the states at either end Arkansas 0.90 0.89 0.73 0.73 0.73 0.65 0.76 0.77 11 of the rankings were noticeably divergent with Mississippi 0.76 0.72 0.81 0.88 0.75 0.69 0.85 0.78 12 regard to the Black population percentage and Alabama 0.94 0.76 0.92 0.74 0.83 0.63 0.75 0.79 13 racial disparities in uninsured percentages, Georgia 0.86 0.82 0.78 0.78 0.78 0.82 0.78 0.80 14 whereas disparities in median household income Indiana 0.96 0.72 0.76 0.91 0.86 0.83 0.81 0.84 15 were not significantly different among states at Kansas 0.80 0.87 0.78 1.08 0.69 0.72 1.15 0.87 16 either end of the HDI rankings (Table 3). Delaware 1.21 0.86 0.97 0.73 0.92 0.65 0.93 0.90 17 Although few states exhibited any meaningful Ohio 0.82 0.86 0.85 0.95 0.95 1.02 0.94 0.91 18 diminution of health disparities, some displayed Tennessee 0.96 1.03 0.93 0.95 0.85 0.85 0.84 0.91 19 steady improvement in their HDI scores over Missouri 1.15 0.83 0.95 1.14 0.89 0.88 0.92 0.97 20 the study duration. Maryland, for example, Texas 0.92 0.94 0.98 1.04 1.06 1.00 1.07 1.00 21 began the analysis as the state exhibiting the Nebraska 1.12 0.91 0.92 0.88 1.21 1.01 0.98 1.01 22 third-most racial health care disparity in 1999, Louisiana 1.07 1.02 1.03 1.11 1.12 1.06 0.96 1.05 23 with an HDI score of 1.25. By 2005, however, New Jersey 1.10 1.09 1.12 1.08 1.11 1.04 1.05 1.08 24 this score had steadily decreased to a value of South Carolina 1.11 1.13 1.13 1.05 1.18 1.11 0.90 1.09 25 0.93, a value that was below the average for Maryland 1.25 1.24 1.23 1.02 1.11 0.96 0.93 1.11 26 racial health care disparity across the nation. Pennsylvania 1.33 1.07 1.09 1.03 1.21 1.08 1.02 1.12 27 The greatest improvement was made in the Virginia 1.03 1.12 1.20 1.32 0.96 1.20 1.02 1.12 28 interval between 2001 and 2002, as the HDI California 1.09 1.16 1.16 1.18 1.18 1.23 1.22 1.17 29 score decreased from 1.23 to 1.02. Of note, North Carolina 1.12 1.28 1.25 1.24 1.13 1.25 1.10 1.20 30 Maryland passed a total of 4 state laws ad- Michigan 1.24 1.05 1.18 1.29 1.21 1.24 1.35 1.22 31 dressing health disparities in 2002 and 2003.18 Wisconsin 1.11 1.41 1.03 1.19 1.55 1.65 1.34 1.32 32 We are not, however, attributing Maryland’s Illinois 1.47 1.44 1.42 1.52 1.57 1.58 1.51 1.50 33 decreasing HDI value solely to the passage of Note. Health disparities index is an index depicting state variations in US racial health disparities. Values < 0.00 represent that state legislation. Rather, the legislative a Black mortality rate that is better than the White mortality rate. Values of 0.00 represent parity in Black–White mortality. commitment to the reduction of disparities in Values > 0.00 but < 1.00 represent state mortality disparities that are below the national average for mortality disparities. Maryland reflects a statewide emphasis on im- Values of 1.00 represent state mortality disparities that equal the national average for mortality disparities. Values > 1.00 represent state mortality disparities that exceed the national average for mortality disparities. proving the health of minority communities. a Alaska, Arizona, Hawaii, Idaho, Iowa, Maine, Montana, New Hampshire, New Mexico, North Dakota, Oregon, Rhode Island, Furthermore, this commitment was statistically South Dakota, Utah, Vermont, West Virginia, and Wyoming had insufficient data for the calculation of a health disparities reflected in the reduction of health care dispar- index score. b State rank with respect to 33 states with sufficient data to be included in the analysis. ities as depicted by the HDI values. Tracking Health Disparities in Minority DISCUSSION created to depict variations in the extent and Health Focus Areas distribution of the racial disparities that are The HDI offers states the opportunity to The HDI has several strengths, including its known to persist. The HDI builds upon the track disparities in mortality among cancer, evaluation of health disparities. Rather than corpus of health disparities literature to depict CVD, diabetes, HIV/AIDS, and infant mortal- focusing the analysis on well described gaps the racial health inequalities for each state ity. Figure 1 illustrates the HDI disease-specific between Black and White health statuses within the larger, national context of health scores for these 5 focus areas in the 2 states at according to various indicators, the HDI was disparities discourse. polar ends of the HDI rankings. This index 556 | Research and Practice | Peer Reviewed | Webb et al. American Journal of Public Health | March 2011, Vol 101, No. 3
  • 4. RESEARCH AND PRACTICE Application of the HDI to the TABLE 2—Statistical Correlations Between Health Disparities Index Scores Development of Minority Health and Selected Variables Legislation Health Disparities Index Scores Through statistical correlations, the HDI becomes a valuable tool to evaluate health- Pearson’s Correlation Coefficients inequalities in relation to variations in the Coefficient P Longitudinal Mixed Analysis, P social determinants of health. As such, corre- Geographical region NA .243 lations found between the HDI and the se- State Black population (n = 238) 0.65 <.001 .001 lected variables have implications for both Disparities in uninsured percentages (n = 218) 0.1 .124 .008 understanding racial and ethnic health dis- Disparities in high-school drop-out rates (n = 224) –0.09 .203 .466 parities and crafting future minority health Disparities in median household income (n = 204) 0.78 <.001 .074 legislation. State health spending (n = 204) –0.38 <.001 .958 Blacks are 3 times more likely to live in State Medicaid eligibility score (n = 238) 0.18 .006 .779 poverty than are Whites, a remarkable fact when one considers how income signifi- cantly influences health status, access to constitutes another mechanism by which states management. By allowing states to identify health care, and health insurance coverage.19 can track disparities in certain disease pro- disease processes that contribute significantly The positive correlation between the HDI cesses to identify state priorities in addressing to the health disparities burden in their state, and racial disparities in median family disparities. Importantly, each of these condi- specific interventions can be crafted to assist income corroborates studies touting the im- tions can be addressed through better pre- in addressing these inequalities in minority pact of disparities in income on racial health vention, surveillance, and disease communities. inequalities. Additionally, we found a correla- tion between states with the largest Black populations and those having the most racial TABLE 3—Changes Over Study Duration (1999–2005) in Health Disparities health disparity. Notably, the income dispar- Index (HDI) Scores and Selected Variables Among States With the Lowest and ities and Black state population variables, Highest HDI Scores in 1999 themselves, were positively correlated, sup- porting claims of their interrelatedness in State HDI Score HDI Rank Black Population, % Health Insurance Gap, % Income Gap contributing to poor health outcomes. Least disparities We employed the longitudinal mixed Massachusetts model analysis because of the potential for 1999 0.27 1 5.34 6.80 1.76 confounding variables. Not only did it ex- 2005 0.31 1 6.51 8.60 1.81 plicitly model state change in HDI scores Nevada over time, but it also simultaneously and 1999 0.44 2 6.50 NA 1.75 explicitly modeled between- and within-state 2005 0.64 7 8.02 NA 1.53 variation. In discerning the relationship of Oklahoma variables to the HDI over the duration of the 1999 0.46 3 6.38 –0.40 1.82 study, this analysis afforded flexible model- 2005 0.44 2 8.11 9.00 1.55 ing of covariance structure of the repeated Most disparities measures, allowing us to determine whether Maryland variables such as Black percentage of the 1999 1.25 31 27.72 5.50 1.47 population and disparities in income were 2005 0.93 20 29.52 10.60 1.5 confounders or independently associated Pennsylvania with the HDI. 1999 1.33 32 9.60 4.30 1.66 Using the longitudinal mixed model analysis, 2005 1.02 25 10.68 10.80 1.79 we identified correlations between the HDI Illinois and both racial disparities in uninsured per- 1999 1.47 33 14.50 13.40 1.67 centages as well as the state Black population. 2005 1.51 33 15.13 15.40 1.82 Additionally, we noted a statistically insignifi- Notes. NA = not available. Of the 17 states without HDI scores, 16 have Black populations of less than 4%, and represent the cant trend correlating the HDI and racial 16 states with the smallest Black populations. disparities in median household income. The presence of both the correlation for state March 2011, Vol 101, No. 3 | American Journal of Public Health Webb et al. | Peer Reviewed | Research and Practice | 557
  • 5. RESEARCH AND PRACTICE We found no correlation between the HDI and state inclusion of optional eligibility groups in their Medicaid programs. Greater access should not be confused with greater accessibility. For a state’s most vulnerable populations, increasing access without the infrastructural support to increase actual ac- cessibility to quality care will not sufficiently reduce racial health disparities. In a review of comprehensive minority health equity legislation that has been in- troduced into Congress, several trends in policy-based interventions recur. Each bill has called for health disparities research and improving health care quality, and most included provisions to increase access to care, health workforce diversity, and training for cultural competency. Several bills proposed grants for community programming, public health education, and promoting healthy lifestyles. Each intervention is supported by extensive health disparities research and evidence-based recommendations for health disparities solutions. The challenge, how- ever, comes in the prioritization of these interventions and the specification of efforts that constitute best practices in achieving Note: CVD = cardiovascular disease; HDI = health disparities index. Value of 0.00 represents racial/ethnic parity in mortality health equity. rates, while a value of 1.00 represents the average Black–White mortality disparities across the United States. Advisory tools are needed for identifying FIGURE 1—Component disease processes of HDI for a) Massachusetts and b) Illinois. Y-axis specific community program grants that values are HDI scores for each disease process or for state disparities as a whole. legislation should support, as well as the ap- propriate improvements to create quality, ac- cessible care. Using the HDI as a guide, Black population and the trend for disparities our analysis, however, we found no statisti- minority health legislation should focus in income support claims that these variables cally significant correlation between dropout primarily on decreasing the number of are independently related to health disparities rates and the HDI, indicating that this factor uninsured, as well as closing the significant and not merely a function of each other. As alone is not related to health disparities across income gaps that persist between Blacks such, we believe that legislation to eliminate states. and Whites. Furthermore, the preponder- racial health disparities must be accompanied by As a primary reason for escalating health ance of health disparities in states with efforts to address the income disparities that care costs, chronic diseases, such as those larger Black populations indicates that the impact health. composing the HDI, account for more than states with the greatest disparities are also Higher education levels have been linked 75 cents of every dollar spent on health care the states with the largest segment of the to the utilization of preventive services and in the United States.21 Additionally, minority population that would benefit from such longer life. Conversely, the lower rates of health disparities cost $229.4 billion in direct targeted legislative initiatives. The percent- educational attainment documented among medical care expenses between 2003 and age of the population affected in the states Blacks compared with Whites and Asians are 2006.11 In our analysis, state health spending with the most racial health disparity should considered a factor in poor health status.20 was inversely related to racial health disparities encourage legislators to seek to improve With the impact of increased dropout rates in mortality. Although increased spending may minority health on behalf of these individ- unlikely to manifest for many years, these be associated with less mortality, this is not uals, their constituents. values function as an educational snapshot of a sustainable mechanism to combat disparities in For state legislators, the HDI would be the community in comparison with other health care in light of our nation’s economic an effective tool to identify the need for states, allowing us to reasonably extrapolate climate, and current health care trends in disease-specific minority health legislation, as those values to the community as a whole. In spending. well as a mechanism to track the progress in 558 | Research and Practice | Peer Reviewed | Webb et al. American Journal of Public Health | March 2011, Vol 101, No. 3
  • 6. RESEARCH AND PRACTICE decreasing mortality. Federally, the reality national racial health disparities. We chose our Contributors that the Black–White mortality gap has not point of comparison with focus on the unique B. C. Webb originated the study, completed the analysis, led the writing, and supervised all aspects of its imple- improved significantly over the past 4 decades disparities within each state. Even still, we mentation. K. G. Hairston assisted with study design warrants the utilization of the HDI to better recognize that this could understate particu- and oversaw study implementation. S. L. Simpson pro- define this egregious disparity and reliably larly concerning Black mortality rates in states vided statistical support. All authors helped to concep- tualize ideas, interpret findings, and review drafts of the track current and future efforts to close that with higher mortality among Whites as well. article. gap.22 Although this analysis focused on evalu- We were unable to calculate HDI scores ating trends in the social determinants of health, for 17 states because of unreliable mortality Acknowledgments future variables could be increasingly specific to data. Notably, of the states without HDI scores, This research was supported financially by the Student predict the impact that diversifying the physician 16 have Black populations of less than 4% National Medical Association/Pfizer David M. Satcher Research Fellowship. workforce, improving patient lifestyle factors, and are the states with the smallest Black Ronny A. Bell, PhD, Capri G. Foy, PhD, Jaimie Hunter, and increasing funding for community grants populations in the nation. To better elucidate MPH, David L. Mount, PsyD, John H. Stewart IV, MD, would have on the elimination of health dispar- health disparities causation and the most Ashley C. Augustus, MPH, and Orita McCorkle all contributed to creative, analytical, and structural guid- ities. With both state and federal legislation, promising policy solutions, reporting for some ance and support on this project. an understanding of the correlation between primary outcome—be it mortality, incidence, or social determinants and the HDI can effectively prevalence—must be sufficient to reliably evaluate Human Participant Protection serve as a sound basis for legislative initiatives the health status of minority populations in No human participants were involved. using pertinent positive and negative correlations each state. to identify targets for policy intervention up- Finally, we realize that the index proves References stream of the differences in health status among useful in assessing correlation between the 1. Thomson GE, Mitchell F, Williams M. Examining the racial and ethnic minorities. extent of health disparities and the selected Health Disparities Research Plan of the National Institutes of Health: Unfinished Business. Washington, DC: National variables, although it does not assert causation. Academies Press; 2006. Limitations Instead, this analysis can serve 2 other major 2. Smedley BD, Stith AY, Nelson AR, eds. Unequal We used mortality rather than incidence purposes: (1) to track progress in eliminating Treatment: Confronting Racial and Ethnic Disparities in data to construct the HDI. Although health disparities in each state and (2) to Health Care. Washington, DC: National Academies Press; 2002. mortality was selected as a surrogate for dis- identify areas of interest among the social ease severity, many of the interventions to determinants of health and subsequently guide 3. Key health disparities-focused legislation introduced in the 110th Congress [Kaiser Family Foundation Web eliminate health disparities would be meant to future legislation for reducing racial health site]. 2007. Available at: http://www.kff.org/minority prevent disease and might be better modeled disparities. health/7724.cfm. Accessed October 8, 2009. by using incidence if sufficient data for these In conclusion, the HDI serves as a novel and 4. Disparities in health 2010 introduced legislation measures existed in all states. Additionally, useful mechanism to guide legislative efforts for [National Conference of State Legislatures Web site]. a likely time lag exists between variations in the improving minority health. By tracking the 2009. Available at: http://www.ncsl.org/default.aspx? tabid=14298. Accessed October 8, 2009. social determinants of health and resultant extent and distribution of racial health dispar- 5. State profiles: minority health and health equity changes in mortality. Through this analysis, ities, identifying correlated social factors, and offices [National Conference of State Legislatures Web however, we hope to discern how long it would positing potential initiatives to reduce dispar- site]. 2009. Available at: http://www.ncsl.org/default. take for changes in policy to manifest in ities, the HDI displays its great potential utility aspx?TabId= 14299. Accessed October 8, 2009. improvements in HDI scores. in such analyses. Policymakers should strongly 6. Eliminating racial and ethnic health disparities Another limitation was our use of crude consider incorporating this tool to evaluate [Centers for Disease Control and Prevention Web site]. 2009. Available at: http://www.cdc.gov/omhd/About/ mortality rates as opposed to age-adjusted health disparities and strategically plan future disparities.htm. Accessed October 8, 2009. rates. As we were comparing 2 populations legislative initiatives. j 7. Data file documentation, compressed mortality file, with different age structures, it would follow 1999-2005. Hyattsville, MD: National Center for Health that age-adjusted rates could be beneficial. Statistics; 2009. About the Authors Because Whites have an older age distribution Bryant Cameron Webb is an MD candidate at Wake 8. Williams DR, Jackson PB. Social sources of racial than do Blacks, age confounds the relationship Forest University School of Medicine, Winston-Salem, NC, disparities in health. Health Aff (Millwood). 2005;24(2): and a JD candidate at Loyola University Chicago School of 325–334. between race and mortality. Future studies Law, Chicago, IL. Kristen G. Hairston, MD, MPH, is with should consider adjusting the mortality rates 9. US Census Bureau. Current population survey, the Section on Endocrinology and Metabolism at Wake 2008 detailed data tables. Household income 2007. accordingly. Forest University School of Medicine. Sean L. Simpson, Available at: https://www.census.gov. Accessed Octo- Next, our index compares the mortality for PhD, is with the Department of Biostatistical Sciences at ber 17, 2008. Wake Forest University Health Science’s Division of Public Blacks in each state against the mortality of Health Sciences. 10. US Department of Education, Institute of Education Whites within the same state. As such, it does Correspondence should be sent to Bryant Cameron Sciences, National Center for Education Statistics. Total not compare within-state Black mortality to Webb, 973 E 61st St, Apt 1, Chicago, IL 60637 (e-mail: dropout rate by state and race 2000–2001 to 2004– bwebb@wfubmc.edu). Reprints can be ordered at http:// 2005 [statistics from Common Core of Data database]. a national standard for mortality rates, but www.ajph.org by clicking the ‘‘Reprints/Eprints’’ link. Available at: http://nces.ed.gov/ccd. Accessed October 1, rather state racial health disparities against This article was accepted June 21, 2010. 2008. March 2011, Vol 101, No. 3 | American Journal of Public Health Webb et al. | Peer Reviewed | Research and Practice | 559
  • 7. RESEARCH AND PRACTICE 11. US Census Bureau. Census regions and divisions of the United States [US Census Bureau Web Site]. 2009. Available at: http://www.census.gov/geo/www/us_reg div.pdf. Accessed February 27, 2009. 12. Ramirez de Arellano AB, Wolfe SM, Public Citizen Health Research Group. Unsettling scores: a ranking of state Medicaid programs, 2007(Public Citizen Web site). 2007. Available at: http://www.citizen.org/ publications/release.cfm?ID=7516#_ack. Accessed October 10, 2009. 13. LaVeist TA, Gaskin DJ, Richard P. The economic burden of health inequalities in the United States [The Joint Center for Political and Economic Studies Web site]. 2009. Available at: http://www.jointcenter.org/ publications_recent_publications/health/the_economic_ burden_of_health_inequalities_in_the_united_states. Accessed November 6, 2009. 14. Compressed mortality file 1979-2007 [Centers for Disease Control and Prevention Web site]. Available at: http://wonder.cdc.gov/wonder/help/cmf.html. Accessed December 9, 2010. 15. National Healthcare Disparities Report, 2003. Full Report [Agency for Healthcare Research and Quality Web site]. 2003. Available at: http://www.ahrq.gov/ qual/nhdr03/fullreport/index.html. Accessed November 9, 2009. 16. National Healthcare Disparities Report, 2004. Full Report [Agency for Healthcare Research and Quality Web site]. 2004. Available at http://www.ahrq.gov/ qual/nhdr04/fullreport/Index.htm. Accessed November 9, 2009. 17. National Healthcare Disparities Report, 2005. Full Report [Agency for Healthcare Research and Quality Web site]. 2005. Available at: http://www.ahrq.gov/ qual/nhdr05/fullreport/Index.htm. Accessed November 9, 2009. 18. Nathan-Pulliam S, Hussein CA. Addressing health care disparities: promising practices in Maryland [Mary- land Department of Health and Mental Hygeine Web site]. 2004. Available at: http://www.dhmh.state.md.us/ hd/presentations/APHA.ppt. Accessed November 9, 2009. 19. Income, poverty, and health insurance coverage in the United States: 2005 [US Census Bureau Web site]. 2005. Available at: http://www.census.gov/prod/ 2006pubs/p60-231.pdf. Accessed November 9, 2009. 20. Stoops NA. Half-century of learning: historical Census statistics on educational attainment in the United States, 1940 to 2000 [US Census Bureau Web site]. 2007. Available at: http://www.census.gov/population/ www/socdemo/education/introphct41.html. Accessed October 10, 2009. 21. Majestic E. Public health’s inconvenient truth: the need to create partnerships with the business sector [Centers for Disease Control and Prevention Web site]. 2009. Available at: http://www.cdc.gov/pcd/issues/ 2009/apr/08_0236.htm. Accessed November 6, 2009. 22. Satcher D, Fryer GE Jr, McCann J, Troutman A, Woolf SH, Rust G. What if we were equal? A comparison of the Black-White mortality gap in 1960 and 2000. Health Aff (Millwood). 2005;24(2):459–464. 560 | Research and Practice | Peer Reviewed | Webb et al. American Journal of Public Health | March 2011, Vol 101, No. 3