Grouping & Summarizing Data in R
•
64 gostaram•105,279 visualizações

Overview of a few ways to group and summarize data in R using sample airfare data from DOT/BTS's O&D Survey. Starts with naive approach with subset() & loops, shows base R's tapply() & aggregate(), highlights doBy and plyr packages. Presented at the March 2011 meeting of the Greater Boston useR Group.

Recomendados
Mais conteúdo relacionado
Destaque
Destaque (20)
Semelhante a Grouping & Summarizing Data in R
Semelhante a Grouping & Summarizing Data in R (20)
Último
Último (20)
Grouping & Summarizing Data in R
- 1. useR Vignette: Grouping & Summarizing Data in R Greater Boston useR Group March 3, 2011 by Jeffrey Breen jbreen@cambridge.aero Photo: http://flic.kr/p/5HHnRN
- 2. Outline ● Overview ● Sample data: airfares ● A few options ● Be naïve: subset() ● Use a loop ● tapply() ● aggregate() ● doBy's summaryBy() ● plyr's ddply() ● more more more... useR Vignette: Grouping & Summarizing Data in R Greater Boston useR Meeting, March 2011 Slide 2
- 3. Overview: group & summarize data ● Very common to have detail-level data from which you need summary-level statistics based on some grouping variable or variables ● Sales by region, market share by company, discount and margin by product line and rep, etc. ● Hadley Wickham coined term “split-apply- combine” to describe this analysis pattern ● c.f. SQL's “GROUP BY”, SAS has “by”, MapReduce ● There's more than one way to do it in R ● Often discussed on StackOverflow.com &c. useR Vignette: Grouping & Summarizing Data in R Greater Boston useR Meeting, March 2011 Slide 3
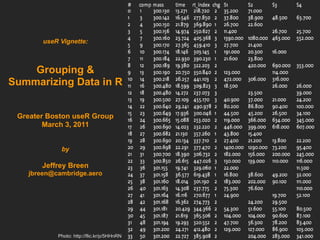
- 4. Sample data: BOS-NYC airfares Individual airfares paid from Boston Logan (BOS) to New York City airports (EWR, JFK, LGA) last year: > nrow(df) [1] 1852 > head(df) Origin Dest Carrier Fare 1 BOS EWR CO 56.32 2 BOS EWR 9L 0.00 3 BOS EWR CO 102.00 4 BOS EWR CO 109.00 5 BOS EWR CO 130.00 6 BOS EWR CO 147.50 > tail(df) Origin Dest Carrier Fare 1847 BOS LGA DL 208.87 1848 BOS LGA DL 223.79 1849 BOS LGA US 100.46 1850 BOS LGA UA 125.89 1851 BOS LGA US 167.63 1852 BOS LGA US 186.68 > unique(df$Dest) [1] "EWR" "JFK" "LGA" useR Vignette: Grouping & Summarizing Data in R Greater Boston useR Meeting, March 2011 Slide 4
- 5. Naïve approach – split by hand > ewr = subset(df, Dest=='EWR') > jfk = subset(df, Dest=='JFK') > lga = subset(df, Dest=='LGA') > # counts: > nrow(ewr) [1] 392 > nrow(jfk) [1] 572 > nrow(lga) [1] 888 > # averages: > mean(ewr$Fare) [1] 267.6365 > median(ewr$Fare) [1] 210.85 > mean(jfk$Fare) [1] 147.3658 > median(jfk$Fare) [1] 113.305 > mean(lga$Fare) [1] 190.2382 > median(lga$Fare) [1] 171 useR Vignette: Grouping & Summarizing Data in R Greater Boston useR Meeting, March 2011 Slide 5
- 6. Automating naïveté with a loop results = data.frame() for ( dest in unique(df$Dest) ) { tmp = subset(df, Dest==dest) count = nrow(tmp) mean = mean(tmp$Fare) median = median(tmp$Fare) results = rbind(results, data.frame(dest, count, mean, median) ) } > results dest count mean median 1 EWR 392 267.6365 210.850 2 JFK 572 147.3658 113.305 3 LGA 888 190.2382 171.000 Rule of Thumb: if you're using a loop in R, you're probably doing something wrong useR Vignette: Grouping & Summarizing Data in R Greater Boston useR Meeting, March 2011 Slide 6
- 7. Base R's tapply() Applying functions repeatedly sounds like a job for Base R's *apply() functions: > tapply(df$Fare, df$Dest, FUN=length) EWR JFK LGA 392 572 888 > tapply(df$Fare, df$Dest, FUN=mean) EWR JFK LGA 267.6365 147.3658 190.2382 > tapply(df$Fare, df$Dest, FUN=median) EWR JFK LGA 210.850 113.305 171.000 I'm honestly not thrilled with the output format, but I'm sure we could wrestle into a data.frame which includes the grouping variable thanks to the names() function. useR Vignette: Grouping & Summarizing Data in R Greater Boston useR Meeting, March 2011 Slide 7
- 8. Base R's aggregate() > aggregate(Fare~Dest, data=df, FUN="mean") Dest Fare 1 EWR 267.6365 2 JFK 147.3658 3 LGA 190.2382 > aggregate(Fare~Dest, data=df, FUN="median") Dest Fare 1 EWR 210.850 2 JFK 113.305 3 LGA 171.000 > aggregate(Fare~Dest, data=df, FUN="length") Dest Fare 1 EWR 392 2 JFK 572 3 LGA 888 ● data.frame in, data.frame out (works for time series ts, mts too) ● Uses formula notation & data.frame environment aware (no $'s) useR Vignette: Grouping & Summarizing Data in R Greater Boston useR Meeting, March 2011 Slide 8
- 9. doBy package's summaryBy() More capable and simpler (at least for me) ● Accepts formula to access multiple columns for values and groupings ● Accepts anonymous functions which can use c() to perform multiple operations ● doBy package also provides formula-based lapplyBy() and my favorite sorting function, orderBy() > summaryBy(Fare~Dest, data=df, FUN=function(x) c(count=length(x), mean=mean(x), median=median(x))) Dest Fare.count Fare.mean Fare.median 1 EWR 392 267.6365 210.850 2 JFK 572 147.3658 113.305 3 LGA 888 190.2382 171.000 useR Vignette: Grouping & Summarizing Data in R Greater Boston useR Meeting, March 2011 Slide 9
- 10. Hadley Wickham's plyr package ● Provides a standard naming convention: ● X + Y + “ply” – X = input data type – Y = output data type – Types: ● “a” = array ● “d” = data.frame ● “l” = list ● “m” = matrix ● “_” = no output returned ● Example: ddply() expects and returns a data.frame ● Most plyr functions wrap other plyr, Base functions useR Vignette: Grouping & Summarizing Data in R Greater Boston useR Meeting, March 2011 Slide 10
- 11. ddply() in action Like summaryBy(), can use multiple-part grouping variables and functions > ddply(df, 'Dest', function(x) c(count=nrow(x), mean=mean(x$Fare), median=median(x$Fare))) Dest count mean median 1 EWR 392 267.6365 210.850 2 JFK 572 147.3658 113.305 3 LGA 888 190.2382 171.000 > ddply(df, c('Dest', 'Carrier'), function(x) c(count=nrow(x), mean=mean(x$Fare), median=median(x$Fare))) Dest Carrier count mean median 1 EWR 9L 33 181.9697 131.500 2 EWR CO 326 279.7623 264.250 3 EWR XE 33 233.5152 152.500 4 JFK AA 6 129.6600 140.120 5 JFK B6 112 132.2796 108.245 [...] useR Vignette: Grouping & Summarizing Data in R Greater Boston useR Meeting, March 2011 Slide 11
- 12. “Are we there yet?” Good news: plyr provides “.parallel” & “.progress” bar options for long-running jobs > ddply(df, 'Dest', function(x) c(count=nrow(x), mean=mean(x$Fare), median=median(x$Fare)), .progress='text') |==============================================================================| 100% Dest count mean median 1 EWR 392 267.6365 210.850 2 JFK 572 147.3658 113.305 3 LGA 888 190.2382 171.000 Bad news: you may need them ● Has been getting faster, major work planned for summer 2011 (Hadley's goal: “as fast as data.table” !) ● “immutable” idata.frame in plyr 1.0 can help now ● Great speed & alternatives discussion: http://stackoverflow.com/questions/3685492/r-speeding-up-group-by-ope useR Vignette: Grouping & Summarizing Data in R Greater Boston useR Meeting, March 2011 Slide 12
- 13. Other options & approaches ● Loops that don't (necessarily) suck: foreach ● Works with parallel backends (SMP, MPI, SNOW, etc.) ● Have data in a database? ● DBI & friends to access and group (RMySQL, RPostgresSQL, ROracle, RJDBC, RODBC, etc.) ● For MySQL, Postgres, look at dbApply() to aggregate ● sqldf will create a temporary database for you ● Data > Memory? http://www.bigmemory.org/ ● or just use Hadoop for everything: RHIPE useR Vignette: Grouping & Summarizing Data in R Greater Boston useR Meeting, March 2011 Slide 13
- 14. References and further reading ● StackOverflow.com discussions (has an active “[r]” tag for searching) ● “for each group summarise means for all variables in dataframe (ddply? Split?)” – http://stackoverflow.com/questions/1407449/for-each-group-summarise-means-for-all-variable ● “How to split a data frame by rows, and then process the blocks?” – http://stackoverflow.com/questions/1395191/how-to-split-a-data-frame-by-rows-and-then-proce ● “R Grouping functions: sapply vs. lapply vs. apply. vs. tapply vs. by vs. aggregate vs. …” – http://stackoverflow.com/questions/3505701/r-grouping-functions-sapply-vs-lapply-vs-apply-vs ● “how to aggregate this data in R” – http://stackoverflow.com/questions/2900058/how-to-aggregate-this-data-in-r ● JD Long: A Fast intro to Plyr ● http://www.cerebralmastication.com/2009/08/a-fast-intro-to-plyr-for-r/ ● Kane & Emerson: “Scalable Strategies for Computing with Massive Data: The Bigmemory Project” ● http://www.slideshare.net/joshpaulson/big-memory useR Vignette: Grouping & Summarizing Data in R Greater Boston useR Meeting, March 2011 Slide 14