Frederick Rental Housing Report Analyzes Code Enforcement Data
•Transferir como DOC, PDF•
0 gostou•282 visualizações

Report presented to Mayor and Board of Alderman in Frederick, MD

Recomendados
Recomendados
Mais conteúdo relacionado
Semelhante a Frederick Rental Housing Report Analyzes Code Enforcement Data
Semelhante a Frederick Rental Housing Report Analyzes Code Enforcement Data (20)
Último
Último (20)
Frederick Rental Housing Report Analyzes Code Enforcement Data
- 1. OVERVIEW The City of Frederick has for many years sought to address public concerns associated with overcrowding in rental properties across the city. An analysis of Code Enforcement (CE) and Maryland Department of Assessments & Taxation (SDAT) data shows that nearly three-fourths (74.43%) of all cases associated with overcrowding involve owner occupied homes. 25.57% involve non-owner occupied, or rental, properties. Additional Code Enforcement data indicates there have been 262 violations associated with overcrowding since 20071 . Just over half of which (50.8%) have occurred inside the area known as Neighborhood Advisory Council, or NAC, 8. Year-over-year totals find that cases designated as overcrowding increased 38% from 2008-09 when 80 cases were filed with CE. In 2010, cases are on track to meet or fall slightly lower than 2009 totals. These findings affirm general speculations that NAC 8 contains the majority of overcrowding cases and that the distribution of rental cases versus owner occupied cases, tips heavily towards owner occupied properties. Looking beyond the slice of code violations associated with overcrowding, however, many public and private stakeholders question the current state of Frederick’s rental housing market. This report seeks to answer, or at least provide clarity, on such questions. Other findings include: • According to State tax data, non-owner occupied (rental) properties account for 15.5% of the total properties in the City of Frederick. Meanwhile, Census data suggests over 41% of housing units in the City are rental • Rental properties account for 42% of PMC violations in the City of Frederick, since 2007 • Of the nearly 6,600 cases of trash, weeds and abandoned vehicles2 reported across all properties in the City of Frederick, more than 2,000 of these cases (30.44%) occur on rental properties • NACs 5, 8 and 11 show the highest percentage of rental PMC and CC violations • The average PMC case involving rental properties takes Code Enforcement fifty- six (56) days to close • Data suggests nearly 70% more time is spent on enforcing “internal” PMC codes than external PMC codes • Approximately $11,000 has been collected in municipal citations for CC and PMC violations since 2007 ABOUT THIS REPORT Maps and datasets were compiled using Code Enforcement data, Navaline; City of Frederick Geographic Information System (GIS) shape files and data; and Maryland State Department of Assessments & Taxation data. Information compilation and analysis uses data spanning from 2007 through approximately June 2010. Methodologies on map overlays and property matching are described at the end of this report. 1 PMC 018, 019, 030 and 034 were identified by code officials as being associated with overcrowding cases 2 These represent City Codes 001, 002 and 003; “CC violations” or “CC NOVs” referenced later in this report also refer only to these 3 codes City of Frederick, Office of the Mayor Rental Housing Market | 1
- 2. AUTHOR’S NOTE One of the key goals of this report was to turn stories into numbers and pictures into information. While the data, charts, maps and graphs attempt to understand the various components and conditions in Frederick’s rental housing market, it is important to note that these findings represent a small glimpse of the true, but unknown, reality of housing in the City. At 60,000+ residents, the City of Frederick has a multifaceted housing ecosystem of single-family homes, urban renters, townhomes, condominiums, apartment complexes, public housing, long-term hotel guests, and so on. It also has a number of vacant properties, squatter homes, foreclosures, and newly-converted rental homes waiting to be sold as single-family homes. Along with help from Code Enforcement, GIS and others, I worked hard to ensure accuracy and completeness. This is a data-heavy document and the fine edges may not line up exactly. I have no doubt that differing conclusions will be drawn from these findings. And, in part, that is the point to embarking on these kinds of projects – to get the conversation going. There is a tremendous amount of information contained within this report, most of which could easily turn into another, separate examination entirely. But be assured this report was constructed with the intentions of providing a representative picture of a complicated subject. Just as important as the information conveyed in maps, charts, tables and graphs, is the information not being captured through current processes and current policies. Frederick Police Department data, population demographic information, Land Management Code violations and over thirty categories of City Code violations were purposely omitted in order to convey a simple, yet indicative picture of Frederick’s housing ecosystem. But there can be little doubt that more remains to be found when examining this issue. City of Frederick, Office of the Mayor Rental Housing Market | 2
- 3. Part One: External Violations According to Code Enforcement, their mission is to minimize threats to the health, safety and welfare of Frederick City residents posed by deficiencies in property maintenance. They are worried about neighborhood-level issues and issues that if left unresolved could spill into areas beyond the physical boundaries of the property. Code Enforcement follows a set of codes that speak to many aspects of health and safety within residential and commercial structures. Chief among them, for the purposes of this report, are City Codes 001, 002 and 003; and the nearly thirty Property Maintenance Codes regularly cited by Code Enforcement – although particular attention should be paid to PMC 001, 009, 013 and 019. Together these codes represent a wide array of violation types and potential threats to human welfare. When assessing how to begin to understand the relationship between Code Enforcement and the City’s housing market, I started with the most common violations – external violations. External violations vary according to location within the City. But according to the Department balance sheet and staff accounts, trash and weeds make up the bulk of what Code Enforcement sees citywide. Records indicate that 6,596 violations have occurred since 2007 involving trash, weeds, and abandoned vehicles. Filth, Rubbish, Weeds & Abandoned Vehicle Violations 2007 -2010 City of Frederick, Office of the Mayor Rental Housing Market | 3 Table 1 NAC NOVs Percent 1 178 2.7% 2 0 0.0% 3 891 13.5% 4 91 1.4% 5 1197 18.1% 6 306 4.6% 7 427 6.5% 8 1491 22.6% 9 236 3.6% 10 778 11.8% 11 781 11.8% 12 220 3.3% Total 6596 100.0%
- 4. Filth, Rubbish, Weeds and Abandoned Vehicle NOVs by NAC 0 200 400 600 800 1000 1200 1400 1600 1 2 3 4 5 6 7 8 9 10 11 12 NAC NumberofNOVs NOVs n=6596 Figure 1 As indicated by Table 1 and corresponding Figure 1, City Code violations 001, 002 and 003 are concentrated in NACs 8, 5 and 3; although all areas (save for Ft. Dietrich in NAC 2) have received at least 90 notices in the last two-and-a-half years. And the middle fourth of the distribution (2nd Quartile) is over 100 violations per year at 366 violations since 2007. Geographically represented across a map of the City of Frederick (page 5), one gets a better sense of how widespread these kinds of violations are. What remains unknown, just by looking at these numbers, is how many correspond to rental properties. For that, we must interject a new data component – tax IDs. City of Frederick, Office of the Mayor Rental Housing Market | 4
- 5. City of Frederick, Office of the Mayor Rental Housing Market | 5
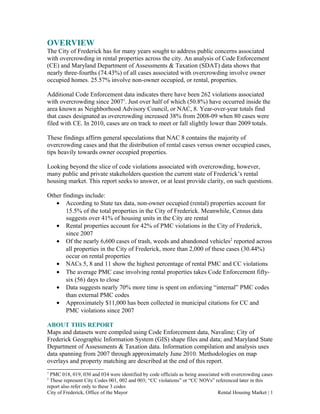
- 6. (Map 1: Filth, Rubbish, Weeds & Abandoned Vehicle Violations, 2007-2010) Part One Continued: Rental Property Component To understand which of the thousands of points represented on Map 1 are rental properties and which ones are owner occupied, Maryland Department of Assessments & Taxation (SDAT) data had to be joined with CE data. By introducing tax IDs and associated assessment information, we were able to determine which properties were designated as residential, commercial, and industrial. The same data allowed us to drill down further to understand which residential properties were owner occupied, ‘H’, and which ones were non-owner occupied, ‘N’, also known as, rental properties.3 When parsing the CC violations for just those residential properties that are not owner occupied, we find 2,008 notices of violation have been issued since 2007. Filth, Rubbish, Weeds & Abandoned Vehicle Violations 2007 -2010 (Residential, Non-owner Occupied) NAC NOVs Percent 1 45 2.2% 2 0 0.0% 3 218 10.9% 4 11 0.5% 5 357 17.8% 6 142 7.1% 7 122 6.1% 8 351 17.5% 9 79 3.9% 10 229 11.4% 3 ‘H’ and ‘N’ designations correspond to codes in the dataset used to compile this information. The dataset will be made available upon request City of Frederick, Office of the Mayor Rental Housing Market | 6 Table 2
- 7. 11 383 19.1% 12 71 3.5% Total: 2008 100.0% Filth, Rubbish, Weeds & Abandoned Vehicle NOVs by NAC 2007-2010 (Residential, Non-owner Occupied) 0 50 100 150 200 250 300 350 400 450 1 2 3 4 5 6 7 8 9 10 11 12 NAC NumberofNOVs NOVs n=2008 Figure 2 The distribution of CC NOVs across rental properties in the City of Frederick seems to mirror the citywide distribution (which includes owner occupied properties), except for one striking difference: NAC 114 . When isolating rental properties, NAC 11 ranks first in percentage of CC violations (19.1%); it ranked 5th in the citywide distribution (11.8%). This, again, affirms the notion that NAC 11, which represents a large section of Market and Patrick Streets, has a high concentration of rental properties. In just under three years, NAC 11 rental properties received nearly one-fifth (383) of all rental CC violations. 4 In the course of cleansing state and local data, a limited number of fields were lost that would, in all likelihood, add more CC NOVs to NAC 11. Estimates suggest that number could bring NAC 11 totals to up near 400 cases since 2007. City of Frederick, Office of the Mayor Rental Housing Market | 7
- 8. To get a sense of how similar the citywide and rental-only distributions look geographically, refer to Map 2 on the next page. The rental component of CC violations is certainly a less-dense version of the citywide Map 1. But there are few parts of the city untouched by this, perhaps the most visible, of City Codes. City of Frederick, Office of the Mayor Rental Housing Market | 8
- 9. (Map 2: Filth, Rubbish, Weeds & Abandoned Vehicle Violations, 2007-2010, Residential, Non-owner Occupied) Part Two: Internal Violations & Rental Properties To understand what fraction of code enforcement is concerned with internal violations versus external violations, all one must do is look at sections of the City Code dealing with Property Maintenance. The vast majority of sections deal with light, ventilation, occupancy, plumbing, electrical and fire safety requirements – which are mainly concerns within a structure’s interior. Still, there are two kinds of Property Maintenance Codes (PMCs): externally and internally oriented. An example of an externally oriented PMC code would be Roof and Drainage or Exterior Walls. By contrast, internally oriented PMC codes include Infestation, Ventilation and Means of Egress. According to data provided by Code Enforcement, 1,023 PMC violations have been issued since 2007. Rental properties account for 42.1% of those violations (431). PMC violations can be for any of the thirty-seven code descriptions found in this report’s Appendix B. But CE data suggest only twenty-seven of the thirty-eight code categories are used. For the purposes of this report, all twenty-seven categories of violations cited by CE since 2007 were examined. Breakdown of PMC Cases by Category, Occurring on Rental Property City of Frederick, Office of the Mayor Rental Housing Market | 9
- 10. PMC Cases by Code Category 0 20 40 60 80 100 IPMC 001 IPMC 002 IPMC 004 IPMC 005 IPMC 006 IPMC 007 IPMC 008 IPMC 009 IPMC 010 IPMC 011 IPMC 013 IPMC 015 IPMC 018 IPMC 019 IPMC 020 IPMC 021 IPMC 022 IPMC 023 IPMC 024 IPMC 025 IPMC 026 IPMC 029 IPMC 030 IPMC 034 IPMC 035 IPMC 036 IPMC 037 PMCCode Number of Violations Total Cases n=431 Figure 3 Notable codes by number of cases include, Exterior (IPMC001), Interior (General) (IPMC009), Overcrowding (IPMC019) and Roof and Drainage (IPMC005). These four categories are responsible for 58% of all PMC violations cited against rental properties. Processing Time of Rental PMC Cases by Category Table 3 Violation Code Description Total Cases Mean Days Median Days IPMC 001 Exterior 94 144 97 IPMC 002 Premise Identification 8 10 7 IPMC 004 Exterior Walls 8 123 53 IPMC 005 Roof and Drainage 55 43 29 IPMC 006 Porches, Stairways and Decks 2 45 45 IPMC 007 Windows, Skylights and Doors 16 44 49 IPMC 008 Insect screens 2 82 82 IPMC 009 Interior (general) 75 56 35 IPMC 010 Handrails and Guardrails 5 57 42 IPMC 011 Rubbish and Garbage (INT & EXT) 4 10 8 IPMC 013 Infestation (Extermination) 41 48 34 IPMC 015 Ventilation 1 221 221 IPMC 018 Occupancy Lim. (bedroom) 9 42 27 City of Frederick, Office of the Mayor Rental Housing Market | 10
- 11. IPMC 019 Overcrowding 59 104 69 IPMC 020 Plumbing 10 13 7 IPMC 021 Storm Drainage 5 148 45 IPMC 022 Electrical Facilities 11 109 40 IPMC 023 Elevators 1 96 96 IPMC 024 Vacant Structures & Land 2 30 30 IPMC 025 Sanitation (Exterior) 3 19 14 IPMC 026 Grading & Drainage 3 55 37 IPMC 029 Swimming Pool Enclosure 1 19 19 IPMC 030 Means of Egress 2 218 218 IPMC 034 Smoke alarm 1 24 24 IPMC 035 Unsafe Structure 10 136 57 IPMC 036 Unsafe Equipment 1 26 26 IPMC 037 Unfit Structure 2 91 91 Total 431 Average 75 56 While examining PMC violations listed in Table 3, the average case takes 75 days to resolve5 . The median number of days to close the average PMC case is still almost two months (56 days). According to CE standard operating procedure, it should be noted, most violations are given a window of thirty days to take corrective action. To see a visual representation of CE SOP, refer to Appendix B of this report. INTERNAL CASES Total Cases Median Days 224 69 Table 4 EXTERNAL CASES Total Cases Median Days 207 41 Table 5 The median time it takes to close an internal PMC case is roughly 69 days. To resolve an external PMC case, the median time is 41 days. This means that generally, it takes 68% more time to close an internal PMC case than an external case. Part Two Continued: Large Apartment Complexes According to Census Bureau data,6 the City of Frederick has 24,201 housing units, of which 10,138 are rental units. In other words, 41.8% of all Frederick housing units are 5 Given the wide disparity between processing times among the category averages (10 days to 221 days) and the amount of cases per category (1 case to 94), a more befitting measure of central tendency is the median 6 Census Bureau “2006-2008 American Community Survey 3-Year Estimates” http://factfinder.census.gov/servlet/ADPTable?_bm=y&-geo_id=16000US2430325&- qr_name=ACS_2008_3YR_G00_DP3YR4&-ds_name=ACS_2008_3YR_G00_&-_lang=en&-_sse=on viewed Aug. 12, 2009 City of Frederick, Office of the Mayor Rental Housing Market | 11
- 12. rental. This is not the same as rental properties, however. SDAT data indicates there are roughly 3,600 tax IDs associated with rental properties in Frederick. To put this in prospective, a 2000 study by the City Planning Department7 found that twenty-four (24) apartment complexes accounted for 5,209 rental units. Otherwise stated, 51% of the City’s rental units can be found in 0.6% of the tax IDs associated with rental properties. Map 3 (on page 12) indicates where these and other known complexes are located, while overlaying this data with PMC violations occurring on non-owner occupied, residential properties. Although unit numbers are not known on all the areas highlighted in orange, the map helps show that PMC cases are not confined to, nor free from, large complexes. According to analysis using SDAT, Planning and CE data, sixty-two (62) PMC violations have occurred on twenty (20) complexes (that have over 50 or more units) since 2007. Four (4) CC violations have been recorded on properties containing more than 50 units during the same time. So while violations have been cited at multi-unit apartment complex properties, 15% of PMC cases and less than 0.3% of CC cases can be attributed to complex properties with 50 units or more. 7 See Appendix C City of Frederick, Office of the Mayor Rental Housing Market | 12
- 13. (Map 3: Known Apartments & IPMC Cases, 2007 - 2010) Part Three: Methodology The purpose of this report was to answer simple questions about the City’s rental property market by joining previously disparate data points. This report relied heavily on state tax IDs as a way to parse, cleans and compare data. SDAT data contains over 100 columns of descriptive information per case, so it can be used in multiple ways. Generally, tables and figures were constructed by joining Navaline database information, used to track Code Enforcement cases, with SDAT information, based on tax identification numbers. This information was then used in conjunction with GIS software to construct the maps. When references are made to non-owner occupied tax IDs or properties, those “violations” or “cases” (either PMC or CC) are linked to properties, through SDAT data, given a land use designation of Apartments, Residential, Residential Commercial, Residential Condominium or Town House. In some instances additional land use designations were used, when additional steps were taken to verify the subject (residential or commercial) of a case or violation. Note: Irregularities can occur when using SDAT data, but precaution is taken to explain differences in totals or more granular subtotals. Some cases linked to properties without tax IDs, like HOAs, right-of-way, etc. were omitted from this report. However, these cases represent less than 1 percent of all cases examined. City of Frederick, Office of the Mayor Rental Housing Market | 13
- 14. City of Frederick, Office of the Mayor Rental Housing Market | 14