SlideShare uma empresa Scribd logo
1 de 8
1/21/13
Towns        Active     Pending   Absorption   New          Net Gain    Listings     % of Invent.   Expired    W/drawn    Closed
             Listings   in Last   Rate in      Listings     (Loss) to   Reduced      Reduced        Listings   Listings   Listings
                        30 Days   Months       in 30 Days   Market      in 30 Days

West
Windsor:     55         6         9.2          10           4           6            10.9%          8          2          15
All Styles

West
Windsor      11         1         11.0         5            4           1            9.1%           1          1          5
Condo/
T.Houses

West
Windsor      8          1         8.0          1            0           _            _              0          0          0
55+

West
Windsor      36         4         9.0          4            0           5            13.9%          7          1          10
Single
Family


Lawrence:
All Styles   120        6         20.0         19           13          10           8.3%           11         4          13
Lawrence:
Condo/       39         3         13.0         5            2           5            12.8%          2          0          0
THouses

Lawrence:
55+          9          1         9.0          2            1           _            _              1          0          0
Lawrence:
Single       72         2         36.0         12           10          5            6.9%           8          4          13
Family
1/21/13
Towns        Active     Pending   Absorption   New           Net      Listings   % of      Expire    W/drawn    Closed
             Listings   in Last   Rate in      Listings in   Gain     Reduced    Invent.   d         Listings   Listings
                        30 Days   Months       30 Days       (Loss)   in 30      Reduced   Listing
                                                             to       Days                 s
                                                             Market


Plainsboro
All Styles

Plainsboro
Condo/
THouses

Plainsboro
55+

Plainsboro
Single
Family


Cranbury:
All Styles
1/21/13
Towns        Active     Pending   Absorption   New           Net Gain    Listings     % of      Expired    W/drawn    Closed
             Listings   in Last   Rate in      Listings in   (Loss) to   Reduced in   Invent.   Listings   Listings   Listings
                        30 Days   Months       30 Days       Market      30 Days      Reduced


Ewing:
All Styles
              196         14         14            27          13           31          16%       16          6         13
Ewing :
Condo/
               28         3           9             5           2            6          21%        1          4          1
T.Houses

Ewing
55+:
                8         1           8             2           1           ---          ---       0          0          0
Ewing:
Single
              160         10         16            20          10           25          15%       15          2         12
Family


East
Windsor:
              143         9          16            26          17           18          13%       10          2         13
All Styles

East
Windsor:
               87         5          17            16          11           13          15%        7          1          9
Condo/
Thouses

East
Windsor:
                8         0         999             1           1           ---          ---       0          0          3
55+

East
Windsor:
               48         4          12             9           5            5          10%        3          1          1
Single
Family
1/21/13
Towns            Active     Pending   Absorption   New           Net Gain    Listings     % of      Expired    W/drawn    Closed
                 Listings   in Last   Rate in      Listings in   (Loss) to   Reduced in   Invent.   Listings   Listings   Listings
                            30 Days   Months       30 Days       Market      30 Days      Reduced

Hopewell
Twp.             103        5         20.6         14            9           10           9.7%      11         8          7
All Styles

Hopewell
Twp. Condo/      5          0         99           1             1           1            20%       2          1          1
T.Houses

Hopewell
Twp.:            1          0         99           0             0           --           --        0          0          1
55+

Hopewell Twp
Single Family    97         5         19.4         13            8           9            9.3%      9          7          5


                 388        27        14.4         57            30          66           17%       26         15         33
Hamilton: All
Styles


                 80         6         13.3         10            4           17           21.3%     4          3          6
Hamilton:
Condo/ THouses


                 21         0         99           7             7           --           --        1          1          2
Hamilton:
55+


                 287        21        13.7         40            19          49           17.1%     21         11         25
Hamilton:
Single Family
1/21/13

Towns           Active    Pending   Absorption   New        Net Gain    Listings     % of      Expired    W/drawn    Closed
                Listing   in Last   Rate in      Listings   (Loss) to   Reduced      Invent.   Listings   Listings   Listings
                          30 Days   Months       in 30      Market      in 30 Days   Reduced
                                                 Days


                61        10        6            6          (4)         12           20%       11         5          13
Robbinsville
All Styles


                32        6         5            3          (6)         6            19%       6          2          7
Robbinsville
Condo/
T.Houses


                29        4         7            3          (1)         6            21%       5          3          6
Single Family


                51        3         17           6          3           11           22%       6          0          4
Hightstown
Boro: All
Styles


                15        1         15           2          1           2            13%       2          0          4
Pennington


                6         3         2            1          (2)         4            67%       0          2          1
Hopewell Boro
1/21/13

Towns        Active     Pending   Absorption   New           Net Gain    Listings   % of      Expired    W/drawn    Closed
             Listings   in Last   Rate in      Listings in   (Loss) to   Reduced    Invent.   Listings   Listings   Listings
                        30 Days   Months       30 Days       Market      in 30      Reduced
                                                                         Days


             106        7         15.1         10            3           11         10.4% 8              7          21
Princeton:
All Styles


             31         1         31           3             2           3          9.7%      3          1          4
Princeton:
Condo/
Thouses


             75         6         12.5         7             1           8          10.7% 5              6          17
Princeton:
Single
Family
1/21/13
Towns           Active     Pending   Absorption   New           Net Gain    Listings     % of      Expired    W/drawn    Closed
                Listings   in Last   Rate in      Listings in   (Loss) to   Reduced      Invent.   Listings   Listings   Listings
                           30 Days   Months       30 Days       Market      in 30 Days   Reduced


South
Brunswick       154        6         25           18            12          14           1         34         3          36
All Styles

South
BrunswickCon
do/ T.Houses
                50         3         16           7             4           7            14        11         0          9
South
Brunswick       34         0         99           1             1           5            17        1          1          3
55+

South
Brunswick       70         3         22           10            7           2            3         22         2          24
Single Family


Monroe:
All Styles      396        22        18           80            58          24           6         48         4          63
Monroe:
55+             262        19        13           61            42          17           6         28         2          50
Monroe:
Single Family   134        3         44           19            16          7            5         20         2          13
1/21/13
Towns           Active     Pending   Absorption   New           Net Gain    Listings     % of      Expired    W/drawn    Closed
                Listings   in Last   Rate in      Listings in   (Loss) to   Reduced      Invent.   Listings   Listings   Listings
                           30 Days   Months       30 Days       Market      in 30 Days   Reduced


                86         23        3.3          20            -3          11           13%       14         6          11
Montgomery
All Styles


                11         4         2.7          6             +2          1            9%        3          2          2
Montgomery
Condo/Twnhms


                75         19        3.9          14            -5          10           13%       11         4          9
Single Family


                169        22        7.7          41            +19         22           13%       16         8          16
Hillsborough
All Styles


                66         8         8.2          20            +12         10           15%       8          5          9
Hillsborough
Condo/Twnhms


                103        14        7.3          21            +7          12           13%       8          3          7
Hillsborough
Single Family

Mais conteúdo relacionado

Semelhante a Stat 1 21-13

Semelhante a Stat 1 21-13 (18)

Mercer County Real Estate Market Update Feb 2010
Mercer County Real Estate Market Update Feb 2010Mercer County Real Estate Market Update Feb 2010
Mercer County Real Estate Market Update Feb 2010
 
Sales May 2010
Sales May 2010Sales May 2010
Sales May 2010
 
Forsale
ForsaleForsale
Forsale
 
Princeton Area Real Estate Stats October 25th
Princeton Area Real Estate Stats October 25thPrinceton Area Real Estate Stats October 25th
Princeton Area Real Estate Stats October 25th
 
Stats 7 12-10
Stats 7 12-10Stats 7 12-10
Stats 7 12-10
 
Town Stats January 2012
Town Stats January 2012Town Stats January 2012
Town Stats January 2012
 
Princeton Real Estate Stats 9/6/2011
Princeton Real Estate Stats 9/6/2011Princeton Real Estate Stats 9/6/2011
Princeton Real Estate Stats 9/6/2011
 
Stats 7 5-10
Stats 7 5-10Stats 7 5-10
Stats 7 5-10
 
Princeton, NJ Market Report
Princeton, NJ Market ReportPrinceton, NJ Market Report
Princeton, NJ Market Report
 
Real Estate Stats by Town
Real Estate Stats by TownReal Estate Stats by Town
Real Estate Stats by Town
 
Market Update 10.09
Market Update 10.09Market Update 10.09
Market Update 10.09
 
Town By Town Analysis Mercer County 8.11.09
Town By Town Analysis Mercer County 8.11.09Town By Town Analysis Mercer County 8.11.09
Town By Town Analysis Mercer County 8.11.09
 
Sales Stats June 15, 2011
Sales Stats June 15, 2011Sales Stats June 15, 2011
Sales Stats June 15, 2011
 
Market Update 6 23 11
Market Update 6 23 11Market Update 6 23 11
Market Update 6 23 11
 
Market Update 6 23 11
Market Update 6 23 11Market Update 6 23 11
Market Update 6 23 11
 
Market Update 5 16 11
Market Update 5 16 11Market Update 5 16 11
Market Update 5 16 11
 
Market Update 6 13 11
Market Update 6 13 11Market Update 6 13 11
Market Update 6 13 11
 
6.30.09
6.30.096.30.09
6.30.09
 

Mais de Weichert Realtors

Weichert, Princeton Fall 2018 Real Estate Market Seminar
Weichert, Princeton Fall 2018 Real Estate Market SeminarWeichert, Princeton Fall 2018 Real Estate Market Seminar
Weichert, Princeton Fall 2018 Real Estate Market SeminarWeichert Realtors
 
Princeton Q3 Real Estate Market Report
Princeton Q3 Real Estate Market ReportPrinceton Q3 Real Estate Market Report
Princeton Q3 Real Estate Market ReportWeichert Realtors
 
Princeton Real Estate Market Report
Princeton Real Estate Market ReportPrinceton Real Estate Market Report
Princeton Real Estate Market ReportWeichert Realtors
 
NJ Residential Tax Appeal Process
NJ Residential Tax Appeal ProcessNJ Residential Tax Appeal Process
NJ Residential Tax Appeal ProcessWeichert Realtors
 
Weichert, Princeton January Market Recap & Forecast
Weichert, Princeton January Market Recap & ForecastWeichert, Princeton January Market Recap & Forecast
Weichert, Princeton January Market Recap & ForecastWeichert Realtors
 
Princeton Market Forecast in Mandarin
Princeton Market Forecast in MandarinPrinceton Market Forecast in Mandarin
Princeton Market Forecast in MandarinWeichert Realtors
 
Princeton Real Estate Market Update December 2017
Princeton Real Estate Market Update December 2017Princeton Real Estate Market Update December 2017
Princeton Real Estate Market Update December 2017Weichert Realtors
 
South Brunswick, NJ Real Estate Summary
South Brunswick, NJ Real Estate SummarySouth Brunswick, NJ Real Estate Summary
South Brunswick, NJ Real Estate SummaryWeichert Realtors
 
Lawrenceville, NJ Real Estate Market Update
Lawrenceville, NJ Real Estate Market UpdateLawrenceville, NJ Real Estate Market Update
Lawrenceville, NJ Real Estate Market UpdateWeichert Realtors
 
Princeton Real Estate October 2017 Market Seminar
Princeton Real Estate October 2017 Market SeminarPrinceton Real Estate October 2017 Market Seminar
Princeton Real Estate October 2017 Market SeminarWeichert Realtors
 
Executive Summary of West Windsor, NJ Real Estate Trends
Executive Summary of West Windsor, NJ Real Estate TrendsExecutive Summary of West Windsor, NJ Real Estate Trends
Executive Summary of West Windsor, NJ Real Estate TrendsWeichert Realtors
 
Weichert Princeton's June 25 Real Estate Market Seminar
Weichert Princeton's June 25 Real Estate Market SeminarWeichert Princeton's June 25 Real Estate Market Seminar
Weichert Princeton's June 25 Real Estate Market SeminarWeichert Realtors
 
Princeton Real Estate Market Presentation June 2017
Princeton Real Estate Market Presentation June 2017Princeton Real Estate Market Presentation June 2017
Princeton Real Estate Market Presentation June 2017Weichert Realtors
 
Princeton Real Estate Inventory Grid
Princeton Real Estate Inventory GridPrinceton Real Estate Inventory Grid
Princeton Real Estate Inventory GridWeichert Realtors
 
Princeton Real Estate Market Presentation March 2017
Princeton Real Estate Market Presentation March 2017Princeton Real Estate Market Presentation March 2017
Princeton Real Estate Market Presentation March 2017Weichert Realtors
 
Princeton Real Estate 2016 Year in Review
Princeton Real Estate 2016 Year in Review Princeton Real Estate 2016 Year in Review
Princeton Real Estate 2016 Year in Review Weichert Realtors
 
Weichert Princeton March 2016 Market Update Seminar
Weichert Princeton March 2016 Market Update SeminarWeichert Princeton March 2016 Market Update Seminar
Weichert Princeton March 2016 Market Update SeminarWeichert Realtors
 
Hopewell Township Real Estate Executive Summary 2016
Hopewell Township Real Estate Executive Summary 2016Hopewell Township Real Estate Executive Summary 2016
Hopewell Township Real Estate Executive Summary 2016Weichert Realtors
 
Executive Summary of the 2015 Princeton Real Estate Market
Executive Summary of the 2015 Princeton Real Estate MarketExecutive Summary of the 2015 Princeton Real Estate Market
Executive Summary of the 2015 Princeton Real Estate MarketWeichert Realtors
 

Mais de Weichert Realtors (20)

Weichert, Princeton Fall 2018 Real Estate Market Seminar
Weichert, Princeton Fall 2018 Real Estate Market SeminarWeichert, Princeton Fall 2018 Real Estate Market Seminar
Weichert, Princeton Fall 2018 Real Estate Market Seminar
 
Princeton Q3 Real Estate Market Report
Princeton Q3 Real Estate Market ReportPrinceton Q3 Real Estate Market Report
Princeton Q3 Real Estate Market Report
 
Princeton Real Estate Market Report
Princeton Real Estate Market ReportPrinceton Real Estate Market Report
Princeton Real Estate Market Report
 
NJ Residential Tax Appeal Process
NJ Residential Tax Appeal ProcessNJ Residential Tax Appeal Process
NJ Residential Tax Appeal Process
 
Weichert, Princeton January Market Recap & Forecast
Weichert, Princeton January Market Recap & ForecastWeichert, Princeton January Market Recap & Forecast
Weichert, Princeton January Market Recap & Forecast
 
Princeton Market Forecast in Mandarin
Princeton Market Forecast in MandarinPrinceton Market Forecast in Mandarin
Princeton Market Forecast in Mandarin
 
Princeton Real Estate Market Update December 2017
Princeton Real Estate Market Update December 2017Princeton Real Estate Market Update December 2017
Princeton Real Estate Market Update December 2017
 
South Brunswick, NJ Real Estate Summary
South Brunswick, NJ Real Estate SummarySouth Brunswick, NJ Real Estate Summary
South Brunswick, NJ Real Estate Summary
 
Lawrenceville, NJ Real Estate Market Update
Lawrenceville, NJ Real Estate Market UpdateLawrenceville, NJ Real Estate Market Update
Lawrenceville, NJ Real Estate Market Update
 
Princeton Real Estate October 2017 Market Seminar
Princeton Real Estate October 2017 Market SeminarPrinceton Real Estate October 2017 Market Seminar
Princeton Real Estate October 2017 Market Seminar
 
Executive Summary of West Windsor, NJ Real Estate Trends
Executive Summary of West Windsor, NJ Real Estate TrendsExecutive Summary of West Windsor, NJ Real Estate Trends
Executive Summary of West Windsor, NJ Real Estate Trends
 
Weichert Princeton's June 25 Real Estate Market Seminar
Weichert Princeton's June 25 Real Estate Market SeminarWeichert Princeton's June 25 Real Estate Market Seminar
Weichert Princeton's June 25 Real Estate Market Seminar
 
Princeton Real Estate Market Presentation June 2017
Princeton Real Estate Market Presentation June 2017Princeton Real Estate Market Presentation June 2017
Princeton Real Estate Market Presentation June 2017
 
Princeton Real Estate Inventory Grid
Princeton Real Estate Inventory GridPrinceton Real Estate Inventory Grid
Princeton Real Estate Inventory Grid
 
Princeton Real Estate Market Presentation March 2017
Princeton Real Estate Market Presentation March 2017Princeton Real Estate Market Presentation March 2017
Princeton Real Estate Market Presentation March 2017
 
Tax appeal seminar
Tax appeal seminarTax appeal seminar
Tax appeal seminar
 
Princeton Real Estate 2016 Year in Review
Princeton Real Estate 2016 Year in Review Princeton Real Estate 2016 Year in Review
Princeton Real Estate 2016 Year in Review
 
Weichert Princeton March 2016 Market Update Seminar
Weichert Princeton March 2016 Market Update SeminarWeichert Princeton March 2016 Market Update Seminar
Weichert Princeton March 2016 Market Update Seminar
 
Hopewell Township Real Estate Executive Summary 2016
Hopewell Township Real Estate Executive Summary 2016Hopewell Township Real Estate Executive Summary 2016
Hopewell Township Real Estate Executive Summary 2016
 
Executive Summary of the 2015 Princeton Real Estate Market
Executive Summary of the 2015 Princeton Real Estate MarketExecutive Summary of the 2015 Princeton Real Estate Market
Executive Summary of the 2015 Princeton Real Estate Market
 

Stat 1 21-13

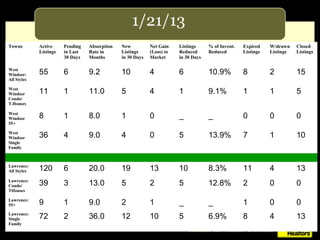
  • 1. 1/21/13 Towns Active Pending Absorption New Net Gain Listings % of Invent. Expired W/drawn Closed Listings in Last Rate in Listings (Loss) to Reduced Reduced Listings Listings Listings 30 Days Months in 30 Days Market in 30 Days West Windsor: 55 6 9.2 10 4 6 10.9% 8 2 15 All Styles West Windsor 11 1 11.0 5 4 1 9.1% 1 1 5 Condo/ T.Houses West Windsor 8 1 8.0 1 0 _ _ 0 0 0 55+ West Windsor 36 4 9.0 4 0 5 13.9% 7 1 10 Single Family Lawrence: All Styles 120 6 20.0 19 13 10 8.3% 11 4 13 Lawrence: Condo/ 39 3 13.0 5 2 5 12.8% 2 0 0 THouses Lawrence: 55+ 9 1 9.0 2 1 _ _ 1 0 0 Lawrence: Single 72 2 36.0 12 10 5 6.9% 8 4 13 Family
  • 2. 1/21/13 Towns Active Pending Absorption New Net Listings % of Expire W/drawn Closed Listings in Last Rate in Listings in Gain Reduced Invent. d Listings Listings 30 Days Months 30 Days (Loss) in 30 Reduced Listing to Days s Market Plainsboro All Styles Plainsboro Condo/ THouses Plainsboro 55+ Plainsboro Single Family Cranbury: All Styles
  • 3. 1/21/13 Towns Active Pending Absorption New Net Gain Listings % of Expired W/drawn Closed Listings in Last Rate in Listings in (Loss) to Reduced in Invent. Listings Listings Listings 30 Days Months 30 Days Market 30 Days Reduced Ewing: All Styles 196 14 14 27 13 31 16% 16 6 13 Ewing : Condo/ 28 3 9 5 2 6 21% 1 4 1 T.Houses Ewing 55+: 8 1 8 2 1 --- --- 0 0 0 Ewing: Single 160 10 16 20 10 25 15% 15 2 12 Family East Windsor: 143 9 16 26 17 18 13% 10 2 13 All Styles East Windsor: 87 5 17 16 11 13 15% 7 1 9 Condo/ Thouses East Windsor: 8 0 999 1 1 --- --- 0 0 3 55+ East Windsor: 48 4 12 9 5 5 10% 3 1 1 Single Family
  • 4. 1/21/13 Towns Active Pending Absorption New Net Gain Listings % of Expired W/drawn Closed Listings in Last Rate in Listings in (Loss) to Reduced in Invent. Listings Listings Listings 30 Days Months 30 Days Market 30 Days Reduced Hopewell Twp. 103 5 20.6 14 9 10 9.7% 11 8 7 All Styles Hopewell Twp. Condo/ 5 0 99 1 1 1 20% 2 1 1 T.Houses Hopewell Twp.: 1 0 99 0 0 -- -- 0 0 1 55+ Hopewell Twp Single Family 97 5 19.4 13 8 9 9.3% 9 7 5 388 27 14.4 57 30 66 17% 26 15 33 Hamilton: All Styles 80 6 13.3 10 4 17 21.3% 4 3 6 Hamilton: Condo/ THouses 21 0 99 7 7 -- -- 1 1 2 Hamilton: 55+ 287 21 13.7 40 19 49 17.1% 21 11 25 Hamilton: Single Family
  • 5. 1/21/13 Towns Active Pending Absorption New Net Gain Listings % of Expired W/drawn Closed Listing in Last Rate in Listings (Loss) to Reduced Invent. Listings Listings Listings 30 Days Months in 30 Market in 30 Days Reduced Days 61 10 6 6 (4) 12 20% 11 5 13 Robbinsville All Styles 32 6 5 3 (6) 6 19% 6 2 7 Robbinsville Condo/ T.Houses 29 4 7 3 (1) 6 21% 5 3 6 Single Family 51 3 17 6 3 11 22% 6 0 4 Hightstown Boro: All Styles 15 1 15 2 1 2 13% 2 0 4 Pennington 6 3 2 1 (2) 4 67% 0 2 1 Hopewell Boro
  • 6. 1/21/13 Towns Active Pending Absorption New Net Gain Listings % of Expired W/drawn Closed Listings in Last Rate in Listings in (Loss) to Reduced Invent. Listings Listings Listings 30 Days Months 30 Days Market in 30 Reduced Days 106 7 15.1 10 3 11 10.4% 8 7 21 Princeton: All Styles 31 1 31 3 2 3 9.7% 3 1 4 Princeton: Condo/ Thouses 75 6 12.5 7 1 8 10.7% 5 6 17 Princeton: Single Family
  • 7. 1/21/13 Towns Active Pending Absorption New Net Gain Listings % of Expired W/drawn Closed Listings in Last Rate in Listings in (Loss) to Reduced Invent. Listings Listings Listings 30 Days Months 30 Days Market in 30 Days Reduced South Brunswick 154 6 25 18 12 14 1 34 3 36 All Styles South BrunswickCon do/ T.Houses 50 3 16 7 4 7 14 11 0 9 South Brunswick 34 0 99 1 1 5 17 1 1 3 55+ South Brunswick 70 3 22 10 7 2 3 22 2 24 Single Family Monroe: All Styles 396 22 18 80 58 24 6 48 4 63 Monroe: 55+ 262 19 13 61 42 17 6 28 2 50 Monroe: Single Family 134 3 44 19 16 7 5 20 2 13
  • 8. 1/21/13 Towns Active Pending Absorption New Net Gain Listings % of Expired W/drawn Closed Listings in Last Rate in Listings in (Loss) to Reduced Invent. Listings Listings Listings 30 Days Months 30 Days Market in 30 Days Reduced 86 23 3.3 20 -3 11 13% 14 6 11 Montgomery All Styles 11 4 2.7 6 +2 1 9% 3 2 2 Montgomery Condo/Twnhms 75 19 3.9 14 -5 10 13% 11 4 9 Single Family 169 22 7.7 41 +19 22 13% 16 8 16 Hillsborough All Styles 66 8 8.2 20 +12 10 15% 8 5 9 Hillsborough Condo/Twnhms 103 14 7.3 21 +7 12 13% 8 3 7 Hillsborough Single Family

Notas do Editor

  1. Populate this table to show the local absorption rate in the various price ranges that are appropriate for your market area. Please add or delete rows as necessary to adequately reflect local conditions.
  2. Populate this table to show the local absorption rate in the various price ranges that are appropriate for your market area. Please add or delete rows as necessary to adequately reflect local conditions.
  3. Populate this table to show the local absorption rate in the various price ranges that are appropriate for your market area. Please add or delete rows as necessary to adequately reflect local conditions.
  4. Populate this table to show the local absorption rate in the various price ranges that are appropriate for your market area. Please add or delete rows as necessary to adequately reflect local conditions.
  5. Populate this table to show the local absorption rate in the various price ranges that are appropriate for your market area. Please add or delete rows as necessary to adequately reflect local conditions.
  6. Populate this table to show the local absorption rate in the various price ranges that are appropriate for your market area. Please add or delete rows as necessary to adequately reflect local conditions.
  7. Populate this table to show the local absorption rate in the various price ranges that are appropriate for your market area. Please add or delete rows as necessary to adequately reflect local conditions.
  8. Populate this table to show the local absorption rate in the various price ranges that are appropriate for your market area. Please add or delete rows as necessary to adequately reflect local conditions.