
Recomendados
Mais conteúdo relacionado
Mais procurados
Mais procurados (17)
Destaque
Semelhante a 2012 Executive Compensation Results
Semelhante a 2012 Executive Compensation Results (20)
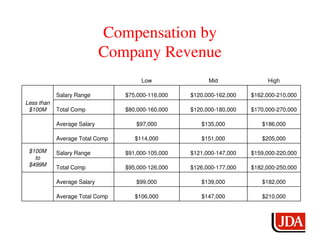
2012 Executive Compensation Results
- 1. Compensation by Company Revenue Low Mid High Salary Range $75,000-116,000 $120,000-162,000 $162,000-210,000 Less than $100M Total Comp $80,000-160,000 $120,000-180,000 $170,000-270,000 Average Salary $97,000 $135,000 $186,000 Average Total Comp $114,000 $151,000 $205,000 $100M Salary Range $91,000-105,000 $121,000-147,000 $159,000-220,000 to $499M Total Comp $95,000-126,000 $126,000-177,000 $182,000-250,000 Average Salary $99,000 $139,000 $182,000 Average Total Comp $106,000 $147,000 $210,000
- 2. Compensation by Company Revenue Low Mid High $500M Salary Range $145,000-185,000 $221,000-235,000 $256,000-290,000 to $999M Total Comp $175,000-260,000 $221,000-420,000 $385,000-520,000 Average Salary $166,000 $228,000 $270,000 Average Total Comp $226,000 $242,000 $379,000 Greater Salary Range $120,000-168,000 $176,000-225,000 $235,000-300,000 than $1B Total Comp $138,000-250,000 $210,000-450,000 $255,000-500,000 Average Salary $146,000 $200,000 $261,000 Average Total Comp $176,000 $305,000 $362,000
- 3. Compensation by Department Size Low Mid High Less than Salary Range $70,000-99,000 $100,000-125,000 $130,000-221,000 10 People Total Comp $70,000-160,000 $100,000-147,000 $152,000-240,000 Average Salary $85,000 $109,000 $169,000 Average Total Comp $96,000 $116,000 $184,000 10 to Salary Range $105,000-138,000 $140,000-162,000 $170,000-256,000 49 People Total Comp $114,000-140,000 $140,000-190,000 $200,000-350,000 Average Salary $122,000 $157,000 $195,000 Average Total Comp $129,000 $166,000 $262,000
- 4. Compensation by Department Size Low Mid High 50 to Salary Range $95,000-110,000 $120,000-168,000 $210,000-265,000 99 People* Total Comp $106,000-138,000 $150,000-215,000 $250,000-350,000 Average Salary $105,500 $139,200 $244,000 Average Total Comp $121,600 $168,700 $307,333 Salary Range $120,000-160,000 $165,000-220,000 $225,000-290,000 100+ People Total Comp $138,000-200,000 $175,000-450,000 $255,000-520,000 Average Salary $136,000 $191,000 $251,000 Average Total Comp $157,000 $261,000 $375,000 *Limited data pool in this group
- 5. Base Salary Increases 2011 2012 6% 2% 8% 3% 39% 48% 42% 52% < 3% 3-6% 7-10% >10%
- 6. Bonus Increases 2011 2012 19% 18% 37% 39% 16% 19% 26% 26% < 10% 10-20% 21-30% >30%
- 7. Employed Workers Looking • Active – 11% • Passive – 62% 11% • Not at all – 27% 27% 62%