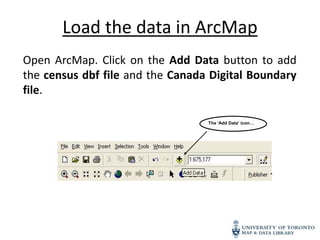
1. Load the data in ArcMap
Open ArcMap. Click on the Add Data button to add
the census dbf file and the Canada Digital Boundary
file.
The ‘Add Data’ icon…
3. Join the two files
• To join the two files, a
common field containing
the same values must be
identified.
• To identify a common, open
the attribute table for both
files by right clicking on
each file and selecting Open
Attribute Table.
4. • You will notice that
CTUID from the
boundary file is
common to COL1 in
the census table. We
will use these two
fields highlighted
below for our join.
• Close the Attribute
Tables.
5. • To join the census data
to the boundary
file, right click on the
boundary file and
select “Join and
Relates.”
• Select “Join.”
Note: Do not join starting
with the dbf file to the
boundary file.
6. In this Join window, choose
the fields that the join will be
based on.
• In this example, we use
CTUID, and are basing this
join on COL1 from the
census table.
• Select the radio bottom to
“keep only matching
records”
• Click OK.
11. Under
Quantities on
the left, select
Graduated
Colors.
You can now
visualize the
census data
using the color
ramp
In this example,
we chose to
visualize col4