Understanding Discord NSFW Servers A Guide for Responsible Users.pdf
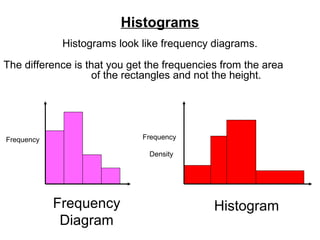
Histograms
1. Histograms
Histograms look like frequency diagrams.
The difference is that you get the frequencies from the area
of the rectangles and not the height.
Frequency
Frequency
Density
Frequency
Diagram
Histogram
2. Histograms can be used when
the class intervals are unequal.
Time
Frequency
0 < t < 10
20
10 < t < 20
15
20 < t < 30
10
30 < t < 40
9
40 < t < 50
6
Time
Frequency
0 < t < 10
20
10 < t < 15
15
15 < t < 20
10
20 < t < 25
9
25 < t < 40
6
Equal Class Intervals
Unequal Class Intervals
3. With a histogram you cant not get the
frequency from the height of the bar.
Instead you get the frequency from the area of the bar.
Frequency is equal to the Area of the Bar.
Frequency Density is equal to the Height of the Bar.
frequency
Frequency density =
width of interval
0.4
95
110
105
Width of interval = 10
Height (Frequency density) = 0.4
Area (Frequency) = 4
4. Find the relevant information for each bar.
0.5
?
10
Width of interval = 10
Frequency density = 0.5
Frequency = 5
1.2
?
?
2
Width of interval = 5
Frequency = 2
Frequency density = 0.4
5
2
8
?
20
Width of interval = 20
Frequency density = 1.2
Frequency = 24
Frequency = 8
Frequency density = 2
Width of interval = 4
5. Time
Frequency
0 < t < 10
20
10 < t < 15
15
15 < t < 20
10
20 < t < 25
9
25 < t < 40
6
Frequency
Frequency
=
Density
Class width
Frequency
Density
2
3
2
1.8
0.4
20 ÷ 10
15 ÷ 5
10 ÷ 5
9÷5
6 ÷ 15
3.0
2.5
Frequency 2.0
Density
1.5
1.0
0.5
0
Time
0
5
10
15
20
25
30
35
40
6. Distance
Frequency
0 < t < 20
2
20 < t < 40
4
40 < t < 50
5
50 < t < 70
12
70 < t < 100
9
Frequency
Density
0.1
0.2
0.5
0.6
0.3
2 ÷ 20
4 ÷ 20
5 ÷ 10
12 ÷ 20
9 ÷ 30
0.6
0.5
Frequency
Density
0.4
0.3
0.2
0.1
0
10
20
30
40
50
Distance
60
70
80
90
100
7. Remember for a histogram the:
Frequency is equal to the Area of the bar.
Frequency Density is equal to the Height of the bar.
0.5
?
1.25
?
0.8
?
15
8
Area = 15 x 0.5 = 7.5
Area = 1.25 x 8 = 10
20
Area = 20 x 0.8 = 16
8. Copy and complete the table.
Frequency = frequency density × width of interval
Frequency density
2.4
2.0
Time in
seconds
1.6
Frequency
Area
density × (frequency)
width
1.2
95 ≤ t < 105
0.4 × 10
4
0.8
105 ≤ t < 110
1.2 × 5
6
0.4
110 ≤ t < 115
1.4 × 5
7
115 ≤ t < 120
2.2 × 5
11
120 ≤ t < 135
0.4 × 15
6
0
95 100 105 110 115 120 125 130 135
Time in seconds
10. Graph to compare the distances that males and females travel in the car per week.
50
40
30
20
10
0
Distance
0
20
40
60
80
100
120
140
160
180
0
20
40
60
80
100
120
140
160
180 Distance
50
40
30
20
10
0
11. Length
Frequency
0 < t < 40
40 < t < 80
80 < t < 100
100 < t <
120
120 < t <
200
Length
0 < t < 40
40 < t < 80
80 < t < 100
100 < t <
120
120 < t <
200
Frequency
12. Review
Write a definition of each word below.
Include methods for calculating.
Data set
Frequency
Class interval
Frequency polygon
Midpoint
Class interval
Range
Histogram
Frequency diagram
Frequency density
Notas do Editor
The results obtained should be compared with the original graph.